200052 Introduction to Economic Methods Computing Assignment

Verified

Added on  2023/03/31

|4
|398
|136
Homework Assignment
AI Summary
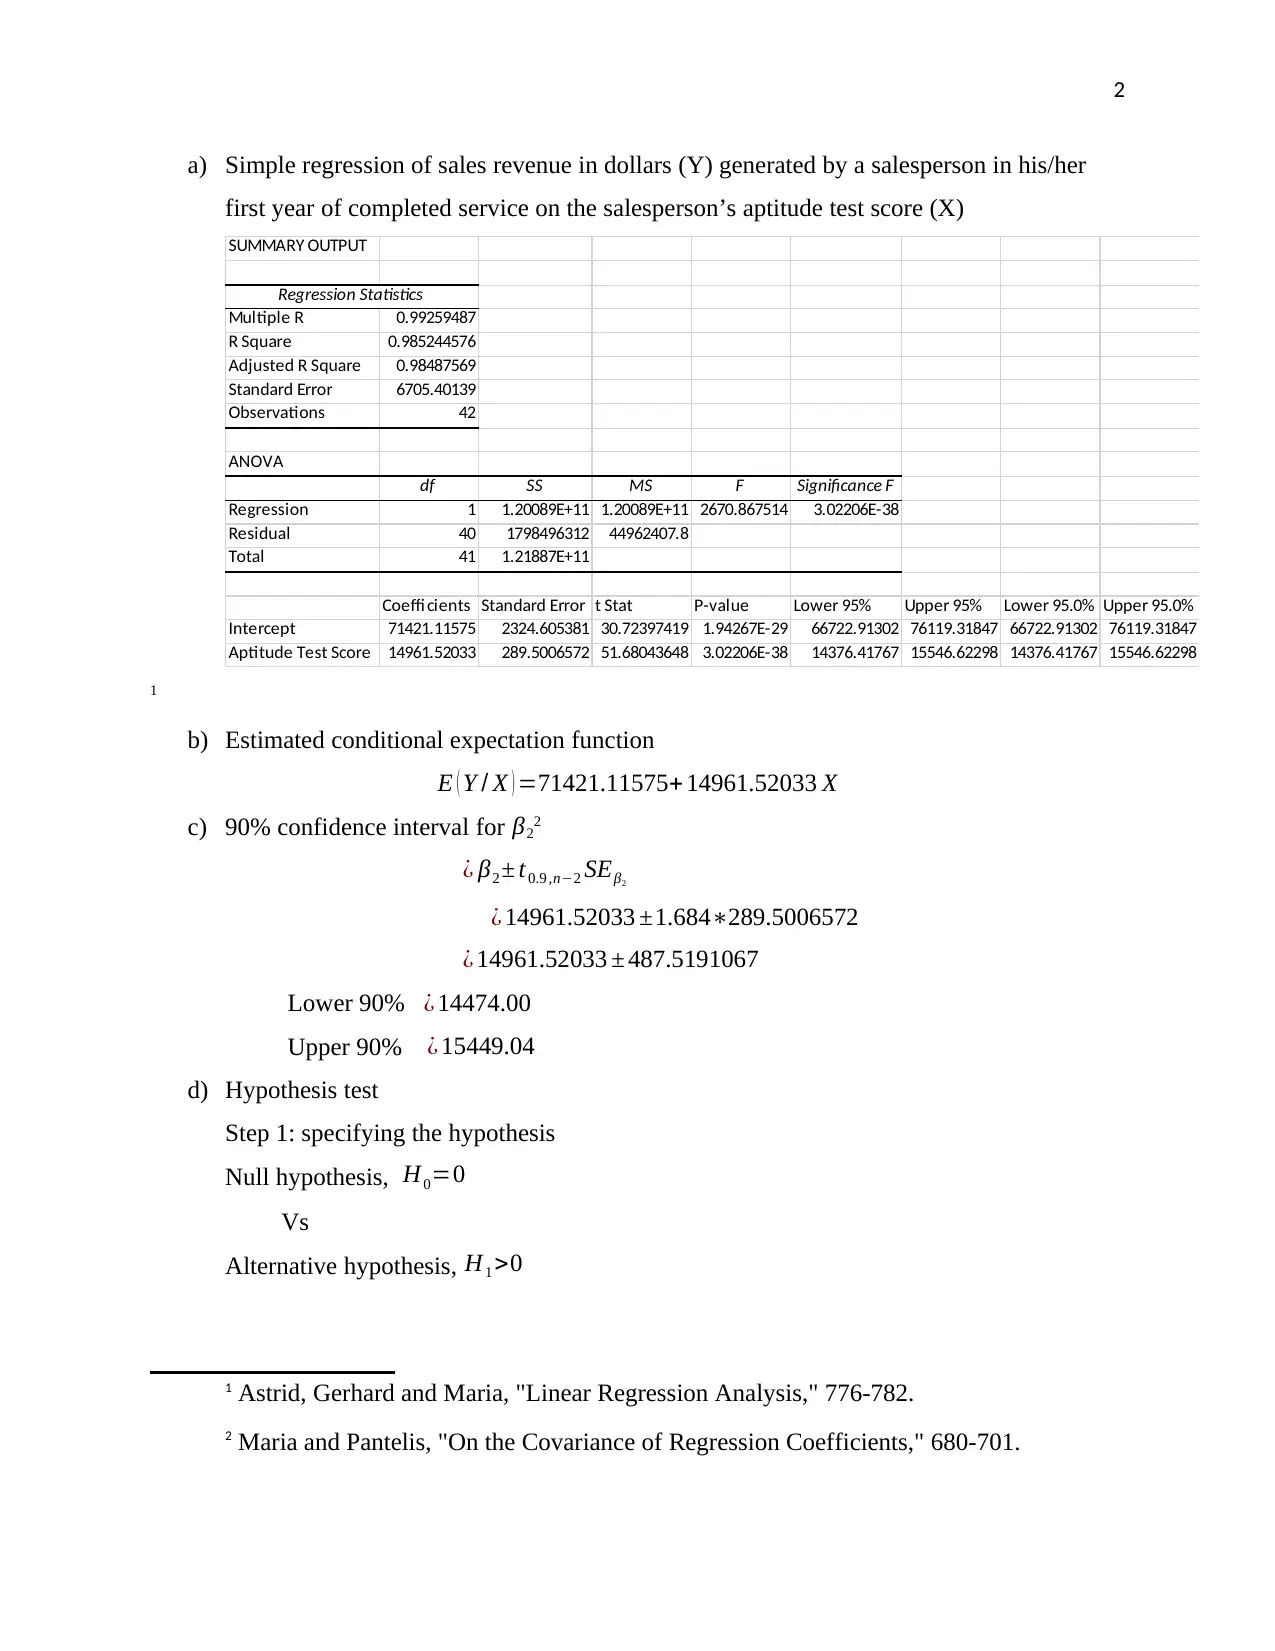
This assignment solution focuses on applying linear regression to analyze the relationship between a salesperson's aptitude test score and their generated sales revenue. The solution begins with an introduction and presents a regression analysis using Excel, providing a summary output with key statistics such as R-squared, coefficients, and standard errors. The estimated conditional expectation function is derived, and a 90% confidence interval for the regression coefficient is calculated. A detailed hypothesis test is conducted, including null and alternative hypotheses, significance level, decision rule, test statistic calculation, and interpretation. The coefficient of determination is also interpreted. The assignment uses a dataset of 42 salespeople to demonstrate the positive linear relationship between aptitude test scores and sales revenue, concluding that higher aptitude scores correlate with increased sales performance. References to relevant academic sources are included.
Document Page
1
INTRODUCTION TO ECONOMIC METHODS
by Student’s Name
Code + Name of Course
Professor’s Name
University
City (State)
Date
tabler-icon-diamond-filled.svg

Paraphrase This Document

Need a fresh take? Get an instant paraphrase of this document with our AI Paraphraser
Document Page
2
a) Simple regression of sales revenue in dollars (Y) generated by a salesperson in his/her
first year of completed service on the salesperson’s aptitude test score (X)
SUMMARY OUTPUT
Regression Statistics
Multiple R 0.99259487
R Square 0.985244576
Adjusted R Square 0.98487569
Standard Error 6705.40139
Observations 42
ANOVA
df SS MS F Significance F
Regression 1 1.20089E+11 1.20089E+11 2670.867514 3.02206E-38
Residual 40 1798496312 44962407.8
Total 41 1.21887E+11
Coeffi cients Standard Error t Stat P-value Lower 95% Upper 95% Lower 95.0% Upper 95.0%
Intercept 71421.11575 2324.605381 30.72397419 1.94267E-29 66722.91302 76119.31847 66722.91302 76119.31847
Aptitude Test Score 14961.52033 289.5006572 51.68043648 3.02206E-38 14376.41767 15546.62298 14376.41767 15546.62298
1
b) Estimated conditional expectation function
E ( Y / X ) =71421.11575+ 14961.52033 X
c) 90% confidence interval for β22
¿ β2 ± t0.9 ,n2 SEβ2
¿ 14961.52033 ±1.684289.5006572
¿ 14961.52033 ± 487.5191067
Lower 90% ¿ 14474.00
Upper 90% ¿ 15449.04
d) Hypothesis test
Step 1: specifying the hypothesis
Null hypothesis, H0=0
Vs
Alternative hypothesis, H1 >0
1 Astrid, Gerhard and Maria, "Linear Regression Analysis," 776-782.
2 Maria and Pantelis, "On the Covariance of Regression Coefficients," 680-701.
Document Page
3
Step 2: determining the level of significance
Level of significance is 5% which means α =0.05
Step 3: stating the decision rule
The decision rule is to reject H0 if the observed pvalue <0.05
Step 4: calculating the test statistic
The test statistic has been calculated using excel and displayed in the regression model
table above
The coefficient’s p¿ value=3.02211038
Step 5: making the decision
Since the pvalue is less than 0.05, we reject H0 and conclude that at 95% significance level
there is a significant positive linear relationship between sales revenue generated and
aptitude test score.
Step 6: interpreting the decision
From the decision we can interpret that the aptitude test score of a salesperson indeed
affects the sales revenue generated in a positive manner.
e) The coefficient of determination is 0.9852
This means that 98.52% of change in sales revenue generated is affected by the
relationship between aptitude test score of a salesperson and sales revenue generated.
Document Page
4
References
Astrid, Gerhard, and Maria. 2010. "Linear Regression Analysis." Dtsch Arztebl Int 107(44), 776-782.
Maria, and Pantelis. 2015. "On the Covariance of Regression Coefficients." Journal of Statistics 5(7), 680-
701.
chevron_up_icon
1 out of 4
circle_padding
hide_on_mobile
zoom_out_icon
[object Object]