Economic Operations, Warranty, and Repair Costs in Trucking Industry

Verified

Added on  2023/05/29

|5
|1098
|434
Report
AI Summary
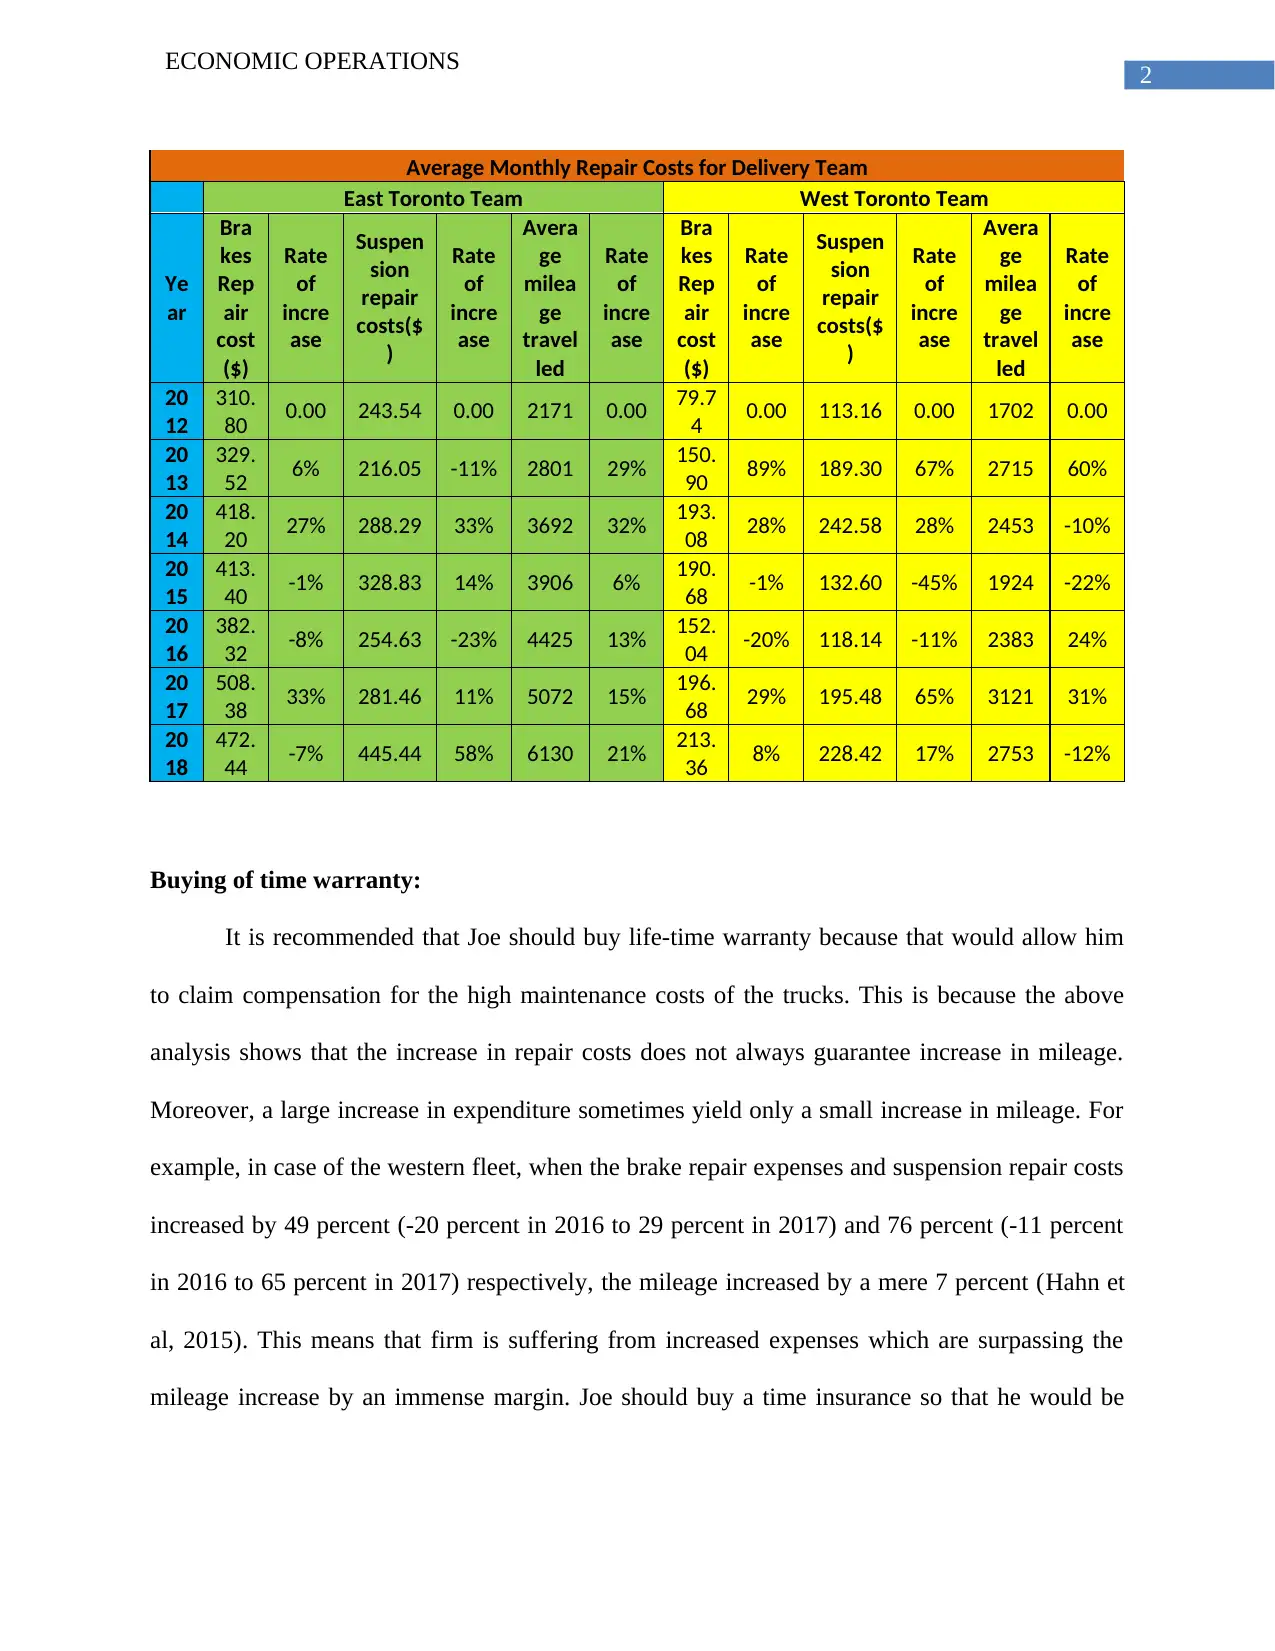
This report analyzes the economic operations within the trucking industry, focusing on the relationship between fleet mileage and repair costs for both eastern and western fleets. It reveals an inverse relationship where high brake repair costs lead to less average mileage, though not at a constant rate. The report also highlights that brake repair expenses have a more significant impact on mileage compared to suspension costs. Furthermore, it recommends that Joe, presumably a stakeholder, should consider purchasing a lifetime warranty to mitigate the impact of high maintenance costs, as increased repair expenses do not always guarantee increased mileage. The report advises comparing different warranty packages and seeking feedback from other businessmen to choose the most suitable option. Desklib provides a platform for students to access this report and other solved assignments.
Document Page
Running head: ECONOMIC OPERATIONS
Economic operations and warranty in Trucking Industry
Name of the Student
Name of the University
Author note
tabler-icon-diamond-filled.svg

Paraphrase This Document

Need a fresh take? Get an instant paraphrase of this document with our AI Paraphraser
Document Page
1
ECONOMIC OPERATIONS
Average fleet mileage and overall repair costs:
Analysis of the fleet mileage and the repair costs of the eastern and western fleet reveals a
strong relationship between the two variables, though the rate is not constant. A review of the
mileage shows that there exists a relationship between brake expenses and the mileage costs. For
example, when the brake repair expenses increase by 6 percent in 2013 in case of eastern fleet,
the mileage cost increases by only 29 percent. When the brake repair cost increase from 6
percent to 27 percent which is by as much as 17 percent, the mileage expense increased by 3
percent to only 32 percent in 2014. When the rate of brake repair increased by a mere -1 percent
in mileage expenses percent increase fell to 6 percent in 2015. The mileage expenses increased to
a 13 percent in 2016 when the brake repair expenses fell to a -8 percent which means the brake
repair expenses fell. Again in 2017, when the brake repair expenses increased to 33 percent in
2017, the mileage expenses increased to 15 percent compared to previous year increase rate of 13
percent. Similar relationship between the two variables was more or less inversely proportional
in case of the western fleet. The brake repair expenses increased from 89 percent, the average
mileage travelled increased by only 60 percent. When the brake repair costs fell to 28 percent in
2014, the mileage travelled fell to -10 percent. Thus, it can be established that high brake repair
cost resulted less average mileage travelled, though the rate does not remain constant. This trend
is applicable for both eastern and western fleet is calculated in the chart below. It can also be
pointed out that increase in suspension cost has less impact on the mileage travelled compared to
brake repair cost. For example, increase in suspension cost from -11 percent to 33 percent, does
not actually lessen mileage travelled. But when brake repair fell, mileage fell too. Thus, brake
repair expenses have more intense impact on mileage compared to suspension cost.
Document Page
2
ECONOMIC OPERATIONS
Average Monthly Repair Costs for Delivery Team
East Toronto Team West Toronto Team
Ye
ar
Bra
kes
Rep
air
cost
($)
Rate
of
incre
ase
Suspen
sion
repair
costs($
)
Rate
of
incre
ase
Avera
ge
milea
ge
travel
led
Rate
of
incre
ase
Bra
kes
Rep
air
cost
($)
Rate
of
incre
ase
Suspen
sion
repair
costs($
)
Rate
of
incre
ase
Avera
ge
milea
ge
travel
led
Rate
of
incre
ase
20
12
310.
80 0.00 243.54 0.00 2171 0.00 79.7
4 0.00 113.16 0.00 1702 0.00
20
13
329.
52 6% 216.05 -11% 2801 29% 150.
90 89% 189.30 67% 2715 60%
20
14
418.
20 27% 288.29 33% 3692 32% 193.
08 28% 242.58 28% 2453 -10%
20
15
413.
40 -1% 328.83 14% 3906 6% 190.
68 -1% 132.60 -45% 1924 -22%
20
16
382.
32 -8% 254.63 -23% 4425 13% 152.
04 -20% 118.14 -11% 2383 24%
20
17
508.
38 33% 281.46 11% 5072 15% 196.
68 29% 195.48 65% 3121 31%
20
18
472.
44 -7% 445.44 58% 6130 21% 213.
36 8% 228.42 17% 2753 -12%
Buying of time warranty:
It is recommended that Joe should buy life-time warranty because that would allow him
to claim compensation for the high maintenance costs of the trucks. This is because the above
analysis shows that the increase in repair costs does not always guarantee increase in mileage.
Moreover, a large increase in expenditure sometimes yield only a small increase in mileage. For
example, in case of the western fleet, when the brake repair expenses and suspension repair costs
increased by 49 percent (-20 percent in 2016 to 29 percent in 2017) and 76 percent (-11 percent
in 2016 to 65 percent in 2017) respectively, the mileage increased by a mere 7 percent (Hahn et
al, 2015). This means that firm is suffering from increased expenses which are surpassing the
mileage increase by an immense margin. Joe should buy a time insurance so that he would be
Document Page
3
ECONOMIC OPERATIONS
able to claim some portions of the expenses from the insurance company throughout the lifetime
of the business (Makarova et al., 2015).
Joe should analyse and compare between different packages of time warranty available
with different insurance companies as well as banks. Then he should also obtain the feedback
from businessmen using similar product and then choose the life time warranty package most
appropriate for his business (He et al., 2017).
tabler-icon-diamond-filled.svg

Paraphrase This Document

Need a fresh take? Get an instant paraphrase of this document with our AI Paraphraser
Document Page
4
ECONOMIC OPERATIONS
References:
Hahn, J. S., Sung, H. M., Park, M. C., Kho, S. Y., & Kim, D. K. (2015). Empirical evaluation on
the efficiency of the trucking industry in Korea. KSCE Journal of Civil
Engineering, 19(4), 1088-1096.
He, S., Zhang, Z., Zhang, G., & He, Z. (2017). Two-dimensional base warranty design based on
a new demand function considering heterogeneous usage rate. International Journal of
Production Research, 55(23), 7058-7072.
Husniah, H., Pasaribu, U. S., Cakravastia, A., & Iskandar, B. P. (2014). Two dimensional
maintenance contracts for a fleet of dump trucks used in mining industry. In Applied
Mechanics and Materials (Vol. 660, pp. 1026-1031). Trans Tech Publications.
Makarova, I., Khabibullin, R., Belyaev, E., & Belyaev, A. (2015). Improving the system of
warranty service of trucks in foreign markets. Transport Problems, 10.
chevron_up_icon
1 out of 5
circle_padding
hide_on_mobile
zoom_out_icon
[object Object]