Supply Chain Optimization: EOQ Analysis for Low Nail Company - SCM

Verified

Added on  2023/04/07

|6
|685
|336
Homework Assignment
AI Summary
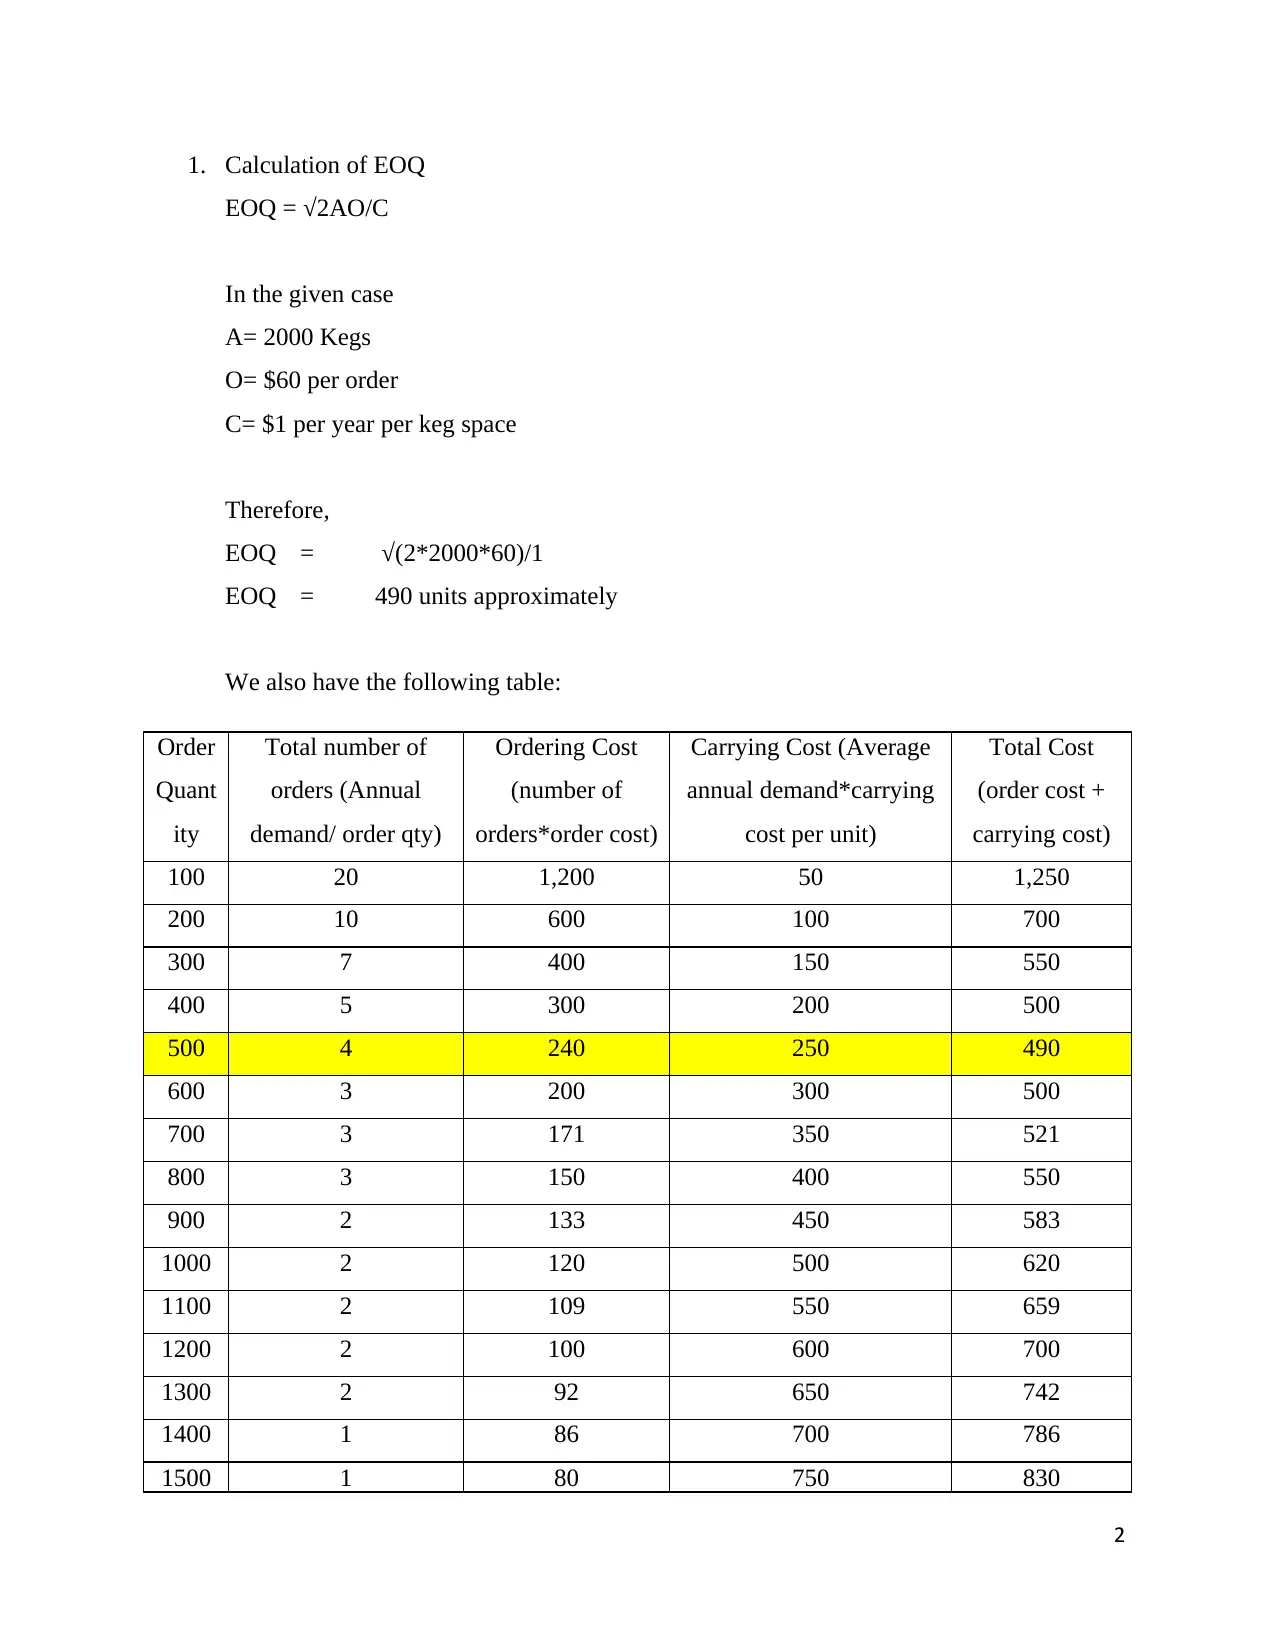
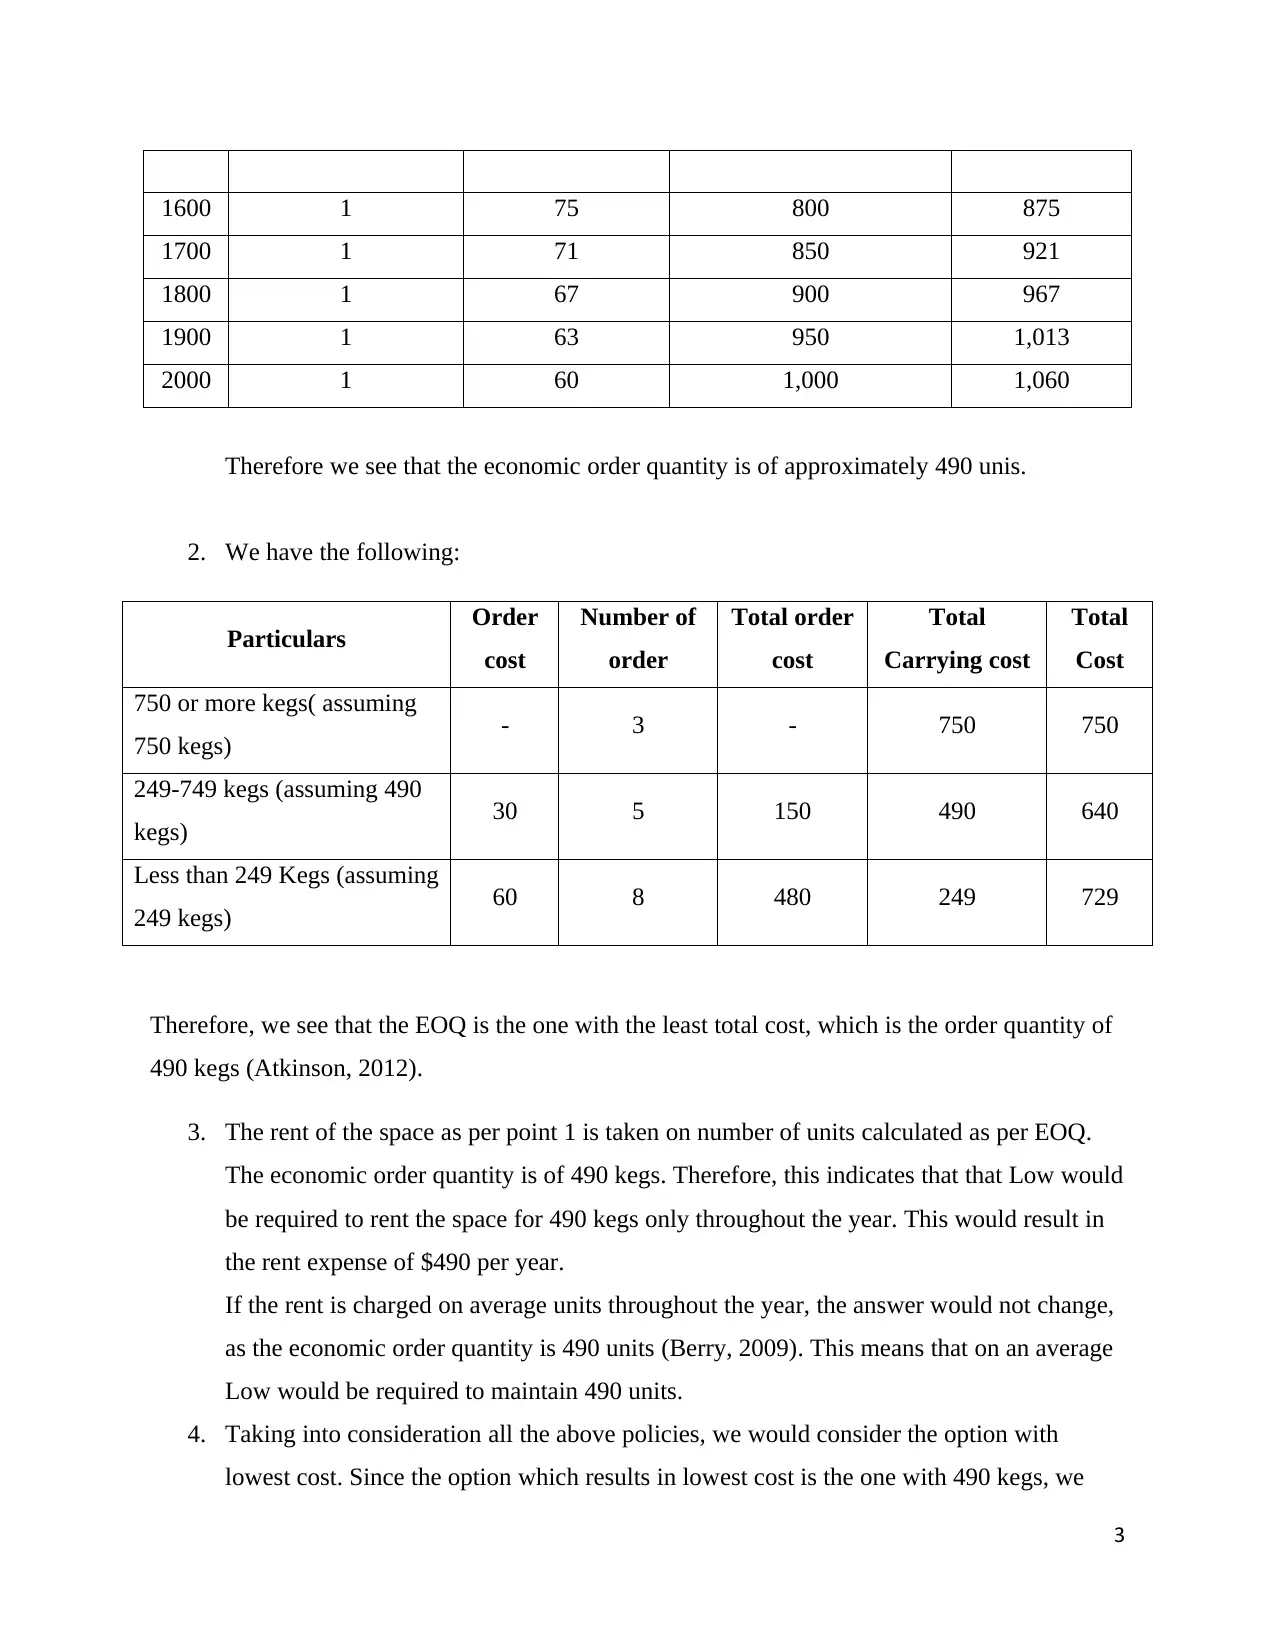
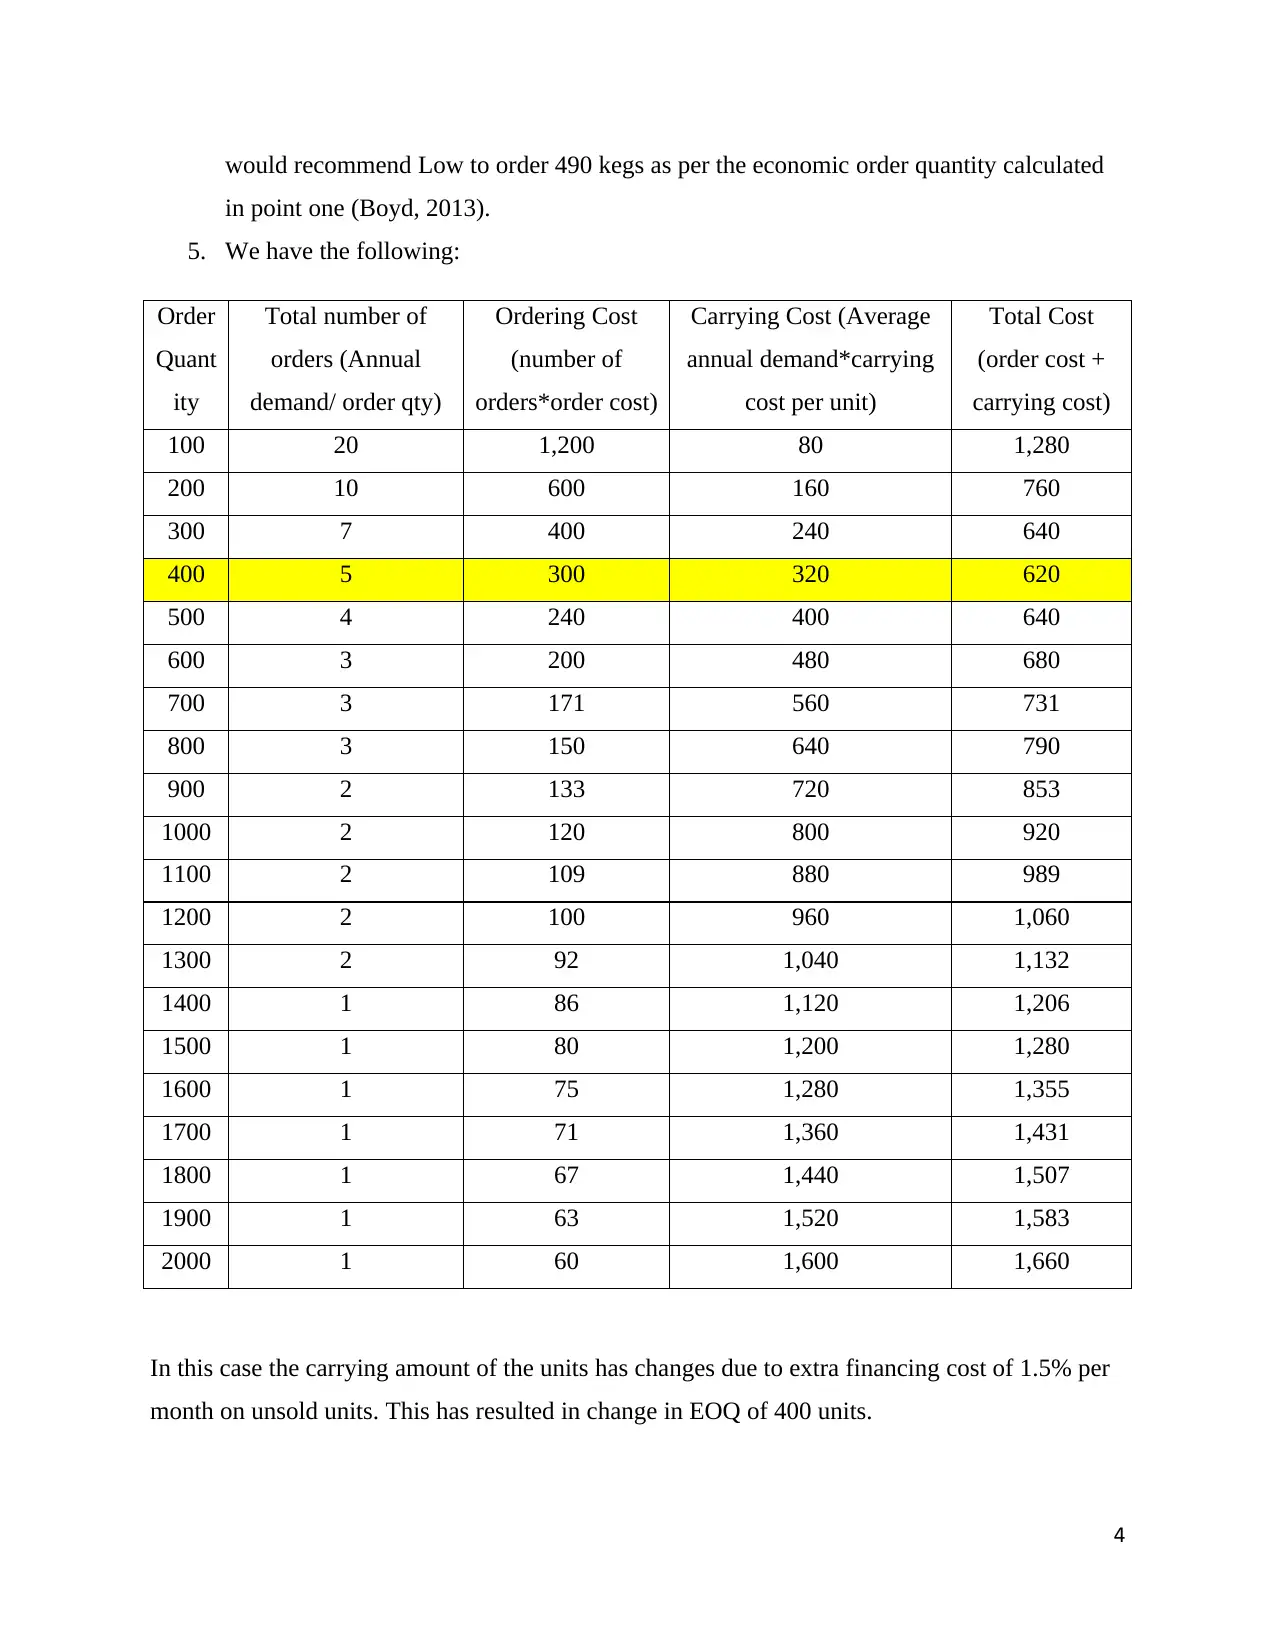
This assignment provides a detailed analysis of the Economic Order Quantity (EOQ) for the Low Nail Company. The solution begins with the calculation of the EOQ, determining the optimal order quantity to minimize costs based on order processing costs and warehousing costs. A comprehensive table is presented to illustrate the relationship between order quantity, ordering costs, carrying costs, and total costs. The analysis extends to evaluating different order quantity scenarios, considering the impact of varying order sizes on total costs. Furthermore, the assignment addresses the implications of warehouse space rental based on the EOQ and recommends the best course of action for the company. The solution also considers the impact of extra financing costs on unsold units, modifying the EOQ calculation accordingly. The conclusion offers a final recommendation, suggesting the optimal EOQ level for Low Nail Company to minimize overall costs. The document includes references to relevant management accounting literature.
Document Page
SUPPLY CHAIN MANAGEMENT
1
tabler-icon-diamond-filled.svg

Paraphrase This Document

Need a fresh take? Get an instant paraphrase of this document with our AI Paraphraser
Document Page
1. Calculation of EOQ
EOQ = √2AO/C
In the given case
A= 2000 Kegs
O= $60 per order
C= $1 per year per keg space
Therefore,
EOQ = √(2*2000*60)/1
EOQ = 490 units approximately
We also have the following table:
Order
Quant
ity
Total number of
orders (Annual
demand/ order qty)
Ordering Cost
(number of
orders*order cost)
Carrying Cost (Average
annual demand*carrying
cost per unit)
Total Cost
(order cost +
carrying cost)
100 20 1,200 50 1,250
200 10 600 100 700
300 7 400 150 550
400 5 300 200 500
500 4 240 250 490
600 3 200 300 500
700 3 171 350 521
800 3 150 400 550
900 2 133 450 583
1000 2 120 500 620
1100 2 109 550 659
1200 2 100 600 700
1300 2 92 650 742
1400 1 86 700 786
1500 1 80 750 830
2
Document Page
1600 1 75 800 875
1700 1 71 850 921
1800 1 67 900 967
1900 1 63 950 1,013
2000 1 60 1,000 1,060
Therefore we see that the economic order quantity is of approximately 490 unis.
2. We have the following:
Particulars Order
cost
Number of
order
Total order
cost
Total
Carrying cost
Total
Cost
750 or more kegs( assuming
750 kegs) - 3 - 750 750
249-749 kegs (assuming 490
kegs) 30 5 150 490 640
Less than 249 Kegs (assuming
249 kegs) 60 8 480 249 729
Therefore, we see that the EOQ is the one with the least total cost, which is the order quantity of
490 kegs (Atkinson, 2012).
3. The rent of the space as per point 1 is taken on number of units calculated as per EOQ.
The economic order quantity is of 490 kegs. Therefore, this indicates that that Low would
be required to rent the space for 490 kegs only throughout the year. This would result in
the rent expense of $490 per year.
If the rent is charged on average units throughout the year, the answer would not change,
as the economic order quantity is 490 units (Berry, 2009). This means that on an average
Low would be required to maintain 490 units.
4. Taking into consideration all the above policies, we would consider the option with
lowest cost. Since the option which results in lowest cost is the one with 490 kegs, we
3
Document Page
would recommend Low to order 490 kegs as per the economic order quantity calculated
in point one (Boyd, 2013).
5. We have the following:
Order
Quant
ity
Total number of
orders (Annual
demand/ order qty)
Ordering Cost
(number of
orders*order cost)
Carrying Cost (Average
annual demand*carrying
cost per unit)
Total Cost
(order cost +
carrying cost)
100 20 1,200 80 1,280
200 10 600 160 760
300 7 400 240 640
400 5 300 320 620
500 4 240 400 640
600 3 200 480 680
700 3 171 560 731
800 3 150 640 790
900 2 133 720 853
1000 2 120 800 920
1100 2 109 880 989
1200 2 100 960 1,060
1300 2 92 1,040 1,132
1400 1 86 1,120 1,206
1500 1 80 1,200 1,280
1600 1 75 1,280 1,355
1700 1 71 1,360 1,431
1800 1 67 1,440 1,507
1900 1 63 1,520 1,583
2000 1 60 1,600 1,660
In this case the carrying amount of the units has changes due to extra financing cost of 1.5% per
month on unsold units. This has resulted in change in EOQ of 400 units.
4
tabler-icon-diamond-filled.svg

Paraphrase This Document

Need a fresh take? Get an instant paraphrase of this document with our AI Paraphraser
Document Page
6. Considering all the above calculations, we can conclude that the best option for Low is to
maintain the EOQ level of 490 units, as it results in the lowest total cost for maintenance
of the stock (Holtzman, 2013). Hence, to conclude we recommend Low to maintain the
EOQ level of 490 units.
5
Document Page
References:
Atkinson, A. A. (2012). Management accounting. Upper Saddle River, N.J.: Paerson.
Berry, L. E. (2009). Management accounting demystified. New York: McGraw-Hill.
Boyd, W. K. (2013). Cost Accounting For Dummies. Hoboken: Wiley.
Holtzman, M. (2013). Managerial Accounting For Dummies. Hoboken, NJ: Wiley.
6
chevron_up_icon
1 out of 6
circle_padding
hide_on_mobile
zoom_out_icon
[object Object]