Comprehensive Analysis of Singapore's Economic Performance
VerifiedAdded on 2022/10/12
|12
|3047
|157
Report
AI Summary
This report provides a comprehensive analysis of the Singaporean economy, examining key economic indicators such as GDP, GDP growth rate, and GDP per capita to assess production and output performance. It delves into the labor market, analyzing types of unemployment and trends, alongside government measures to address unemployment. Furthermore, the report explores price level analysis, including inflation trends, causes of inflation, and governmental policies to manage inflation. The study highlights Singapore's business-friendly environment, its reliance on innovation and entrepreneurship, and the impact of government policies like housing subsidies and tax reductions. The analysis also covers the impact of the global financial crisis, and the recent trade war between the USA and China. Overall, the report offers insights into the economic strengths and challenges facing Singapore, providing a detailed overview of the country's economic landscape and its performance in recent years.
1
ECONOMICS ASSIGNMENT
ECONOMICS ASSIGNMENT
Paraphrase This Document
Need a fresh take? Get an instant paraphrase of this document with our AI Paraphraser
2
Contents
1.0 Introduction..........................................................................................................................3
2.0 Production and output performance analysis.......................................................................3
2.1 GDP......................................................................................................................................3
2.2 GDP growth rate..................................................................................................................3
2.3 GDP per capita.....................................................................................................................4
2.4 Government measure- GDP.................................................................................................5
3.0 Labour market analysis........................................................................................................6
3.1 Types of unemployment.......................................................................................................6
3.2 Unemployment trend............................................................................................................6
3.3 Government measures- Unemployment...............................................................................7
4.0 Price level analysis...............................................................................................................8
4.1 Inflation trend.......................................................................................................................8
4.2 Causes of inflation................................................................................................................9
4.3 Government measures inflation...........................................................................................9
5.0 Conclusion..........................................................................................................................10
Reference..................................................................................................................................11
3
1.0 Introduction
The Singaporean economy is one of the most business-friendly economies of the world. The
economy is a free market economy with a low tax rate that is favourable for the business
operation. The economy is the 3rd least corrupt economies of the world and the per capita
GDP performance of the economy is impressive. The economy focuses mainly on business
innovations and entrepreneurship that have the potential to further contribute to the economic
prosperity of the country. The study aims to examine the strength of the economy based on
the values of different economic indicators.
2.0 Production and output performance analysis
2.1 GDP
GDP is the total gross value of all the goods and services produced within the boundary of
the economy for a certain period. GDP is one of the most widely used economic indicators
that measure the strength of an economy. To avoid the double calculation problems, the
calculations of GDP only include the gross value of the final products of the economy (Low,
Roberts & Whiting, 2015). The raw value of all goods and services produced in the economy
is known as the nominal GDP of an economy, whereas, the inflation-adjusted GDP is known
as the real GDP of the economy. The current GDP of Singapore is 372.8 billion USD.
2.2 GDP growth rate
The growth rate of GDP is referred to as the percentage changes in GDP from one point to
another. GDP growth rate helps in understanding the progress of the economy towards a
national goal.
⊘ This is a preview!⊘
Do you want full access?
Subscribe today to unlock all pages.
Trusted by 1+ million students worldwide
4
2005 2006 2007 2008 2009 2010 2011 2012 2013 2014
0
2
4
6
8
10
12
14
16
GDP growth rate
GDP growth rate
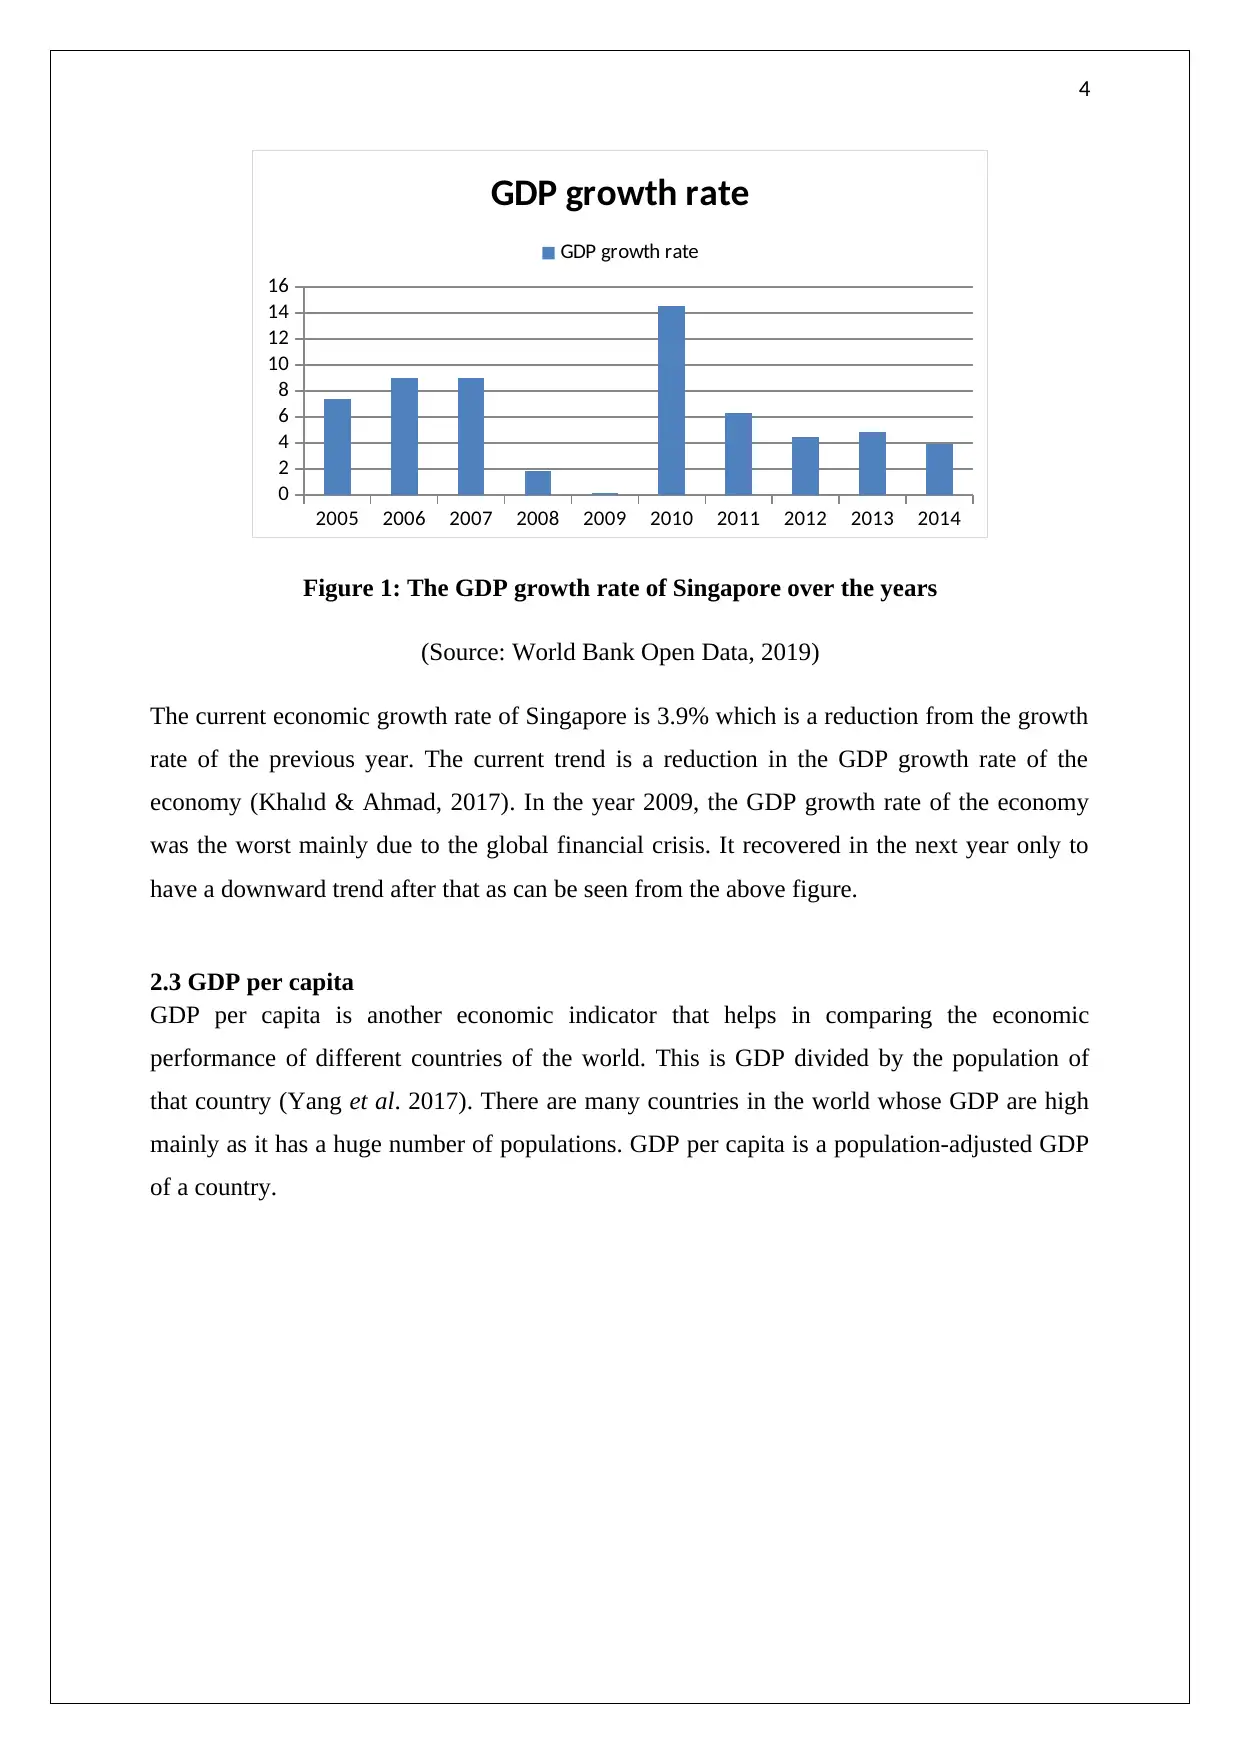
Figure 1: The GDP growth rate of Singapore over the years
(Source: World Bank Open Data, 2019)
The current economic growth rate of Singapore is 3.9% which is a reduction from the growth
rate of the previous year. The current trend is a reduction in the GDP growth rate of the
economy (Khalıd & Ahmad, 2017). In the year 2009, the GDP growth rate of the economy
was the worst mainly due to the global financial crisis. It recovered in the next year only to
have a downward trend after that as can be seen from the above figure.
2.3 GDP per capita
GDP per capita is another economic indicator that helps in comparing the economic
performance of different countries of the world. This is GDP divided by the population of
that country (Yang et al. 2017). There are many countries in the world whose GDP are high
mainly as it has a huge number of populations. GDP per capita is a population-adjusted GDP
of a country.
2005 2006 2007 2008 2009 2010 2011 2012 2013 2014
0
2
4
6
8
10
12
14
16
GDP growth rate
GDP growth rate
Figure 1: The GDP growth rate of Singapore over the years
(Source: World Bank Open Data, 2019)
The current economic growth rate of Singapore is 3.9% which is a reduction from the growth
rate of the previous year. The current trend is a reduction in the GDP growth rate of the
economy (Khalıd & Ahmad, 2017). In the year 2009, the GDP growth rate of the economy
was the worst mainly due to the global financial crisis. It recovered in the next year only to
have a downward trend after that as can be seen from the above figure.
2.3 GDP per capita
GDP per capita is another economic indicator that helps in comparing the economic
performance of different countries of the world. This is GDP divided by the population of
that country (Yang et al. 2017). There are many countries in the world whose GDP are high
mainly as it has a huge number of populations. GDP per capita is a population-adjusted GDP
of a country.
Paraphrase This Document
Need a fresh take? Get an instant paraphrase of this document with our AI Paraphraser
5
2005 2006 2007 2008 2009 2010 2011 2012 2013 2014
0
10000
20000
30000
40000
50000
60000
70000
80000
GDP per capita for Singapore GDP per capita for Australia
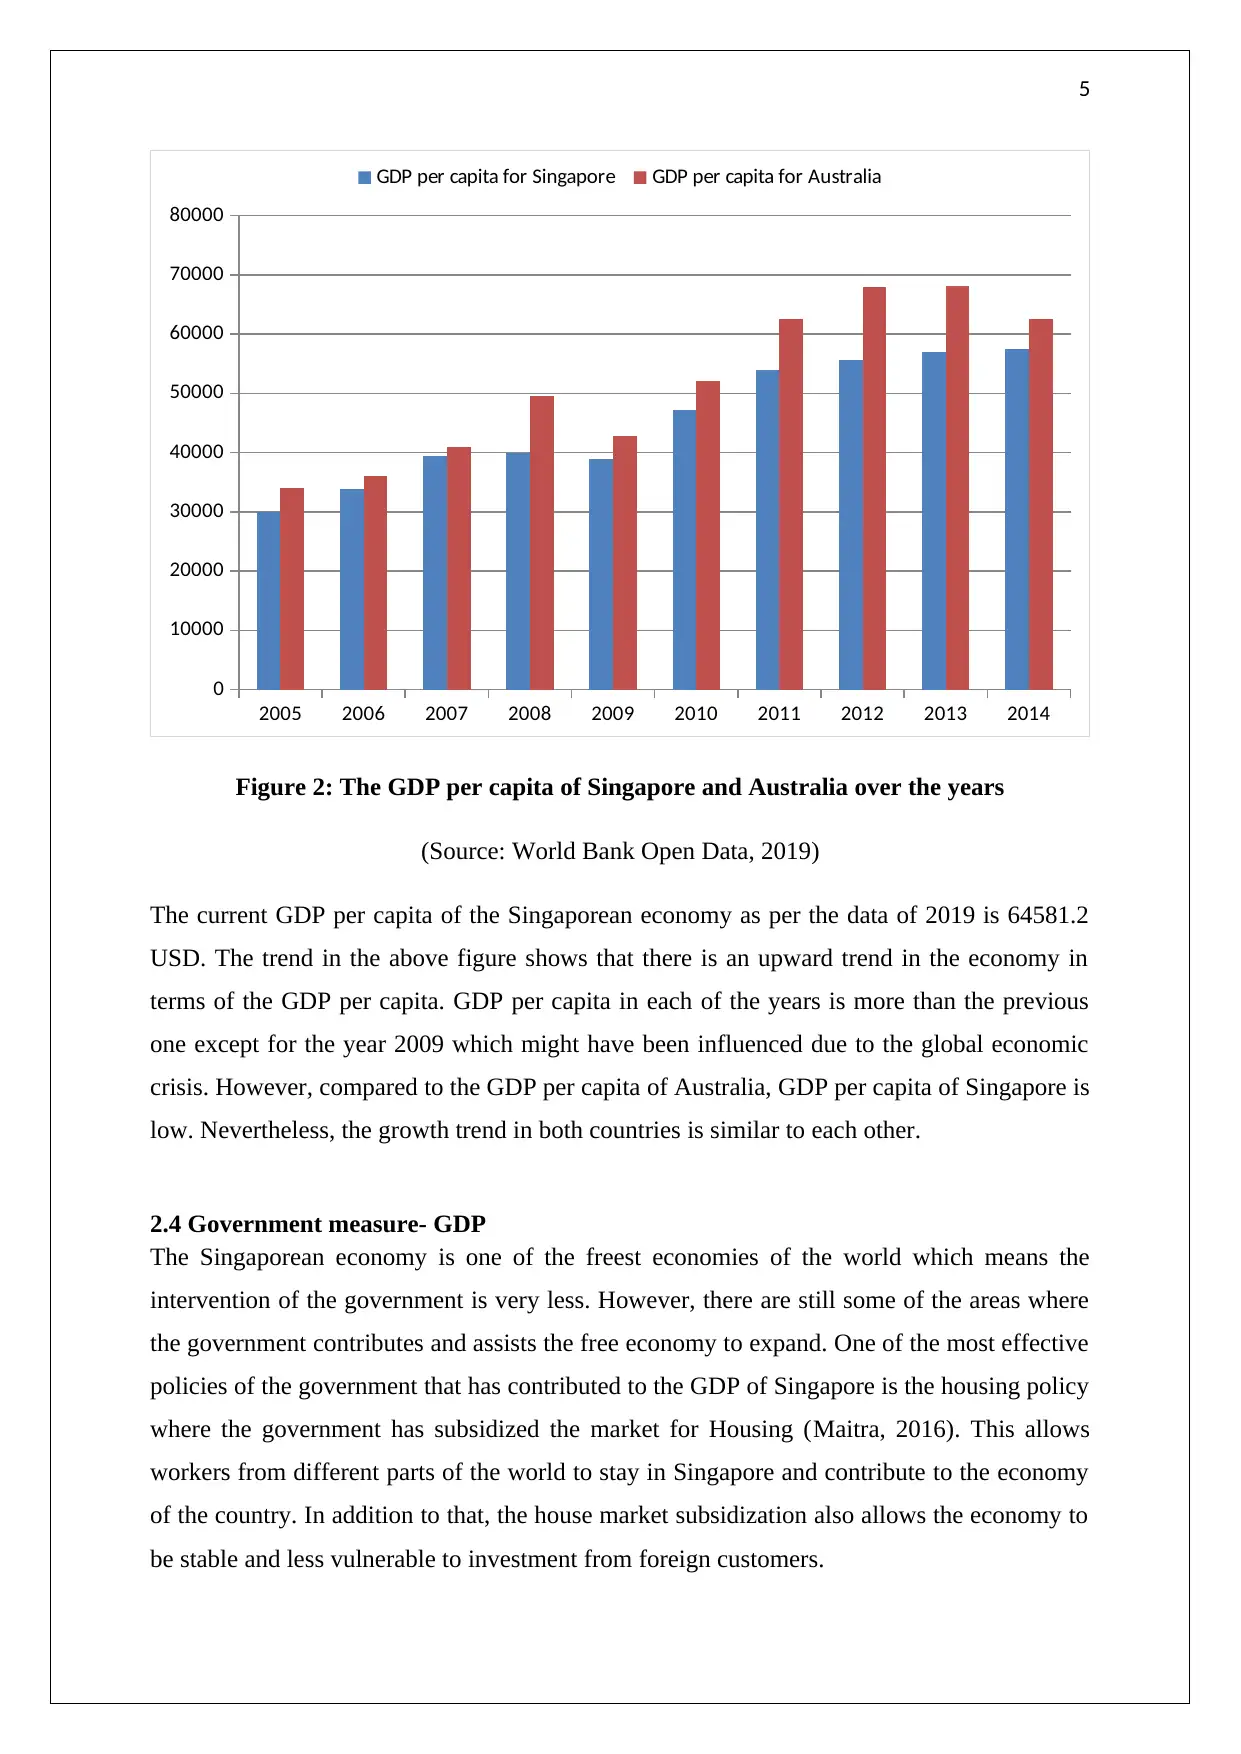
Figure 2: The GDP per capita of Singapore and Australia over the years
(Source: World Bank Open Data, 2019)
The current GDP per capita of the Singaporean economy as per the data of 2019 is 64581.2
USD. The trend in the above figure shows that there is an upward trend in the economy in
terms of the GDP per capita. GDP per capita in each of the years is more than the previous
one except for the year 2009 which might have been influenced due to the global economic
crisis. However, compared to the GDP per capita of Australia, GDP per capita of Singapore is
low. Nevertheless, the growth trend in both countries is similar to each other.
2.4 Government measure- GDP
The Singaporean economy is one of the freest economies of the world which means the
intervention of the government is very less. However, there are still some of the areas where
the government contributes and assists the free economy to expand. One of the most effective
policies of the government that has contributed to the GDP of Singapore is the housing policy
where the government has subsidized the market for Housing (Maitra, 2016). This allows
workers from different parts of the world to stay in Singapore and contribute to the economy
of the country. In addition to that, the house market subsidization also allows the economy to
be stable and less vulnerable to investment from foreign customers.
2005 2006 2007 2008 2009 2010 2011 2012 2013 2014
0
10000
20000
30000
40000
50000
60000
70000
80000
GDP per capita for Singapore GDP per capita for Australia
Figure 2: The GDP per capita of Singapore and Australia over the years
(Source: World Bank Open Data, 2019)
The current GDP per capita of the Singaporean economy as per the data of 2019 is 64581.2
USD. The trend in the above figure shows that there is an upward trend in the economy in
terms of the GDP per capita. GDP per capita in each of the years is more than the previous
one except for the year 2009 which might have been influenced due to the global economic
crisis. However, compared to the GDP per capita of Australia, GDP per capita of Singapore is
low. Nevertheless, the growth trend in both countries is similar to each other.
2.4 Government measure- GDP
The Singaporean economy is one of the freest economies of the world which means the
intervention of the government is very less. However, there are still some of the areas where
the government contributes and assists the free economy to expand. One of the most effective
policies of the government that has contributed to the GDP of Singapore is the housing policy
where the government has subsidized the market for Housing (Maitra, 2016). This allows
workers from different parts of the world to stay in Singapore and contribute to the economy
of the country. In addition to that, the house market subsidization also allows the economy to
be stable and less vulnerable to investment from foreign customers.
6
Apart from that, policies of the government to reduce the tax rate of the business have also
contributed to the higher growth rate of the country in the past years. The Singaporean
economy is one of the largest economies of the world where the corporate tax is very low.
Therefore, more and more foreign and domestic businesses start operating in Singapore
providing a huge number of jobs and generating output for the economy. The government
also necessitates a certain level of reinvestment in the country that eventually helps in the
GDP of the country.
3.0 Labour market analysis
3.1 Types of unemployment
The Singaporean economy in general experiences three types of unemployment. These are
frictional, cyclical and structural. It needs to be noted that structural unemployment was not
present in this economy due to higher rate of capital investment into the economy. However,
since the financial crisis of 2007, the investment inflow from foreign sources has reduced
slightly leading to growth in structural unemployment (Chen & Shao, 2017). Other than that,
the economy of Singapore is also influenced by the changes in the business cycle like most of
the other economies of the world. In the recessionary phase where the aggregate demand for
the goods and service is low, firms lay off some of the employees leading to an increase in
the cyclical unemployment rate. However, this does not bother the government or the
economy as a whole as during the time of expanding the economy of Singapore provides
employment more than its potential level due to the huge increase in aggregate demand for
goods and services. Lastly, frictional unemployment is a regular type of unemployment in
Singapore which is independent of the performance of the economy (Tang & Tan, 2015).
Frictional unemployment occurs when the individuals remain unemployed for searching for
new jobs in the market.
3.2 Unemployment trend
As per the recent data of 2019, the unemployment rate is 2.2% which is a huge reduction
since 2005. The figure below shows the trend in the unemployment rate of the Singaporean
economy from 2005 to 2014 (Watanabe, Naveed & Neittaanmäki, 2015). There is a
downward trend in the unemployment rate since 2005 except for the case in 2009 where the
unemployment rate was high due to higher layoff corresponding to the global financial crisis
of 2007.
⊘ This is a preview!⊘
Do you want full access?
Subscribe today to unlock all pages.
Trusted by 1+ million students worldwide
7
2005 2006 2007 2008 2009 2010 2011 2012 2013 2014
0
0.5
1
1.5
2
2.5
3
3.5
Unemployment rate
Unemployment rate
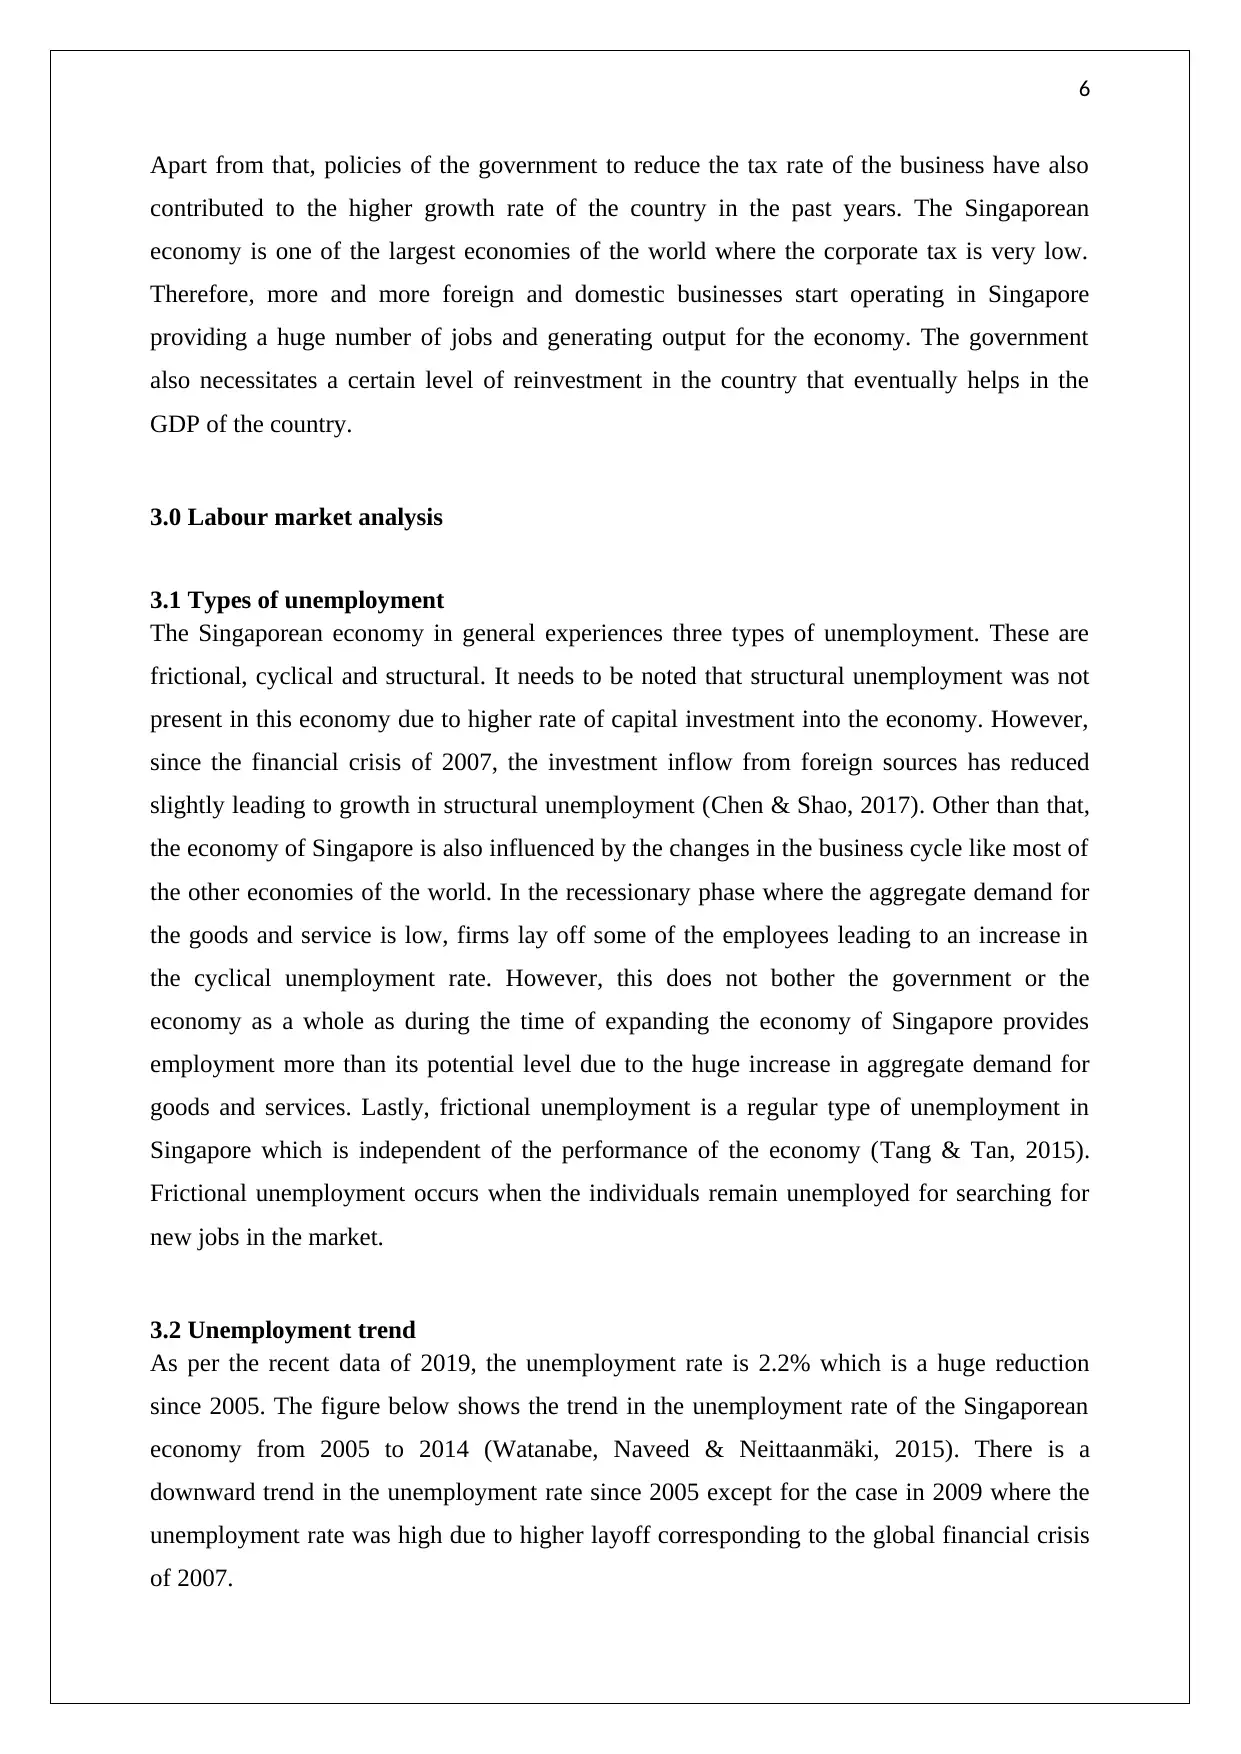
Figure 3: The trend in the unemployment rate of Singapore
(Source: World Bank Open Data, 2019)
It needs to be noted that the Singaporean economy creates around 40000 jobs annually on an
average. Thus, the economy of Singapore has been performing better compared to the
performance in the last few years. Welsh & Chang (2019) stated that the manufacturing
sector creates around 67% of all the new jobs in the economy. Other than that, the service
sector of the economy has also started creating a lot of jobs in the economy since 2009.
Therefore, these sectors have been pivotal in reducing the unemployment rate in Singapore in
the last few years.
3.3 Government measures- Unemployment
The government of Singapore has taken several measures to make sure the economy operates
in full employment level for most of the time. The first policy is to invest in quality job
creation which will increase the incentive of the workers in the firm. The government also
provides subsidies to the firms for providing safe and quality jobs for the employees of the
market (Selvaraj, 2015). Apart from that, the government have also come up with a policy
that reduces the bureaucracy or red-tapism in the process of business so that cost of operation
of the firm increases and they respond more to increased opportunities in the economy such
as the boom phase of the business cycle. The central bank of Singapore has also undertaken
measures to keep interest rates at a higher level to achieve full employment in the economy.
Lu et al. (2019) noted that this policy of the government is very effective as it not only
2005 2006 2007 2008 2009 2010 2011 2012 2013 2014
0
0.5
1
1.5
2
2.5
3
3.5
Unemployment rate
Unemployment rate
Figure 3: The trend in the unemployment rate of Singapore
(Source: World Bank Open Data, 2019)
It needs to be noted that the Singaporean economy creates around 40000 jobs annually on an
average. Thus, the economy of Singapore has been performing better compared to the
performance in the last few years. Welsh & Chang (2019) stated that the manufacturing
sector creates around 67% of all the new jobs in the economy. Other than that, the service
sector of the economy has also started creating a lot of jobs in the economy since 2009.
Therefore, these sectors have been pivotal in reducing the unemployment rate in Singapore in
the last few years.
3.3 Government measures- Unemployment
The government of Singapore has taken several measures to make sure the economy operates
in full employment level for most of the time. The first policy is to invest in quality job
creation which will increase the incentive of the workers in the firm. The government also
provides subsidies to the firms for providing safe and quality jobs for the employees of the
market (Selvaraj, 2015). Apart from that, the government have also come up with a policy
that reduces the bureaucracy or red-tapism in the process of business so that cost of operation
of the firm increases and they respond more to increased opportunities in the economy such
as the boom phase of the business cycle. The central bank of Singapore has also undertaken
measures to keep interest rates at a higher level to achieve full employment in the economy.
Lu et al. (2019) noted that this policy of the government is very effective as it not only
Paraphrase This Document
Need a fresh take? Get an instant paraphrase of this document with our AI Paraphraser
8
confirms full employment of the resources but also increases the capital inflow into the
economy that further ensures expansion. Lastly, public investment and infrastructure from
the side of the government have enabled the economy to use all the resources available to the
economy for meeting the demand of the customers of the market.
4.0 Price level analysis
4.1 Inflation trend
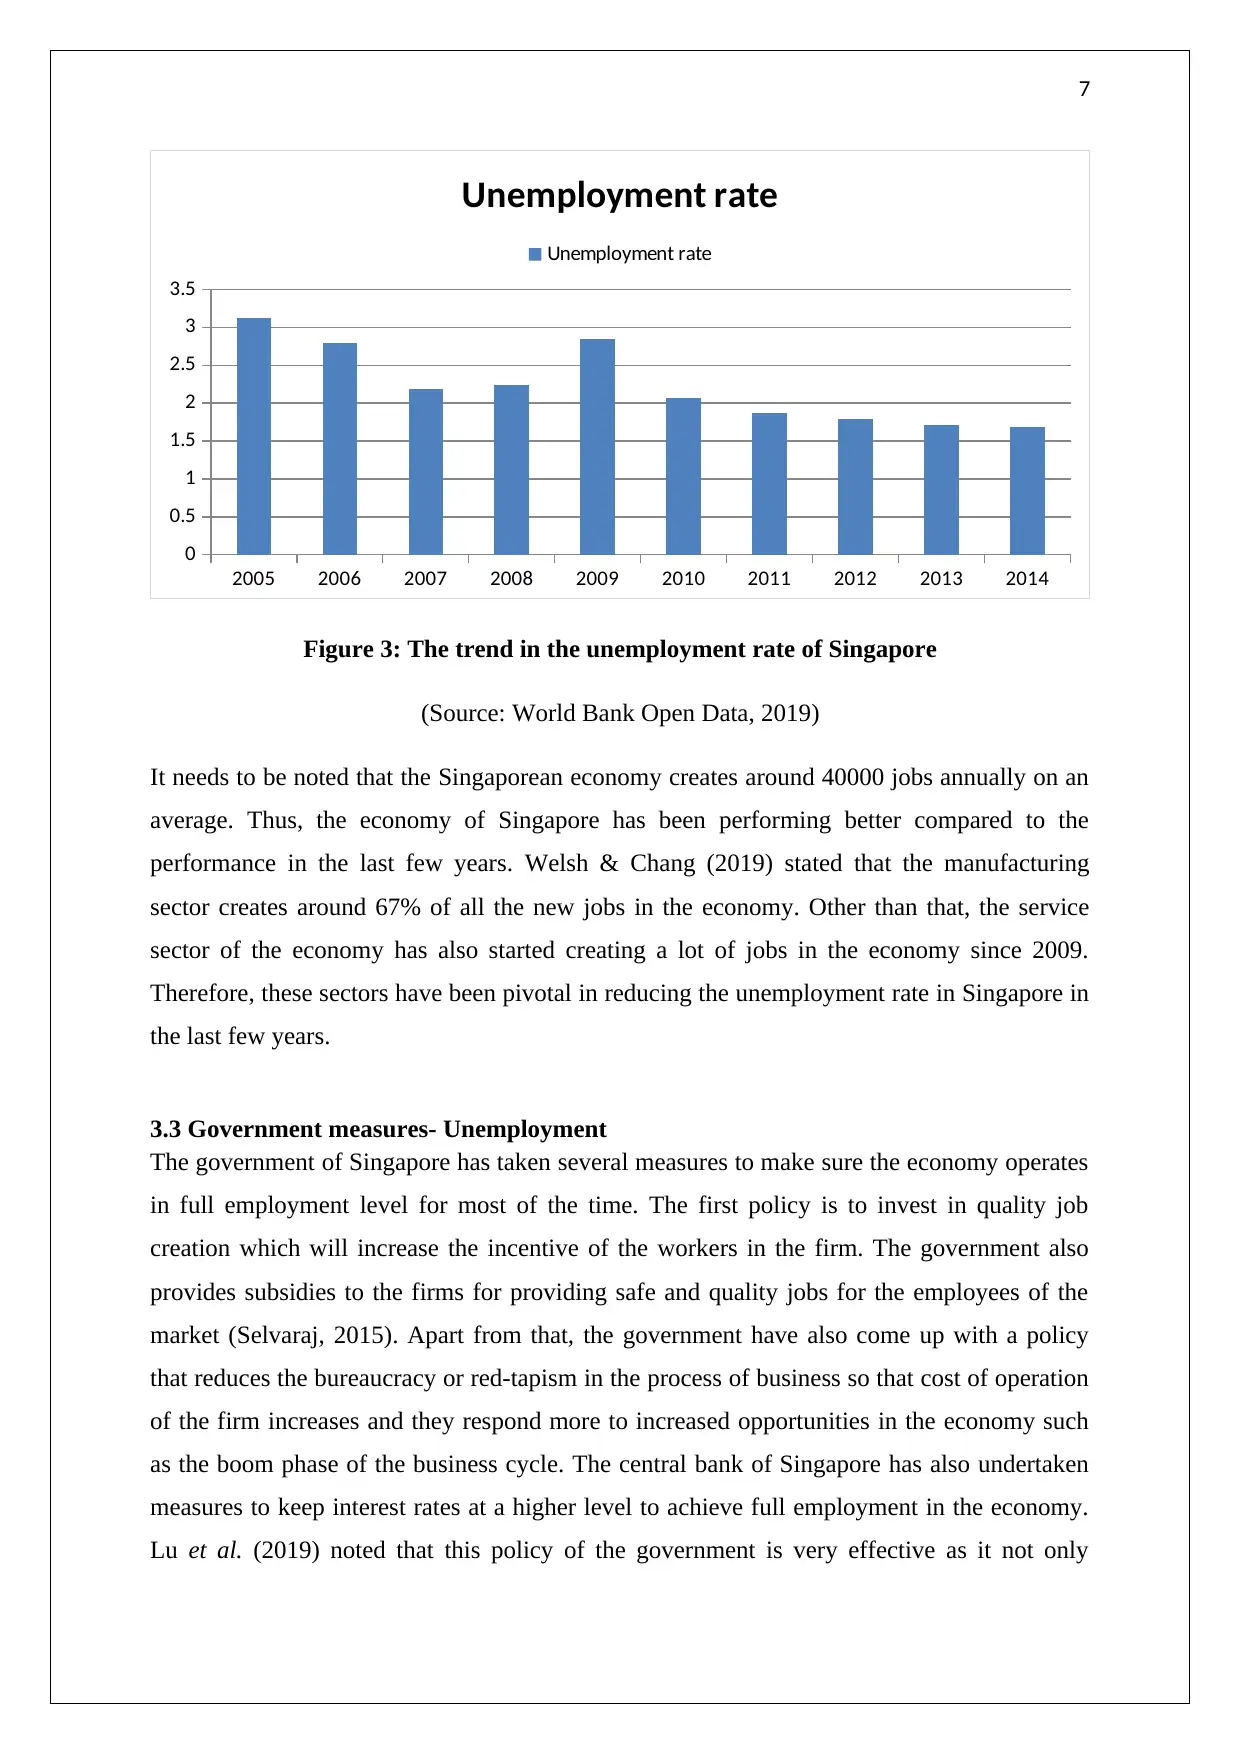
The inflation rate of Singapore as per the year of 2019 is 1.9% which is almost the same
compared to the last few years. There is no specific trend in the inflation rate if we see from
2005 to 2014 since the economy was hurt badly during the global recession. It can be seen
from the figure that in the year 2009, the inflation rate is 0.59% which is very low (Bhasin &
Ng, 2016). This low inflation is a sign of recession hitting the economy.
2005 2006 2007 2008 2009 2010 2011 2012 2013 2014
0
1
2
3
4
5
6
7
inflation rate
inflation rate
Figure 4: The inflation trend in the Singaporean economy
(Source: World Bank Open Data, 2019)
Inflation in the economy is increasing again after the year 2010. This can be a sign of
recovery of the economy from the shock that it experienced during the financial crisis of
2007. However, the inflation is again decreasing in the economy putting across a sign of
recession in the economy (Nagarajan, Teixeira & Silva, 2017). This time the trade war
between the USA and China can be the reason for the downturn in the economy. The GDP
growth rate of the economy is also scaring the government and the firms in the market. Apart
confirms full employment of the resources but also increases the capital inflow into the
economy that further ensures expansion. Lastly, public investment and infrastructure from
the side of the government have enabled the economy to use all the resources available to the
economy for meeting the demand of the customers of the market.
4.0 Price level analysis
4.1 Inflation trend
The inflation rate of Singapore as per the year of 2019 is 1.9% which is almost the same
compared to the last few years. There is no specific trend in the inflation rate if we see from
2005 to 2014 since the economy was hurt badly during the global recession. It can be seen
from the figure that in the year 2009, the inflation rate is 0.59% which is very low (Bhasin &
Ng, 2016). This low inflation is a sign of recession hitting the economy.
2005 2006 2007 2008 2009 2010 2011 2012 2013 2014
0
1
2
3
4
5
6
7
inflation rate
inflation rate
Figure 4: The inflation trend in the Singaporean economy
(Source: World Bank Open Data, 2019)
Inflation in the economy is increasing again after the year 2010. This can be a sign of
recovery of the economy from the shock that it experienced during the financial crisis of
2007. However, the inflation is again decreasing in the economy putting across a sign of
recession in the economy (Nagarajan, Teixeira & Silva, 2017). This time the trade war
between the USA and China can be the reason for the downturn in the economy. The GDP
growth rate of the economy is also scaring the government and the firms in the market. Apart
9
from that, one of the government policies to increase interest rates has also influenced the
inflation rate in the economy as well. Due to an increase in the interest rate, the money supply
has reduced leading to a dip in the price level in the last few years.
4.2 Causes of inflation
One of the main causes of inflation is the increase in the money supply. The same has been in
the case of Singapore when the government increased the money supply in the year 2008
(Yuki & Cen, 2018). Again the reduction in the money supply to maintain a full employment
rate has caused a reduction in the price level in the aggregate market. The current low levels
of inflation can also be explained by low foreign debt of the Singaporean economy as well.
The government do not use any kinds of monetary tools to raise revenue for the spending and
hence the inflation is low in the economy (Benigno, Converse & Fornaro, 2015). The factor
of cost-push inflation has also worked in this case as well. The cost of operation of the
businesses has reduced following the cut in the corporate taxes. These have shifted the
aggregate supply curve to the left side leading to a reduction both in the price and the output
as can be seen from the data analyses. In addition to that, the appreciation of the Singaporean
currency is also the reason for reducing inflation in the economy. The customers of the
market are now using Singaporean dollar for buying from the global market leading to
deflation in the Singaporean economy.
4.3 Government measures inflation
The price level in the economy of Singapore is not at all stable as can be seen from the price
analysis of the market. Therefore, the government has undertaken several measures to ensure
a stable price in the economy. The central bank of Singapore has used open market operations
to maintain a stable price level in the economy (Caprotti, Springer & Harmer, 2015). In the
last few years, the government has used this tool several times so that inflation does not affect
the performance of the overall economy and put the economy into a path of recession. Apart
from that, the government has also taken measures to regulate the interest rates every quarter
so that it can adjust as per the output of each quarter of the economy. This enables the central
bank to be flexible with the interest rates in the short run so that the price can be made more
stable.
⊘ This is a preview!⊘
Do you want full access?
Subscribe today to unlock all pages.
Trusted by 1+ million students worldwide
10
5.0 Conclusion
Therefore, the Singaporean economy is one of the most open economies of the world with an
impressive performance in the last few years. Due to the absence of intervention from the
side of the government, the economy is beneficial for businesses around the world. Although
the GDP growth rate of the economy is not up to the mark the economy is doing great in
terms of GDP per capita. The economy has also been able to reduce the unemployment rate
in recent years as well owing to the high flow of investment from the foreign financial
markets. Lastly, the overall conditions of the economy of Singapore are not as great as it was
before 2006 as the price level in the economy is not stable for a long time now. The
government is undertaking policies that are expected to provide dividend in the coming years.
Paraphrase This Document
Need a fresh take? Get an instant paraphrase of this document with our AI Paraphraser
11
Reference
Benigno, G., Converse, N., & Fornaro, L. (2015). Large capital inflows, sectoral allocation,
and economic performance. Journal of International Money and Finance, 55, 60-87.
Bhasin, B., & Ng, L. K. (2016). Transforming Culture to Stimulate Economic Development:
Lessons from Singapore. International Journal of Art, Culture and Design
Technologies (IJACDT), 5(1), 48-58.
Caprotti, F., Springer, C., & Harmer, N. (2015). ‘Eco’For Whom? Envisioning Eco‐urbanism
in the Sino‐Singapore Tianjin Eco‐city, China. International Journal of Urban and
Regional Research, 39(3), 495-517.
Chen, X., & Shao, Y. (2017). Trade policies for a small open economy: The case of
Singapore. The World Economy, 40(11), 2500-2511.
Khalıd, M. A., & Ahmad, H. K. (2017). Dynamic Estimation of the Relationship Between
Trade Openness and Economic Growth in Singapore.
Low, D. C., Roberts, H., & Whiting, R. H. (2015). Board gender diversity and firm
performance: Empirical evidence from Hong Kong, South Korea, Malaysia and
Singapore. Pacific-Basin Finance Journal, 35, 381-401.
Lu, Y., Chang, R., Shabunko, V., & Yee, A. T. L. (2019). The implementation of building-
integrated photovoltaics in Singapore: drivers versus barriers. Energy, 168, 400-408.
Maitra, B. (2016). Investment in human capital and economic growth in Singapore. Global
Business Review, 17(2), 425-437.
Nagarajan, R., Teixeira, A. A., & Silva, S. (2017). The impact of population ageing on
economic growth: a bibliometric survey. The Singapore Economic Review, 62(02),
275-296.
Selvaraj, P. C. (2015). The effects of work force diversity on employee performance in
Singapore organisations. International Journal of Business Administration, 6(2), 17.
Tang, C. F., & Tan, E. C. (2015). Does tourism effectively stimulate Malaysia's economic
growth?. Tourism management, 46, 158-163.
12
Watanabe, C., Naveed, K., & Neittaanmäki, P. (2015). Dependency on un-captured GDP as a
source of resilience beyond economic value in countries with advanced ICT
infrastructure: Similarities and disparities between Finland and
Singapore. Technology in Society, 42, 104-122.
Welsh, B., & Chang, A. H. (2019). PAP Vulnerability and the Singapore Governance Model:
Findings from the Asian Barometer Survey. In The Limits of Authoritarian
Governance in Singapore's Developmental State (pp. 195-216). Palgrave Macmillan,
Singapore.
World Bank Open Data | Data. (2019). Retrieved 27 September 2019, from
https://data.worldbank.org/
Yang, Y., Goh, K., Wang, R., & Bae, T. H. (2017). High-performance nanocomposite
membranes realized by efficient molecular sieving with CuBDC
nanosheets. Chemical Communications, 53(30), 4254-4257.
Yuki, K., & Cen, Z. (2018). Effects of the Size of a Country on Its Economic Performance.
In Emerging Risks in a World of Heterogeneity (pp. 19-44). Springer, Singapore.
⊘ This is a preview!⊘
Do you want full access?
Subscribe today to unlock all pages.
Trusted by 1+ million students worldwide
1 out of 12
Related Documents


Your All-in-One AI-Powered Toolkit for Academic Success.
+13062052269
info@desklib.com
Available 24*7 on WhatsApp / Email
![[object Object]](/_next/static/media/star-bottom.7253800d.svg)
Unlock your academic potential
Copyright © 2020–2026 A2Z Services. All Rights Reserved. Developed and managed by ZUCOL.