ECO12 Macroeconomics Assignment: Analysis of Economic Policies, 2019

Verified

Added on  2022/10/19

|9
|1645
|299
Report
AI Summary
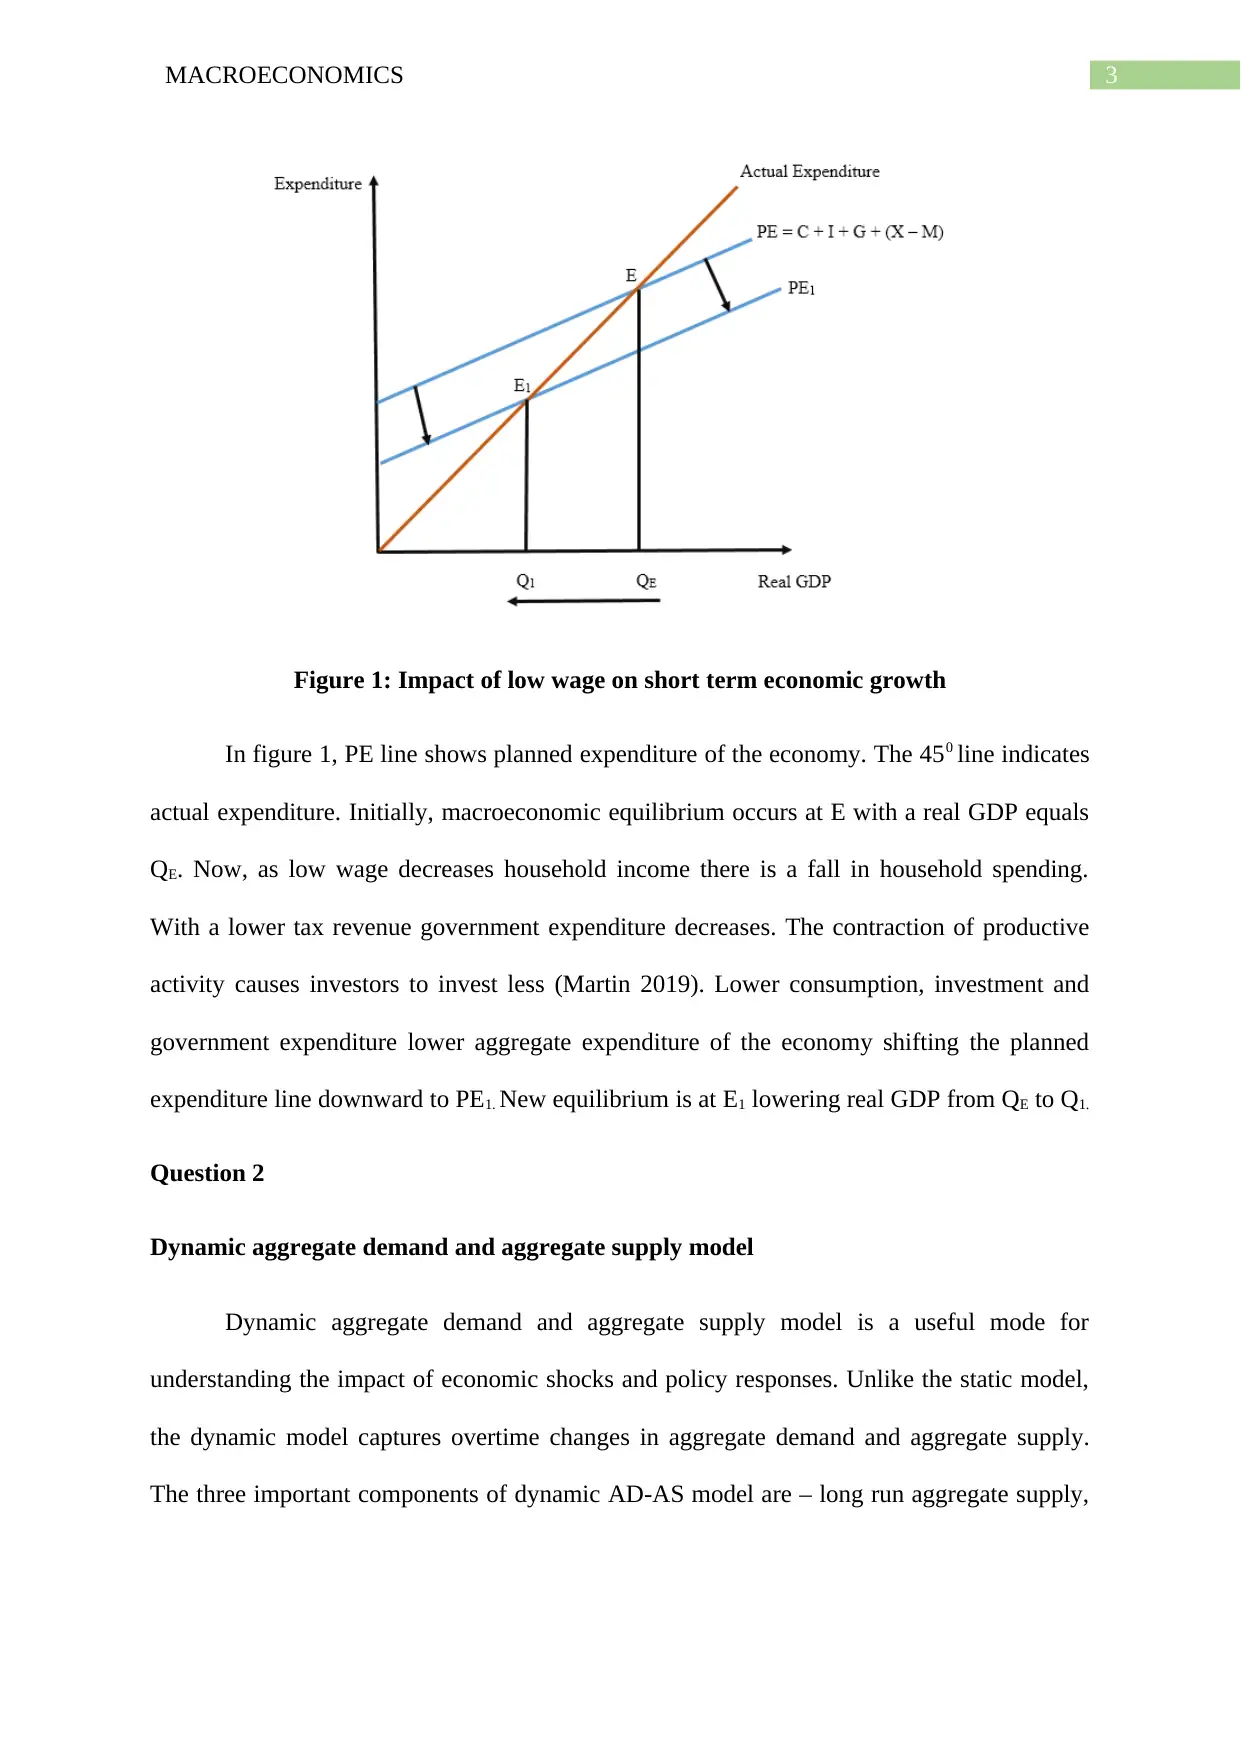
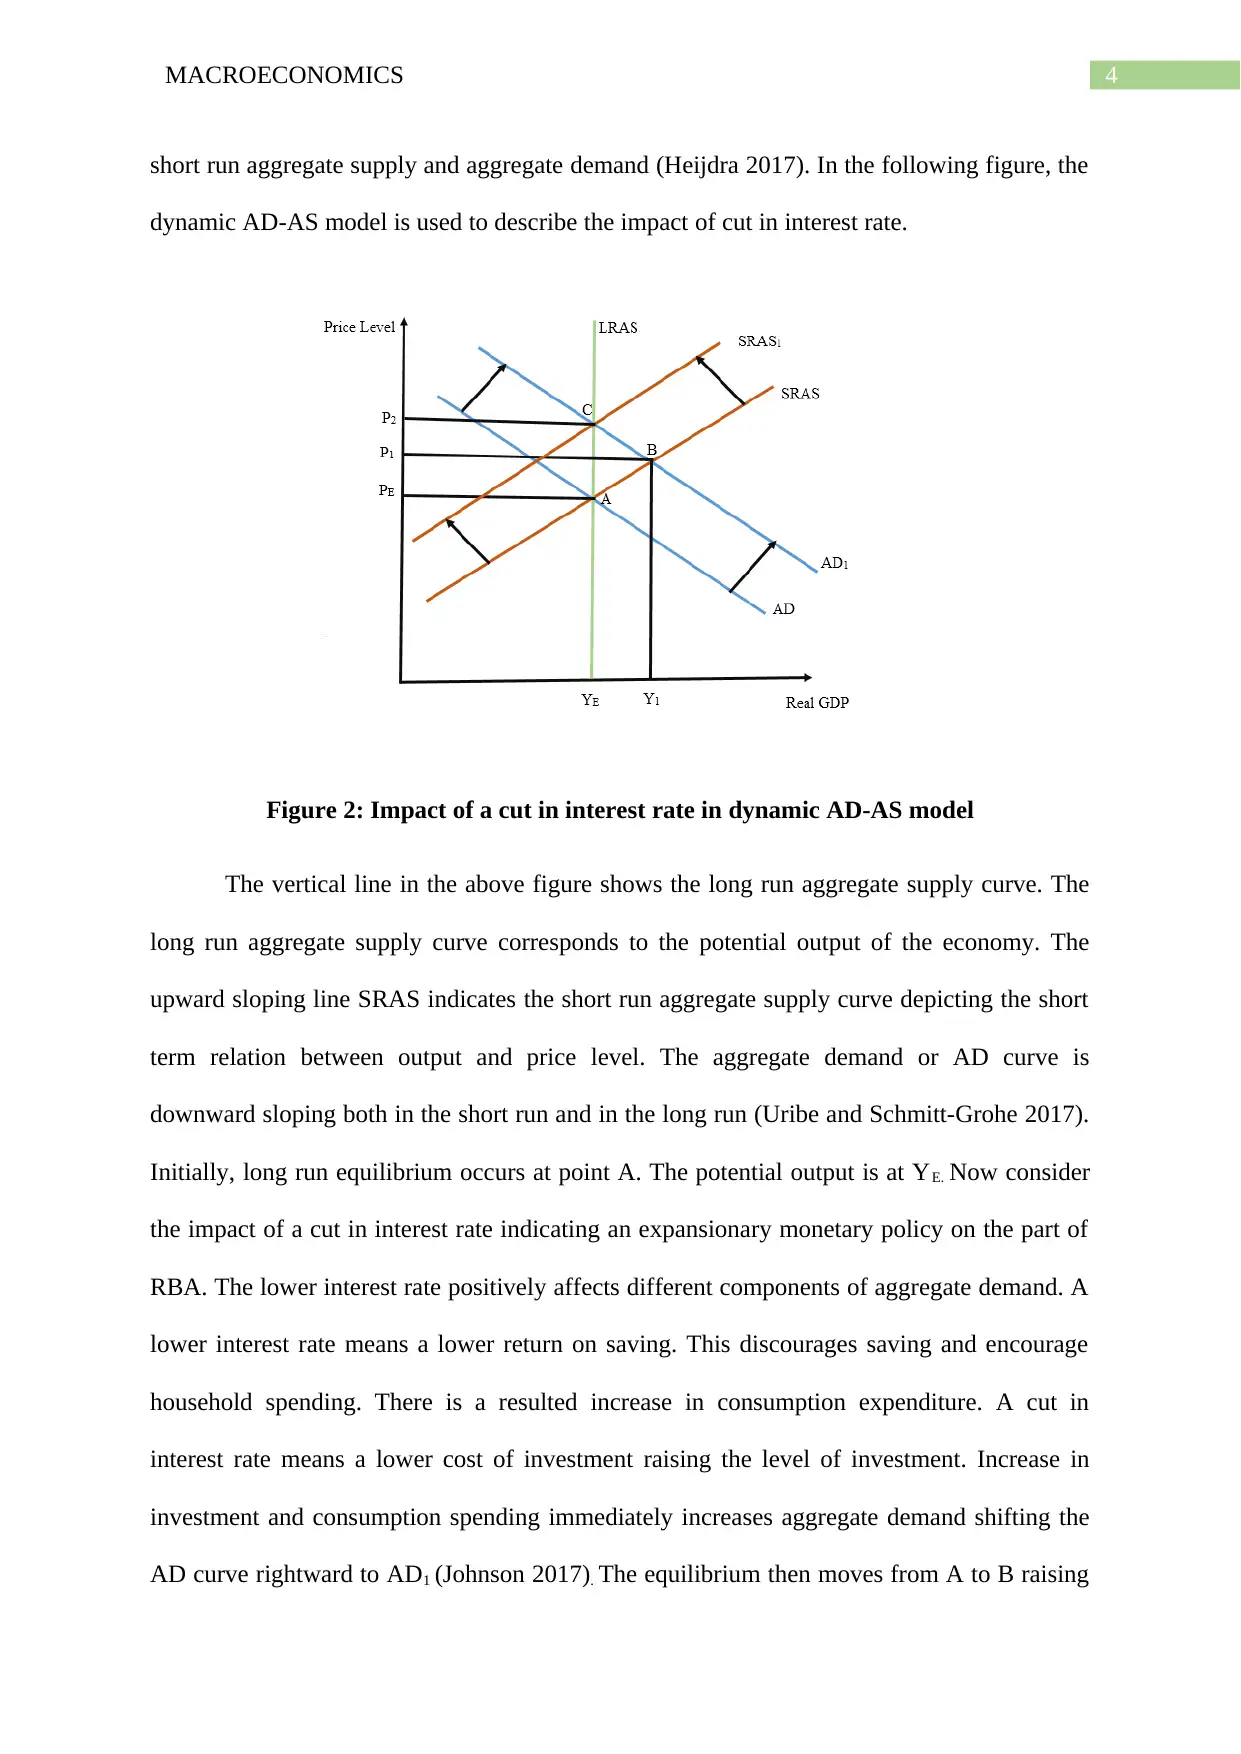
This report provides a detailed analysis of macroeconomic principles and their application to the Australian economy. It begins by examining the relationship between weak wage growth and short-term economic growth, using the aggregate expenditure model to illustrate the impact of wage changes on consumption, investment, and government expenditure. The report then explores the dynamic aggregate demand and aggregate supply (AD-AS) model, demonstrating the effects of a cut in interest rates on price levels and output. Finally, it delves into the unemployment rate in Australia, discussing the natural rate of unemployment and the impact of government measures to stimulate aggregate demand, considering the implications of misunderstanding the non-accelerating inflation rate of unemployment (NAIRU). The report incorporates relevant figures and references to support its arguments, providing a comprehensive overview of key macroeconomic concepts within the context of the assignment brief.
Document Page
Running head: MACROECONOMICS
Macroeconomics
Name of the Student
Name of the University
Course ID
tabler-icon-diamond-filled.svg

Paraphrase This Document

Need a fresh take? Get an instant paraphrase of this document with our AI Paraphraser
Document Page
1MACROECONOMICS
Table of Contents
Question 1..................................................................................................................................2
Link between weak wage growth and weak short term economic growth............................2
Question 2..................................................................................................................................3
Dynamic aggregate demand and aggregate supply model.....................................................3
Question 3..................................................................................................................................5
Question a...............................................................................................................................5
Question b..............................................................................................................................6
References..................................................................................................................................8
Document Page
2MACROECONOMICS
Question 1
Link between weak wage growth and weak short term economic growth
Wages are the monetary reward that workers receive for giving their labor. Wage is
the main source of income for most households in the economy and therefore, determines
level of income and expenditures of households. Growth in wages indicates rate of change in
wages overtime. Wage growth is considered as one of the important indicators in determining
economic growth both in the short run and long run. A low wage implies deflationary
situation in the economy pushing economic growth backward (Goodwin et al. 2015). Because
of a low wage, there is a decline in household income resulting in a decline in expenditure.
Low wage by lowering tax revenue reduces government ability to spend. Lower expenditure
because of lower household income reduces productive activities and investment. All these
result in a lower economic growth in the short run. This can be understood by using the
aggregate expenditure model.
The aggregate expenditure model connects different aggregate expenditure
components to the prevailing economic activity. For short run, the model takes price level as
fixed and determine economic activities in the nation. Equilibrium in the model is determined
where actual expenditure equals planned expenditure (Agenor and Montiel 2015). Now
planned expenditure has four different components such as consumption, investment,
government expenditure and net export.
GDP=Planned Expenditure
¿ Consumption+Investment +Government expenditure+Net export
Lower wage by adversely affecting most of the component of planned expenditure weakens
short term economic growth. This is explained in the figure below.
Document Page
3MACROECONOMICS
Figure 1: Impact of low wage on short term economic growth
In figure 1, PE line shows planned expenditure of the economy. The 450 line indicates
actual expenditure. Initially, macroeconomic equilibrium occurs at E with a real GDP equals
QE. Now, as low wage decreases household income there is a fall in household spending.
With a lower tax revenue government expenditure decreases. The contraction of productive
activity causes investors to invest less (Martin 2019). Lower consumption, investment and
government expenditure lower aggregate expenditure of the economy shifting the planned
expenditure line downward to PE1. New equilibrium is at E1 lowering real GDP from QE to Q1.
Question 2
Dynamic aggregate demand and aggregate supply model
Dynamic aggregate demand and aggregate supply model is a useful mode for
understanding the impact of economic shocks and policy responses. Unlike the static model,
the dynamic model captures overtime changes in aggregate demand and aggregate supply.
The three important components of dynamic AD-AS model are – long run aggregate supply,
tabler-icon-diamond-filled.svg

Paraphrase This Document

Need a fresh take? Get an instant paraphrase of this document with our AI Paraphraser
Document Page
4MACROECONOMICS
short run aggregate supply and aggregate demand (Heijdra 2017). In the following figure, the
dynamic AD-AS model is used to describe the impact of cut in interest rate.
Figure 2: Impact of a cut in interest rate in dynamic AD-AS model
The vertical line in the above figure shows the long run aggregate supply curve. The
long run aggregate supply curve corresponds to the potential output of the economy. The
upward sloping line SRAS indicates the short run aggregate supply curve depicting the short
term relation between output and price level. The aggregate demand or AD curve is
downward sloping both in the short run and in the long run (Uribe and Schmitt-Grohe 2017).
Initially, long run equilibrium occurs at point A. The potential output is at YE. Now consider
the impact of a cut in interest rate indicating an expansionary monetary policy on the part of
RBA. The lower interest rate positively affects different components of aggregate demand. A
lower interest rate means a lower return on saving. This discourages saving and encourage
household spending. There is a resulted increase in consumption expenditure. A cut in
interest rate means a lower cost of investment raising the level of investment. Increase in
investment and consumption spending immediately increases aggregate demand shifting the
AD curve rightward to AD1 (Johnson 2017). The equilibrium then moves from A to B raising
Document Page
5MACROECONOMICS
price level to P1 and output level to Y1 (beyond potential GDP). In the dynamic mode
increase in price level resulted from a smaller interest rate has a second round effect on short
run aggregate supply curve. Increase in price level encourages suppliers to supply more. As
all the producers willing to increase level of production demand for different input increases.
Higher demand increases input price raising the cost of production of firms. As cost of
production increases firms reduce their production (Baumol and Blinder 2016). This shifts
the supply curve leftward to SRAS1. The long run equilibrium in the model sets at point C. At
the new equilibrium point C, real GDP backs to the potential output while price level
increases to P2.
Question 3
Question a
The recorded unemployment rate in Australia during 1992 was 10.729. The
unemployment rate then was considerably higher than the natural rate. Since then
unemployment in Australia mostly followed a down ward trend with unemployment remain
around 5 percent in recent years. The steady decline in unemployment is mostly contributed
from an increase in part time employment as against full time employment. The share of part
time employment has increased steadily accounting nearly one third of the labor force
(rba.gov.au 2018). The increasing share of part time employment benefits both the employers
and employees. For the workers, part-time jobs allow them to combine their paid work with
other works such as education, spend some leisure time and care for families. For employers
side, hiring part time workers give them flexibility of hiring workers depending on demand.
The resulted flexibility from part time jobs in Australia has significantly increased labor
market participation. With this over time there are increasing number of workers who are
Document Page
6MACROECONOMICS
willing to do part time jobs. The growing number of part time jobs thus help the nation to
keep unemployment at the stable level.
Natural rate of unemployment
The natural rate of unemployment is defined as the proportion of unemployed workers
when the economy is in full employment. It clarifies the idea that full employment is not
associated with zero unemployment rate. The concept of natural rate of unemployment
related to the hypothetical rate of unemployment that is consistent with the aggregate
production associated with the long run level.
Relation between natural rate of unemployment and long run aggregate supply
The natural rate of unemployment is related to potential GDP of an economy which in
turn determines the long run aggregate supply. The economy reaches to full employment
when actual unemployment is equivalent to full employment. As the economy operates at full
employment level actual GDP is same as the potential GDP (Mankiw 2016). The output
associated with natural rate of unemployment therefore indicates long run aggregate supply.
Question b
If government takes measures to stimulate demand then it will boost aggregate
demand of the economy. Measures to expand demand increases aggregate demand of the
economy. As demand increases there is an increase in aggregate output and price level.
tabler-icon-diamond-filled.svg

Paraphrase This Document

Need a fresh take? Get an instant paraphrase of this document with our AI Paraphraser
Document Page
7MACROECONOMICS
Figure 3: Impact of measures to stimulate aggregate demand
The measures to boost aggregate demand shifts aggregate demand rightward from AD
to AD1. As aggregate demand increases, equilibrium shifts from E to E1. Consequently, real
GDP increases to Y1 and price level increases to P1. As the measure is taken following a
misunderstanding regarding NAIRU, there will be an additional pressure on price level and
real GDP (Taylor, Steven and Lange 2015). The measures taken by government thus can
push the output beyond the potential level. In case of price level, the expansionary policy
measures though reduces price level but may increase the inflation beyond the targeted range.
Document Page
8MACROECONOMICS
References
Agenor, P.R. and Montiel, P.J., 2015. Development macroeconomics. Princeton University
Press.
Baumol, W.J. and Blinder, A.S., 2016. Principles of Macroeconomics. Cengage Learning.
Goodwin, N., Harris, J.M., Nelson, J.A., Roach, B. and Torras, M., 2015. Macroeconomics in
context. Routledge.
Heijdra, B.J., 2017. Foundations of modern macroeconomics. Oxford university press.
Johnson, H.G., 2017. Macroeconomics and monetary theory. Routledge.
Mankiw, N.G., 2016. Brief principles of macroeconomics. Cengage Learning.
Martin, P. 2019. Why low wage growth hurts. [online] The Sydney Morning Herald.
Available at: https://www.smh.com.au/politics/federal/why-low-wage-growth-hurts-
20170222-guj18g.html [Accessed 26 Jul. 2019].
rba.gov.au 2018. The Rising Share of Part-time Employment | Bulletin – September Quarter
2017. [online] Reserve Bank of Australia. Available at:
https://www.rba.gov.au/publications/bulletin/2017/sep/3.html [Accessed 26 Jul. 2019].
Taylor, T., Steven, A. and Lange, C., 2015. Principles of Macroeconomics.
Uribe, M. and Schmitt-Grohe, S., 2017. Open economy macroeconomics. Princeton
University Press.
chevron_up_icon
1 out of 9
circle_padding
hide_on_mobile
zoom_out_icon
[object Object]