Economic Principles Assignment: NAFTA, Drug Cartels, and Trade

Verified

Added on  2022/12/21

|10
|1772
|1
Homework Assignment
AI Summary
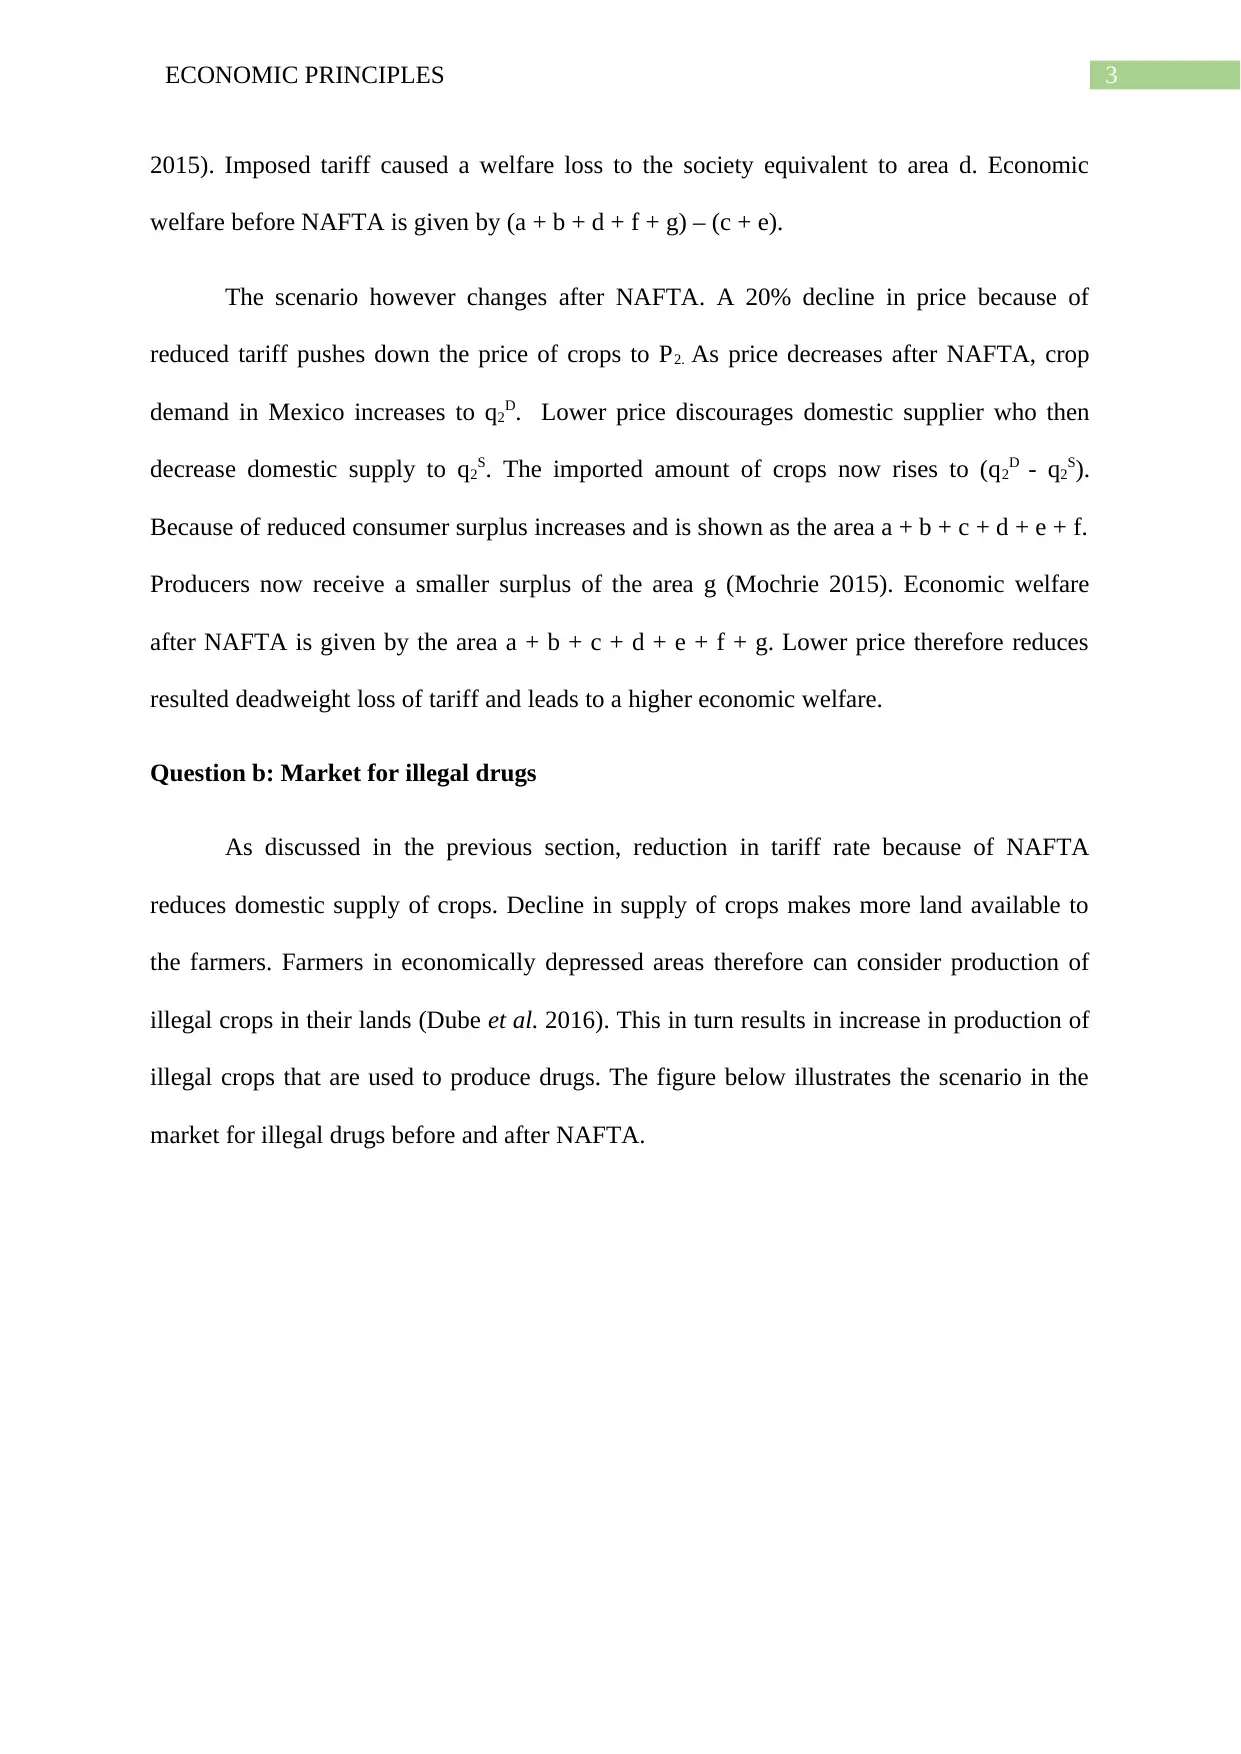
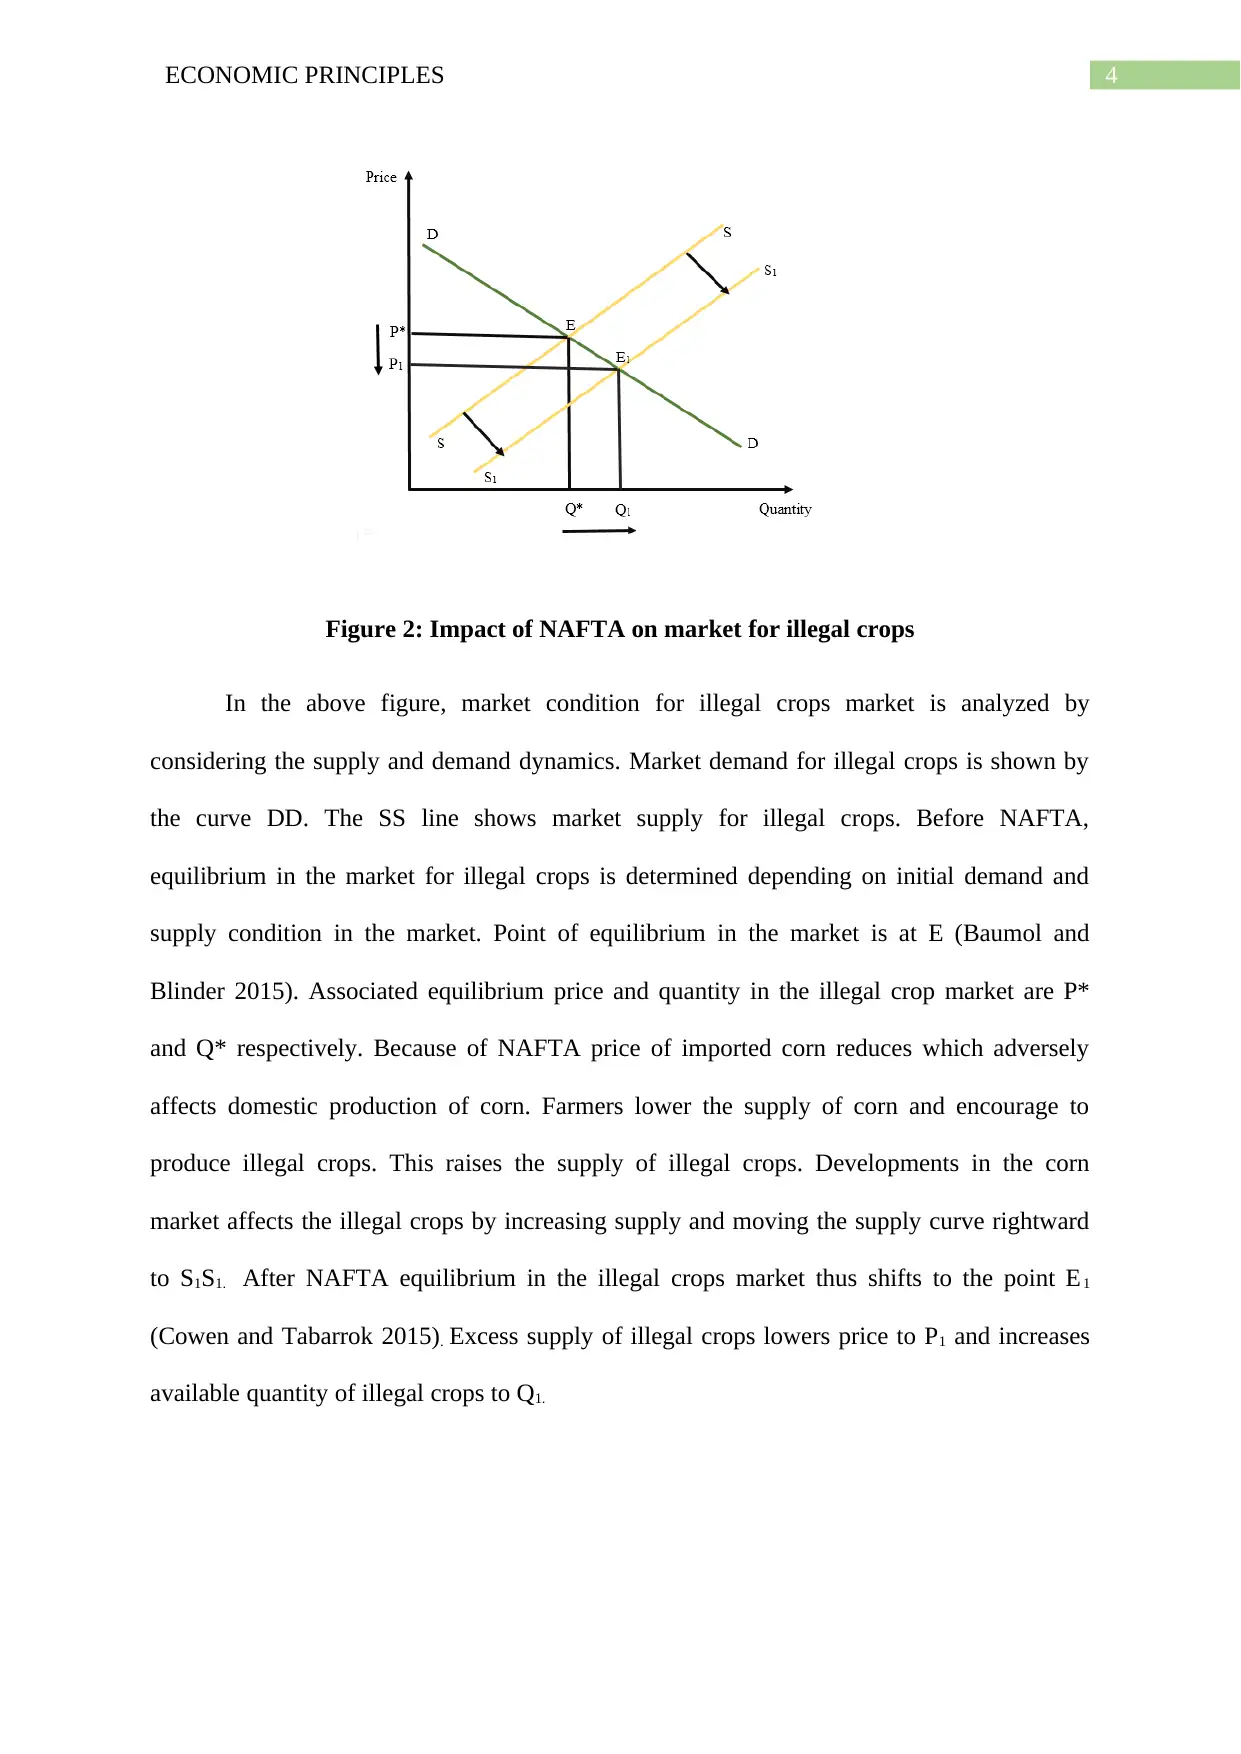
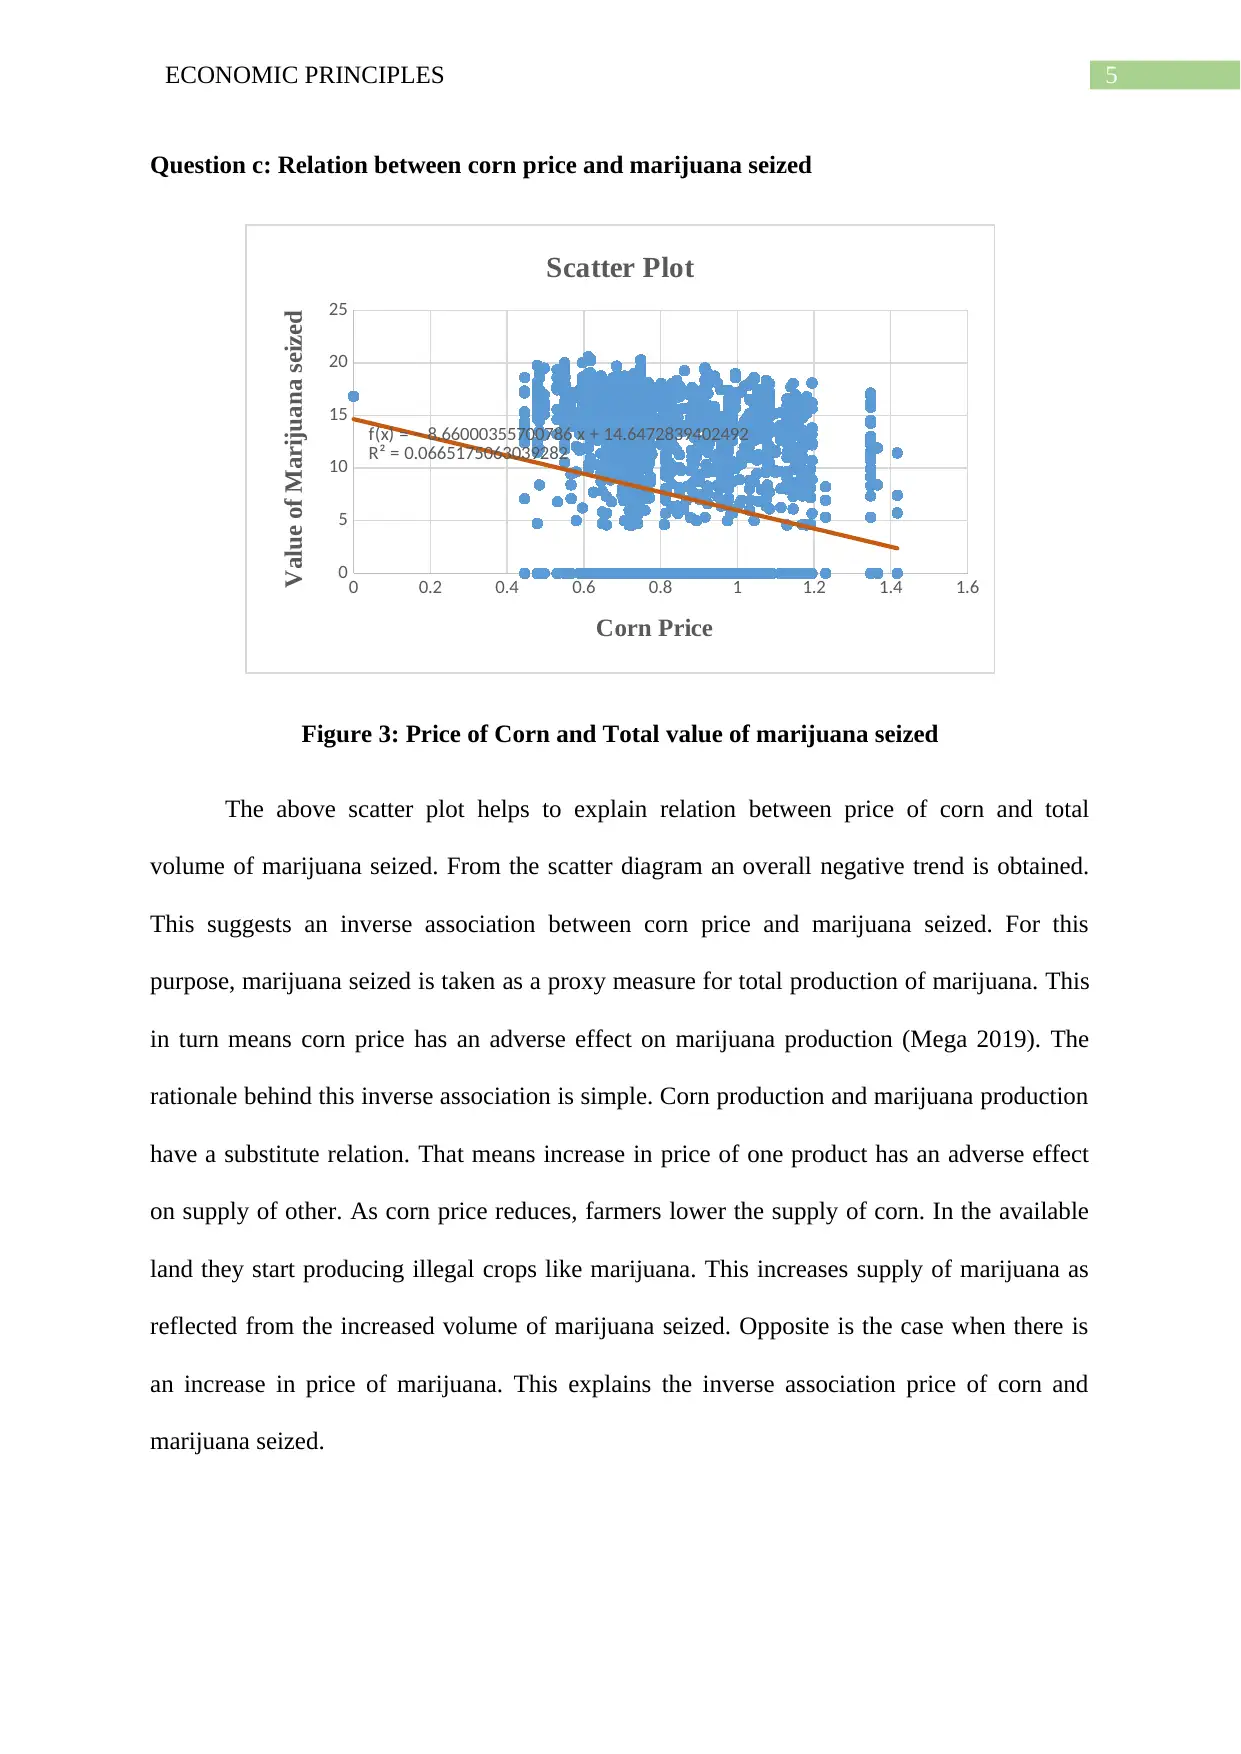
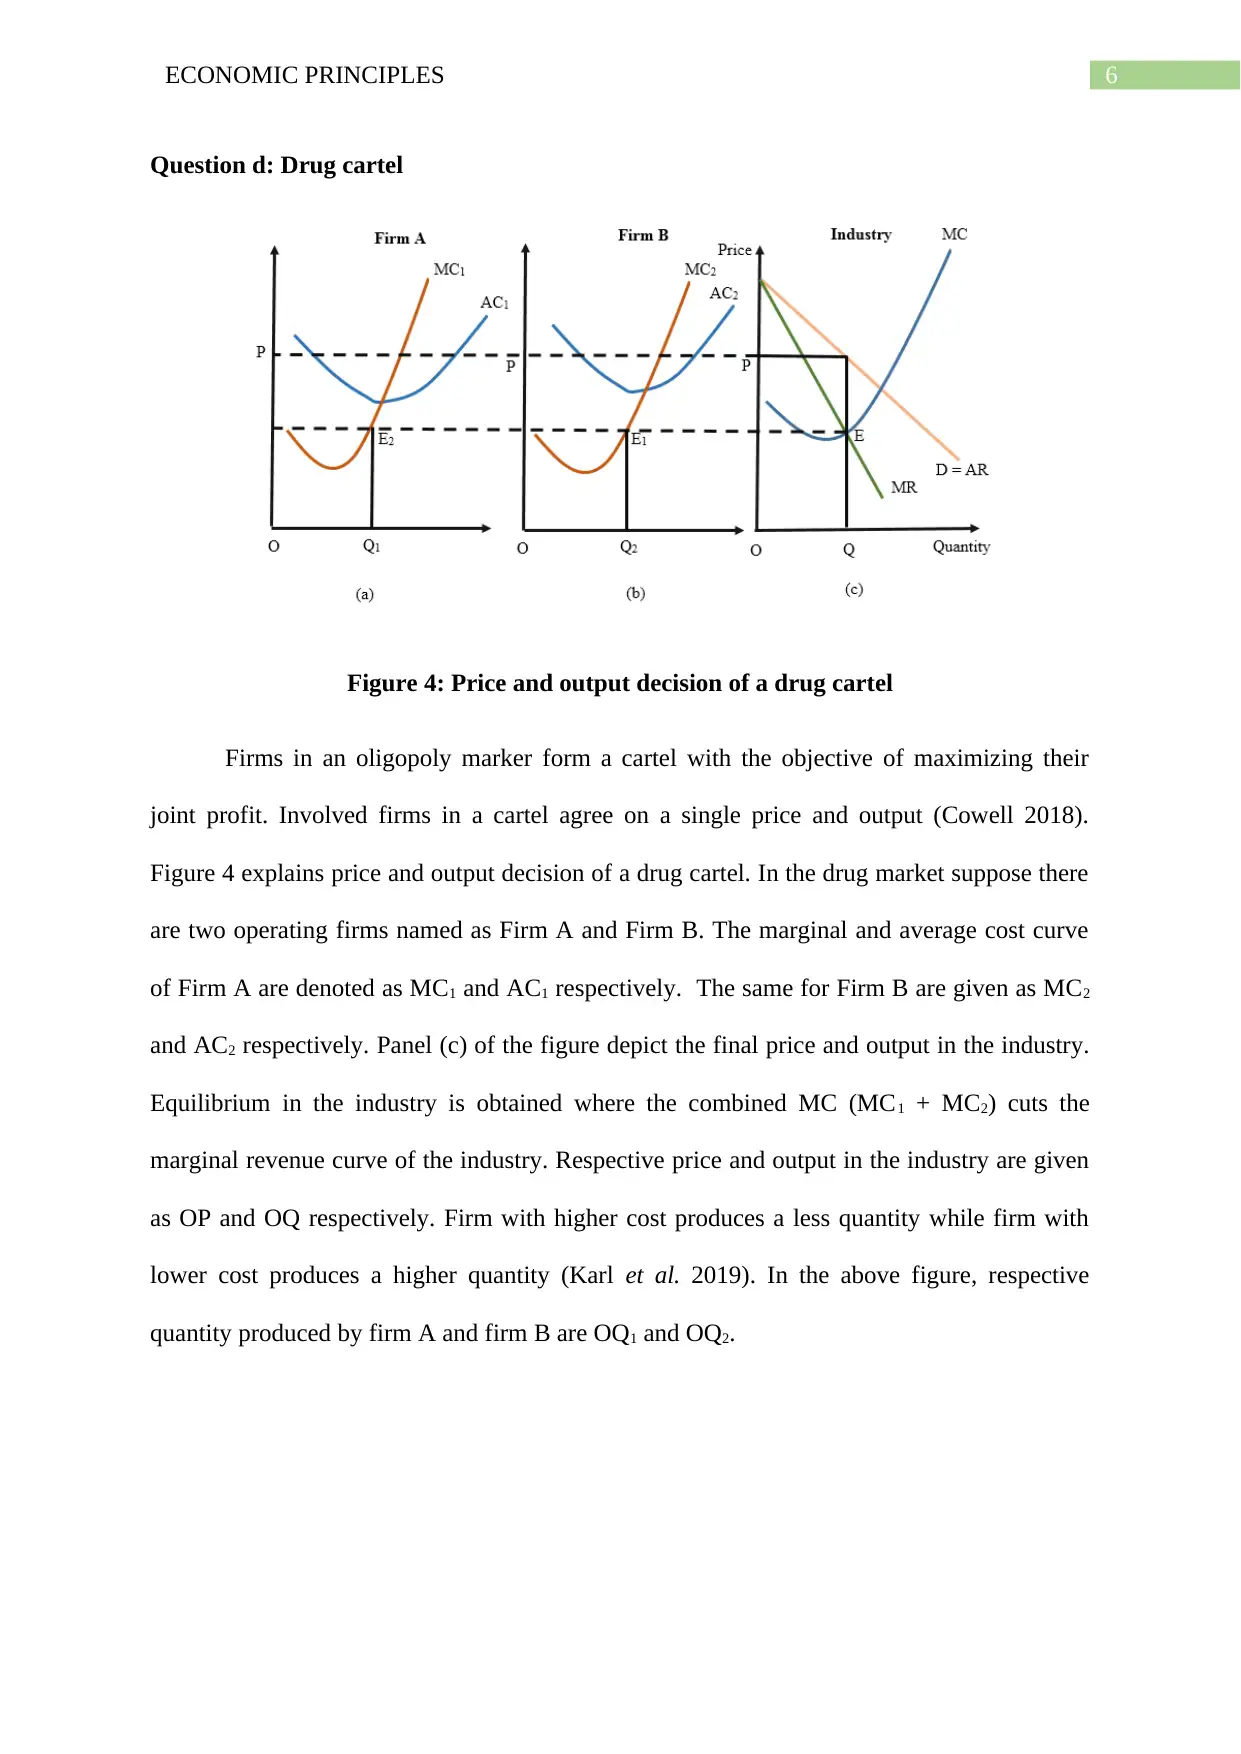
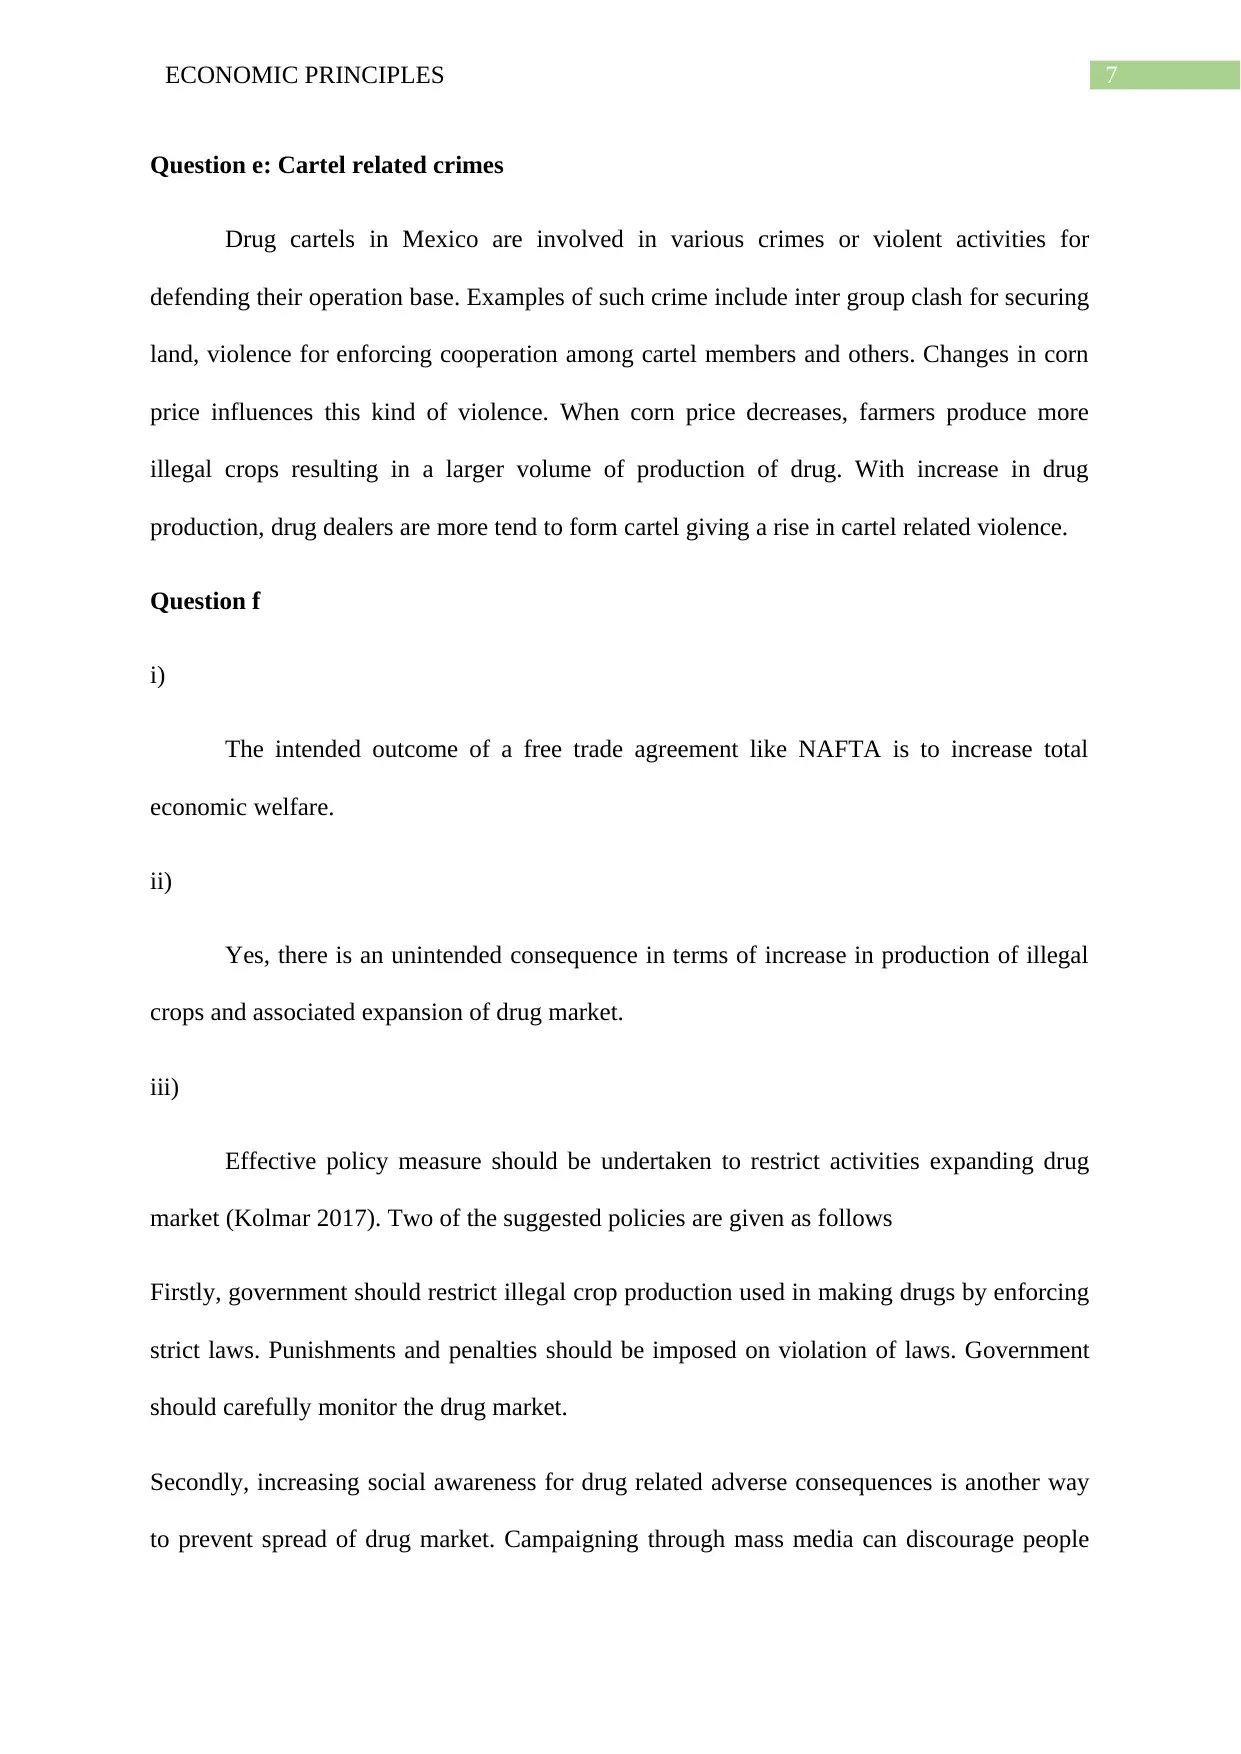
This economics assignment, likely for a course like MAE101, delves into the economic principles at play within the international drug trade, specifically examining the impact of the North American Free Trade Agreement (NAFTA). The assignment analyzes the effects of reduced tariffs on the Mexican crop market, showing how it influences the supply and demand dynamics of both legal and illegal crops, like corn and marijuana. It explores the relationship between corn prices and marijuana seizures, revealing an inverse correlation, and models the price and output decisions of drug cartels using supply and demand curves. Furthermore, the assignment considers the connection between corn prices, cartel activities, and related crimes. The student also suggests policy measures to mitigate the unintended consequences of free trade agreements, such as stricter enforcement of laws against illegal crop production and public awareness campaigns to discourage drug consumption. The analysis includes diagrams, scatter plots, and economic models to illustrate the concepts.
tabler-icon-diamond-filled.svg

Contribute Materials

Your contribution can guide someone’s learning journey. Share your documents today.
Document Page
Running head: ECONOMIC PRINCIPLES
Economic Principles
Name of the Student
Name of the University
Course ID
tabler-icon-diamond-filled.svg

Secure Best Marks with AI Grader

Need help grading? Try our AI Grader for instant feedback on your assignments.
Document Page
1ECONOMIC PRINCIPLES
Table of Contents
Task 2: Breaking bad: economic incentives and the international drug trade...........................2
Question a: Market for corn before and after NAFTA..........................................................2
Question b: Market for illegal drugs......................................................................................3
Question c: Relation between corn price and marijuana seized.............................................5
Question d: Drug cartel..........................................................................................................6
Question e: Cartel related crimes...........................................................................................7
Question f...............................................................................................................................7
References..................................................................................................................................9
Document Page
2ECONOMIC PRINCIPLES
Task 2: Breaking bad: economic incentives and the international drug trade
Question a: Market for corn before and after NAFTA
Free trade agreement encourages a barrier free exchange of goods and services among
different nations. When nations involve in free trade it generally benefits all the participating
nations (Leamer and Stern 2017). The figure below explains the possible impact of North
American Free Trade Agreement and a consequent reduction in import tariff on Mexican
crop market.
Figure 1: Impact of a drop in imported price of crops in Mexico
In the above figure, domestic demand and domestic supply curve of crops in Mexico
are given as D1D1 and S1S1 respectively. Suppose before NAFTA, price of imported crops in
Mexico was at P1. At price P1, demand for crops in Mexico was at q1D. Domestic supply of
crops in Mexico at the given price was q1S. As domestic demand is larger than domestic
supply of crops (q1D - q1S) amount of crops were imported previously. Surplus enjoyed by
consumers was equivalent to a + f. Surplus enjoyed by producers was equivalent to g + b.
From the tariff, Mexican government earned a tariff revenue equivalent to area d (Feenstra
Document Page
3ECONOMIC PRINCIPLES
2015). Imposed tariff caused a welfare loss to the society equivalent to area d. Economic
welfare before NAFTA is given by (a + b + d + f + g) – (c + e).
The scenario however changes after NAFTA. A 20% decline in price because of
reduced tariff pushes down the price of crops to P2. As price decreases after NAFTA, crop
demand in Mexico increases to q2D. Lower price discourages domestic supplier who then
decrease domestic supply to q2S. The imported amount of crops now rises to (q2D - q2S).
Because of reduced consumer surplus increases and is shown as the area a + b + c + d + e + f.
Producers now receive a smaller surplus of the area g (Mochrie 2015). Economic welfare
after NAFTA is given by the area a + b + c + d + e + f + g. Lower price therefore reduces
resulted deadweight loss of tariff and leads to a higher economic welfare.
Question b: Market for illegal drugs
As discussed in the previous section, reduction in tariff rate because of NAFTA
reduces domestic supply of crops. Decline in supply of crops makes more land available to
the farmers. Farmers in economically depressed areas therefore can consider production of
illegal crops in their lands (Dube et al. 2016). This in turn results in increase in production of
illegal crops that are used to produce drugs. The figure below illustrates the scenario in the
market for illegal drugs before and after NAFTA.
tabler-icon-diamond-filled.svg

Secure Best Marks with AI Grader

Need help grading? Try our AI Grader for instant feedback on your assignments.
Document Page
4ECONOMIC PRINCIPLES
Figure 2: Impact of NAFTA on market for illegal crops
In the above figure, market condition for illegal crops market is analyzed by
considering the supply and demand dynamics. Market demand for illegal crops is shown by
the curve DD. The SS line shows market supply for illegal crops. Before NAFTA,
equilibrium in the market for illegal crops is determined depending on initial demand and
supply condition in the market. Point of equilibrium in the market is at E (Baumol and
Blinder 2015). Associated equilibrium price and quantity in the illegal crop market are P*
and Q* respectively. Because of NAFTA price of imported corn reduces which adversely
affects domestic production of corn. Farmers lower the supply of corn and encourage to
produce illegal crops. This raises the supply of illegal crops. Developments in the corn
market affects the illegal crops by increasing supply and moving the supply curve rightward
to S1S1. After NAFTA equilibrium in the illegal crops market thus shifts to the point E1
(Cowen and Tabarrok 2015). Excess supply of illegal crops lowers price to P1 and increases
available quantity of illegal crops to Q1.
Document Page
5ECONOMIC PRINCIPLES
Question c: Relation between corn price and marijuana seized
0 0.2 0.4 0.6 0.8 1 1.2 1.4 1.6
0
5
10
15
20
25
f(x) = − 8.66000355700786 x + 14.6472839402492
R² = 0.0665175063039282
Scatter Plot
Corn Price
Value of Marijuana seized
Figure 3: Price of Corn and Total value of marijuana seized
The above scatter plot helps to explain relation between price of corn and total
volume of marijuana seized. From the scatter diagram an overall negative trend is obtained.
This suggests an inverse association between corn price and marijuana seized. For this
purpose, marijuana seized is taken as a proxy measure for total production of marijuana. This
in turn means corn price has an adverse effect on marijuana production (Mega 2019). The
rationale behind this inverse association is simple. Corn production and marijuana production
have a substitute relation. That means increase in price of one product has an adverse effect
on supply of other. As corn price reduces, farmers lower the supply of corn. In the available
land they start producing illegal crops like marijuana. This increases supply of marijuana as
reflected from the increased volume of marijuana seized. Opposite is the case when there is
an increase in price of marijuana. This explains the inverse association price of corn and
marijuana seized.
Document Page
6ECONOMIC PRINCIPLES
Question d: Drug cartel
Figure 4: Price and output decision of a drug cartel
Firms in an oligopoly marker form a cartel with the objective of maximizing their
joint profit. Involved firms in a cartel agree on a single price and output (Cowell 2018).
Figure 4 explains price and output decision of a drug cartel. In the drug market suppose there
are two operating firms named as Firm A and Firm B. The marginal and average cost curve
of Firm A are denoted as MC1 and AC1 respectively. The same for Firm B are given as MC2
and AC2 respectively. Panel (c) of the figure depict the final price and output in the industry.
Equilibrium in the industry is obtained where the combined MC (MC1 + MC2) cuts the
marginal revenue curve of the industry. Respective price and output in the industry are given
as OP and OQ respectively. Firm with higher cost produces a less quantity while firm with
lower cost produces a higher quantity (Karl et al. 2019). In the above figure, respective
quantity produced by firm A and firm B are OQ1 and OQ2.
tabler-icon-diamond-filled.svg

Paraphrase This Document

Need a fresh take? Get an instant paraphrase of this document with our AI Paraphraser
Document Page
7ECONOMIC PRINCIPLES
Question e: Cartel related crimes
Drug cartels in Mexico are involved in various crimes or violent activities for
defending their operation base. Examples of such crime include inter group clash for securing
land, violence for enforcing cooperation among cartel members and others. Changes in corn
price influences this kind of violence. When corn price decreases, farmers produce more
illegal crops resulting in a larger volume of production of drug. With increase in drug
production, drug dealers are more tend to form cartel giving a rise in cartel related violence.
Question f
i)
The intended outcome of a free trade agreement like NAFTA is to increase total
economic welfare.
ii)
Yes, there is an unintended consequence in terms of increase in production of illegal
crops and associated expansion of drug market.
iii)
Effective policy measure should be undertaken to restrict activities expanding drug
market (Kolmar 2017). Two of the suggested policies are given as follows
Firstly, government should restrict illegal crop production used in making drugs by enforcing
strict laws. Punishments and penalties should be imposed on violation of laws. Government
should carefully monitor the drug market.
Secondly, increasing social awareness for drug related adverse consequences is another way
to prevent spread of drug market. Campaigning through mass media can discourage people
Document Page
8ECONOMIC PRINCIPLES
from consuming drugs. This campaigns should include adverse impact from excessive drug
consumption, proper advice to resist drug use and such others. Media such as newspapers,
television, billboards, radios and music videos can be used for this purpose.
Document Page
9ECONOMIC PRINCIPLES
References
Baumol, W.J. and Blinder, A.S., 2015. Microeconomics: Principles and policy. Nelson
Education.
Cowell, F., 2018. Microeconomics: principles and analysis. Oxford University Press.
Cowen, T. and Tabarrok, A., 2015. Modern principles of microeconomics. Macmillan
International Higher Education.
Dube, O., García-Ponce, O. and Thom, K., 2016. From maize to haze: Agricultural shocks
and the growth of the mexican drug sector. Journal of the European Economic
Association, 14(5), pp.1181-1224.
Feenstra, R.C., 2015. Advanced international trade: theory and evidence. Princeton
university press.
Karl, E., Case, F., Oster, R. and Sharon, E., 2019. Principles of Microeconomics. Pearson.
Kolmar, M., 2017. Principles of Microeconomics. Springer International Publishing.
Leamer, E.E. and Stern, R.M., 2017. Quantitative international economics. Routledge.
Mega, E.R., 2019. Violent drug cartels stifle Mexican science. Nature, 566(7744), pp.303-
304.
Mochrie, R., 2015. Intermediate microeconomics. Macmillan International Higher Education.
chevron_up_icon
1 out of 10
circle_padding
hide_on_mobile
zoom_out_icon
logo.png

Your All-in-One AI-Powered Toolkit for Academic Success.

Available 24*7 on WhatsApp / Email

[object Object]