Economic Principles and Market Structures: Assignment 1, Analysis

Verified

Added on  2023/01/24

|14
|2543
|45
Homework Assignment
AI Summary
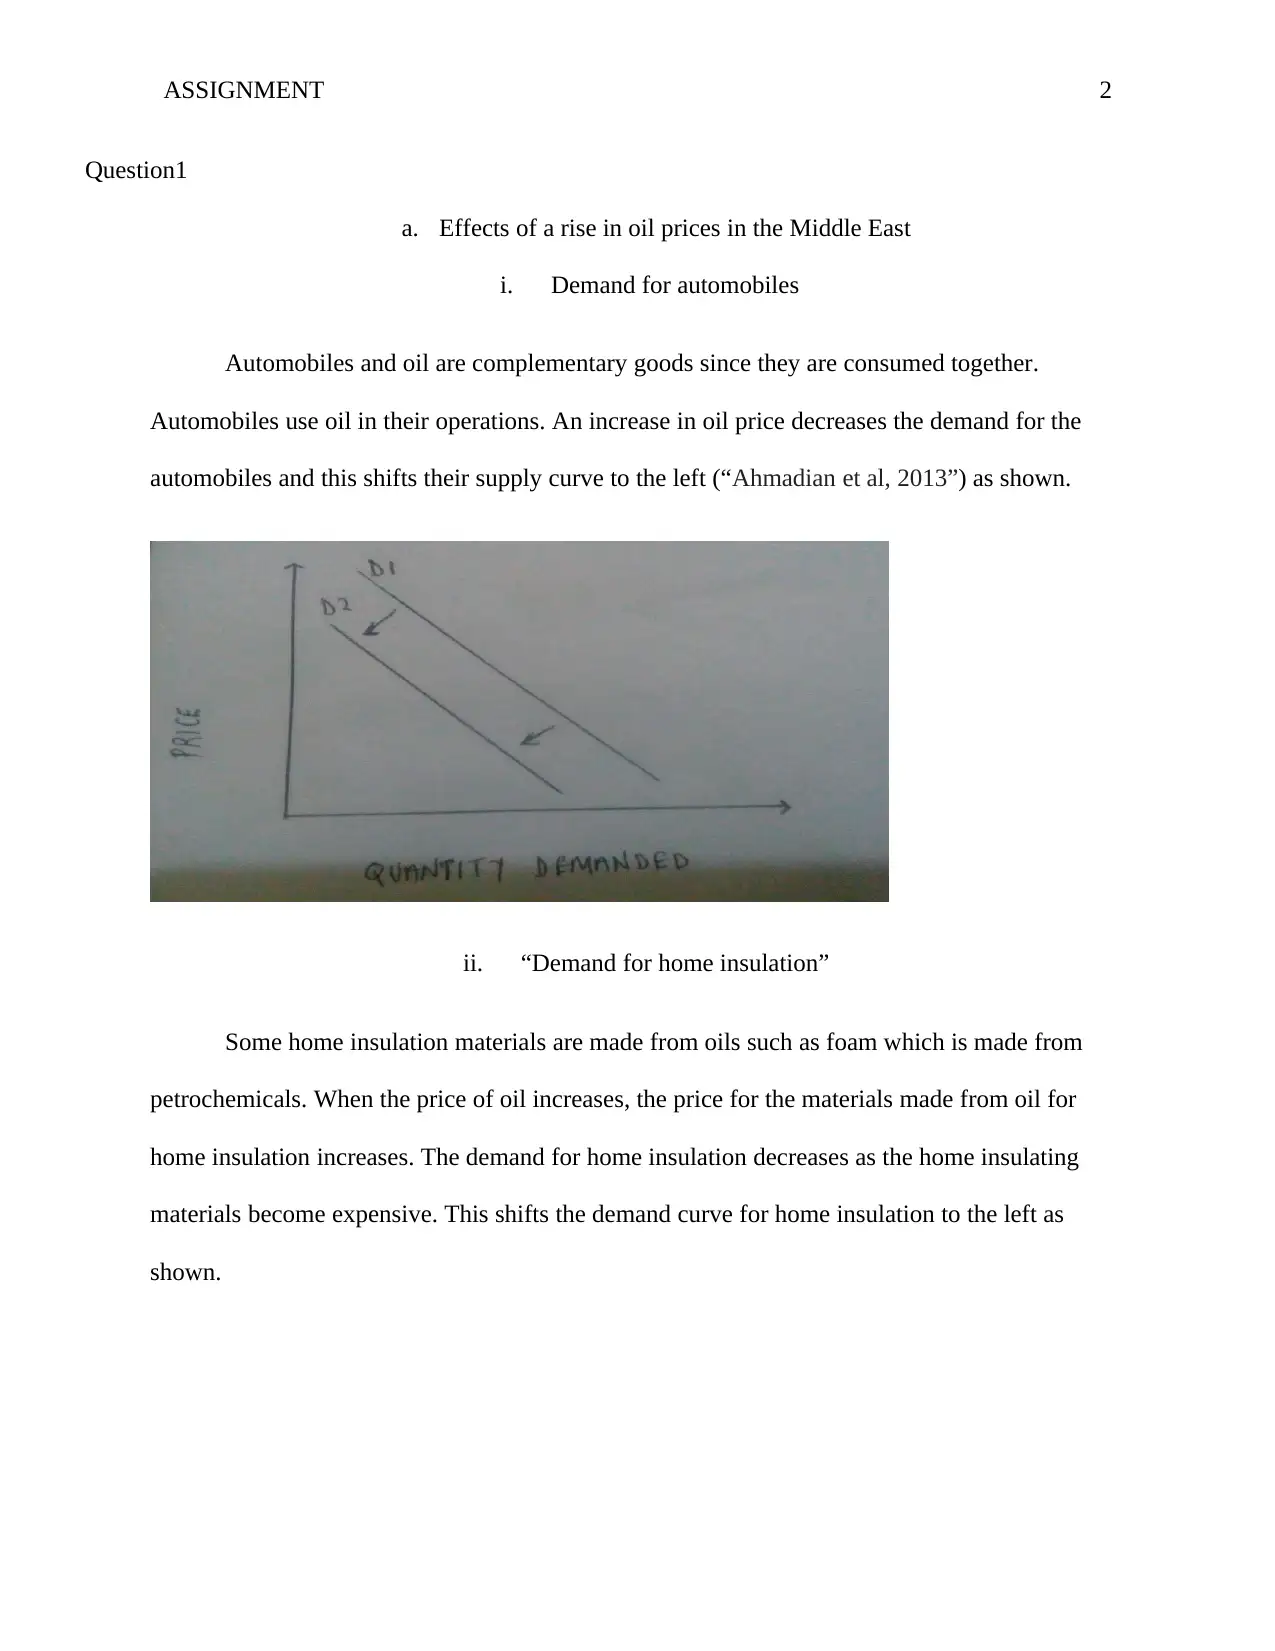
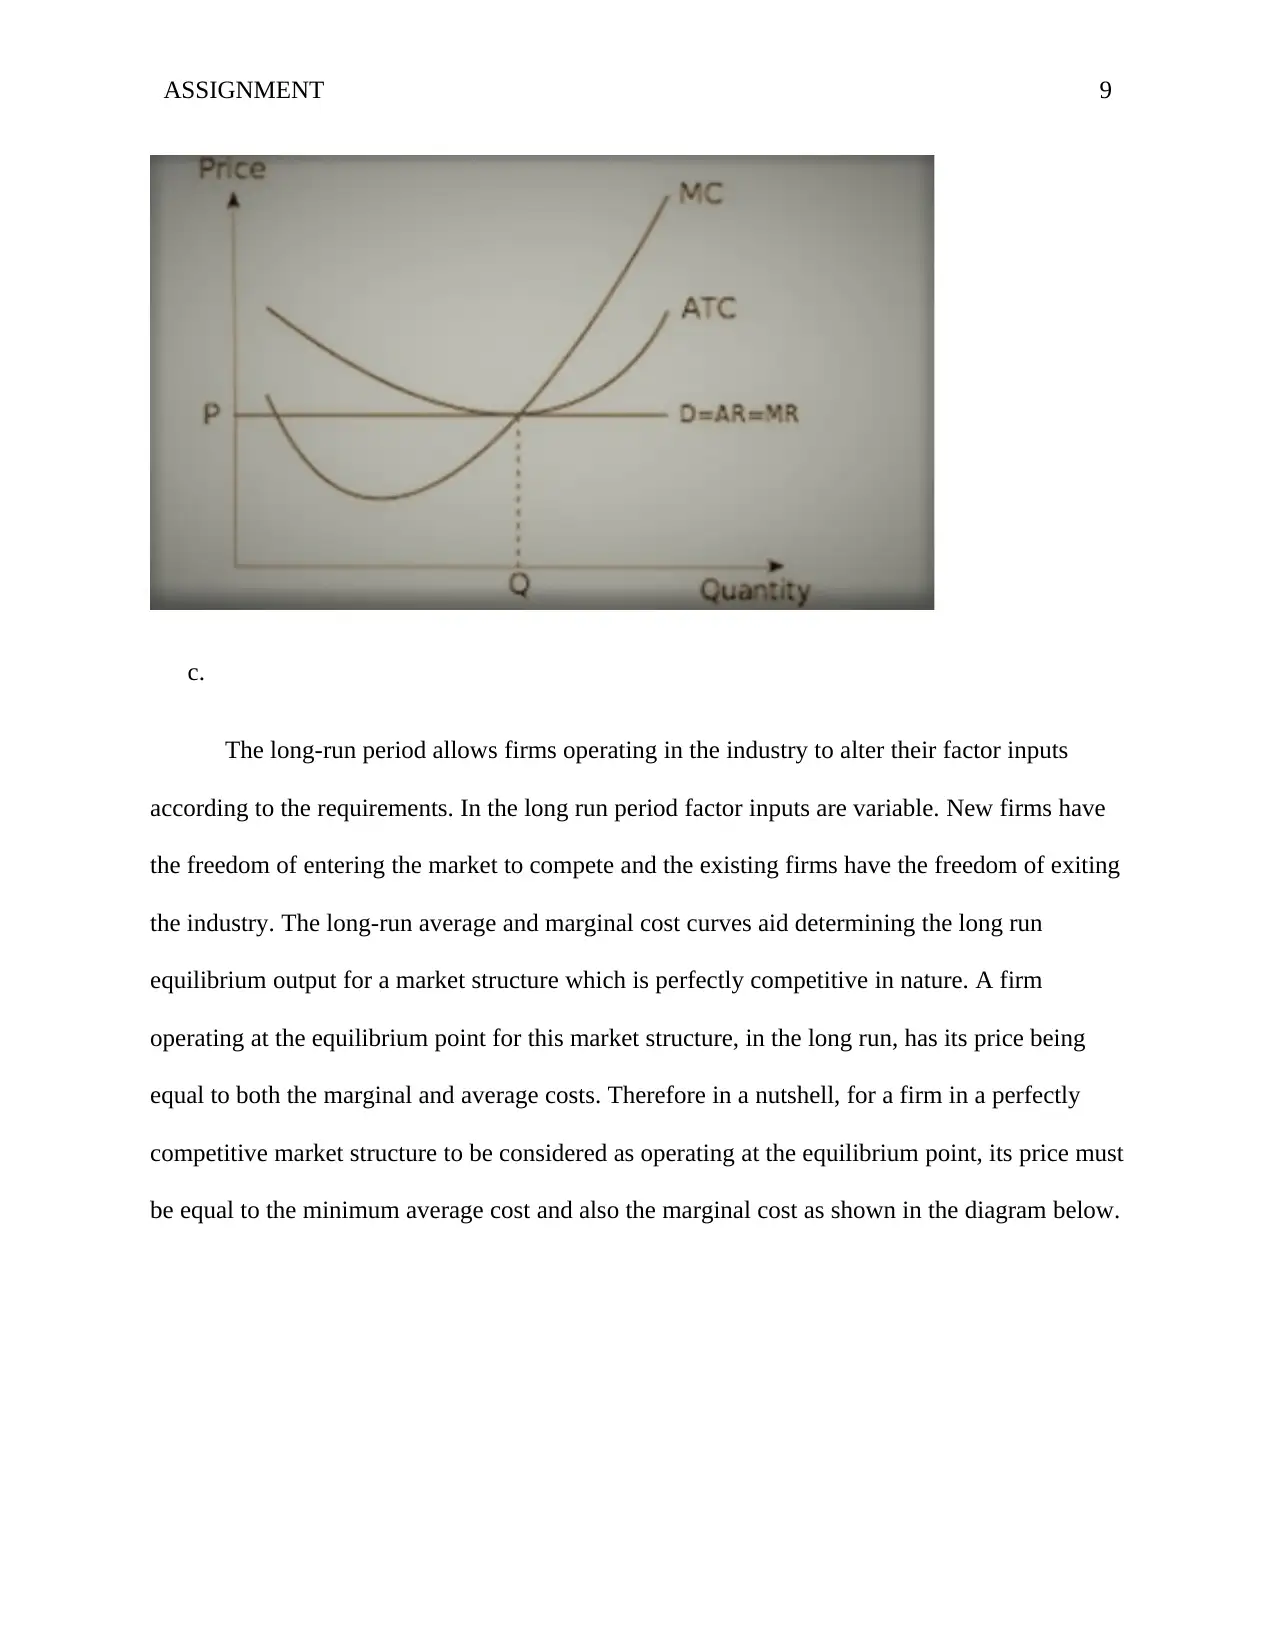
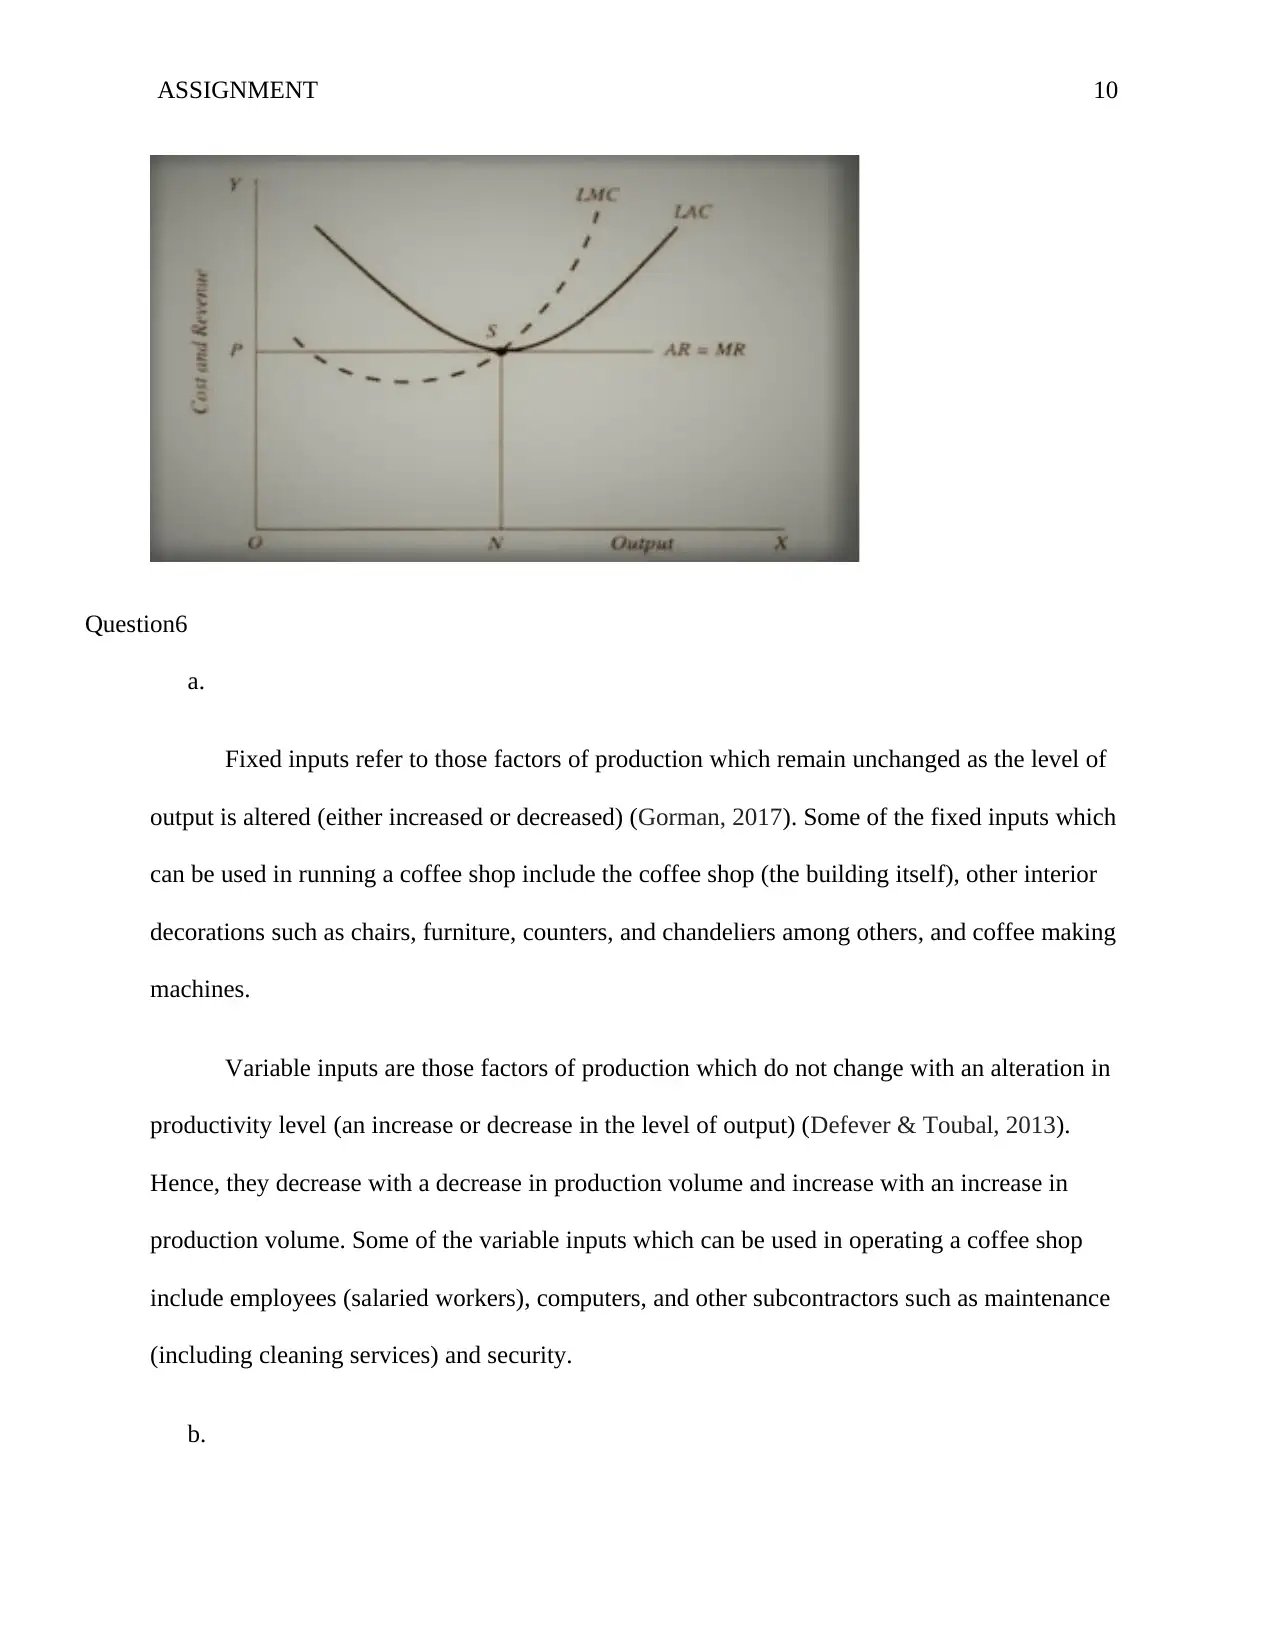
This economics assignment delves into various microeconomic concepts. It begins by analyzing the effects of rising oil prices on related markets, including automobiles, home insulation, coal, tires, and bicycles. The assignment then explores externalities, differentiating between external costs and benefits and their impact on resource allocation. It investigates the role of private markets in producing public goods. The assignment further examines income and cross-price elasticity of demand, determining the nature of goods (normal vs. inferior, substitutes vs. complements). It also discusses the characteristics and practical limitations of perfectly competitive market structures, analyzing short-run and long-run equilibrium for both individual firms and the industry. The assignment covers fixed and variable costs in a coffee shop scenario, calculating average and total costs. Finally, it examines cartel behavior, including price and output decisions, and the incentives for individual firms to deviate from the cartel agreement.
Document Page
Running head: ASSIGNMENT 1
ASSIGNMENT 1
Student Name
Institutional Affiliation
Facilitator
Course
Date
tabler-icon-diamond-filled.svg

Secure Best Marks with AI Grader

Need help grading? Try our AI Grader for instant feedback on your assignments.
Document Page
ASSIGNMENT 2
Question1
a. Effects of a rise in oil prices in the Middle East
i. Demand for automobiles
Automobiles and oil are complementary goods since they are consumed together.
Automobiles use oil in their operations. An increase in oil price decreases the demand for the
automobiles and this shifts their supply curve to the left (“Ahmadian et al, 2013”) as shown.
ii. “Demand for home insulation”
Some home insulation materials are made from oils such as foam which is made from
petrochemicals. When the price of oil increases, the price for the materials made from oil for
home insulation increases. The demand for home insulation decreases as the home insulating
materials become expensive. This shifts the demand curve for home insulation to the left as
shown.
Document Page
ASSIGNMENT 3
iii. Demand for coal
Oil and coal are close substitutes. An increase in the price of oil will increase the demand
for coal. This means the demand curve for coal will shift towards the right direction as shown.
iv. Demand for tires
Tires are made from synthetic rubber which is manufactured from oil. Oil price increase
increases the price for tires and hence decreases their demand (Fouquet, 2012). This shifts their
demand curve to the left as shown.
Document Page
ASSIGNMENT 4
v. Demand for bicycles
An increase in the price of oil will increase the transport costs. People who use public and
private transport shift and start using bicycles for transport. This increases the demand for
bicycles and their demand curve moves towards the right as shown.
b.
Externalities refer to costs and benefits to parties who did not choose to incur them
(Palmquist, 2018). External costs also referred to as negative externalities, cause negative effects
to third parties. The presence of external costs makes utilization of resources inefficient. This is
tabler-icon-diamond-filled.svg

Secure Best Marks with AI Grader

Need help grading? Try our AI Grader for instant feedback on your assignments.
Document Page
ASSIGNMENT 5
due to the fact that social cost exceeds the social benefit. This leads to the over-allocation of
resources.
External benefits also referred to as positive externalities, positively impact third parties.
An occurrence of positive externalities makes the social benefits to exceed the social costs and
hence production level can be increased as marginal social costs are below marginal social
benefits. Therefore, external benefits lead to under allocation of resources as efficiency in
production is attained (Lee et al, 2012).
vi.
Private markets aim at maximizing profit but not social welfare. Public goods are no-
excludable in consumption and hence benefit all people irrespective of their payments (Varian,
2013). This raises the problem of free-rider issue as the private marginal benefit is exceeded by
the social marginal benefit. Insufficient incentives for goods produced by private markets means
that they will incur resource under allocation and hence end up producing fewer goods than the
optimally social benefit goods. This is due to the fact they aim at maximizing profits and not the
welfare of the society. Reduced productivity and higher demand increase price for the public
goods and hence higher profits are realized. Therefore, for this reason, public goods end up being
produced in insufficient amounts in private markets.
Question4
a.
In the case of income elasticity, a reduction in consumer level of income by 10 percent
indicates that the demand for the pre-recorded music compact will be impacted by 7*10 percent
which is 70 percent, while the cabinet maker’s work demand will be impacted by 0.7*10 percent
Document Page
ASSIGNMENT 6
which equals to 7 percent. The reduction in consumer level of income highly impacts “pre-
recorded music compact” as compared to “the cabinet maker’s work”. This shows that luxurious
commodities have greater income elasticity as compared to necessities. Pre-recorded music
compact is categorized under luxurious goods as its income elasticity is greater than one while
the cabinet maker’s work is categorized under necessities as its income elasticity in less than one.
b.
A determination of whether MP3 music players and pre-recorded music compacts
compete with each other is done by use of cross-price demand elasticity. A result, less than zero
is an indication that the two goods are complements while a result greater than zero is an
indication that the goods are substitutes to each other. If the goods are classified as substitutes
then it means they are in competition with each other while if categorized as complements then it
means they don’t compete with each other.
c.
When the income elasticity of demand for a given good is greater than zero, then it is said
to be a normal good and when the income elasticity of a good is less than zero then it is
categorized as an inferior good. Income elasticity of +0.8 indicates that the good is a normal and
its coefficient will be consequently less than one an indication that the good is inelastic. Income
elasticity of -2.4 indicates that the good is inferior and its coefficient is noted to be greater than
one, an indication that the good is elastic (Sabatelli, 2016).
d.
Document Page
ASSIGNMENT 7
A cross-price elasticity greater than zero, then this implies that the goods are close
substitutes and their coefficient is less than 1 indicating that they are inelastic. The goods highly
compete with each other. A cross-price elasticity less than zero implies that the goods are
complements to each other and their coefficient is greater than one indicating that they are elastic
(Stern, 2011).
Question5
a.
It is true that a perfect competition market structure is of little practical value. The
characteristics of this market structure aid in understanding the reason behind its little practical
value better. A perfectly competitive market structure is characterized by vast number of buyers
and sellers, homogenous products and firms adopt the prices determined by the market demand
and supply conditions. In real life situations, many industries are composed of only a few sellers
or even a single seller controlling the entire market. The sellers are the price makers and offer
products which are differentiated from each other in order to maximize sales for their products
and hence make high profits (Thampapillai, 2010). Therefore, many industries do not conform to
the perfectly competitive market structure characteristics and hence it is of little practical value.
b.
i. Individual firm short-run equilibrium for a perfectly competitive market structure
Individual firm short-run equilibrium for a perfectly competitive market structure is a
period which allows firms to alter their production factors in order to maximize their profits and
avoid loss. Firms are restricted from entering the market during this period. A firm operating in a
perfectly competitive market is said to be at equilibrium point if its operations earn its maximum
tabler-icon-diamond-filled.svg

Paraphrase This Document

Need a fresh take? Get an instant paraphrase of this document with our AI Paraphraser
Document Page
ASSIGNMENT 8
profits. At equilibrium point, a perfectly competitive market structure has its marginal cost and
the marginal revenue being equal and the marginal cost curve meets the marginal revenue curve
from below and then afterward it begins to rise as shown in the diagram below. The equilibrium
point is indicated by the red dot.
ii. Industry firm short-run equilibrium for a perfectly competitive market structure
In the short run period, an industry is said to be in equilibrium if its total productivity
becomes steady. This means that its output quantity tendency to increase or decrease is absent at
this period. The industry equilibrium is attained if all firms operating in the industry are at
equilibrium (“Dressler, 2016”) as indicated in the diagram below.
Document Page
ASSIGNMENT 9
c.
The long-run period allows firms operating in the industry to alter their factor inputs
according to the requirements. In the long run period factor inputs are variable. New firms have
the freedom of entering the market to compete and the existing firms have the freedom of exiting
the industry. The long-run average and marginal cost curves aid determining the long run
equilibrium output for a market structure which is perfectly competitive in nature. A firm
operating at the equilibrium point for this market structure, in the long run, has its price being
equal to both the marginal and average costs. Therefore in a nutshell, for a firm in a perfectly
competitive market structure to be considered as operating at the equilibrium point, its price must
be equal to the minimum average cost and also the marginal cost as shown in the diagram below.
Document Page
ASSIGNMENT 10
Question6
a.
Fixed inputs refer to those factors of production which remain unchanged as the level of
output is altered (either increased or decreased) (Gorman, 2017). Some of the fixed inputs which
can be used in running a coffee shop include the coffee shop (the building itself), other interior
decorations such as chairs, furniture, counters, and chandeliers among others, and coffee making
machines.
Variable inputs are those factors of production which do not change with an alteration in
productivity level (an increase or decrease in the level of output) (Defever & Toubal, 2013).
Hence, they decrease with a decrease in production volume and increase with an increase in
production volume. Some of the variable inputs which can be used in operating a coffee shop
include employees (salaried workers), computers, and other subcontractors such as maintenance
(including cleaning services) and security.
b.
tabler-icon-diamond-filled.svg

Secure Best Marks with AI Grader

Need help grading? Try our AI Grader for instant feedback on your assignments.
Document Page
ASSIGNMENT 11
Hammers produced per day = 100
Total fixed cost = $4000 per day
Total variable cost = $13000 per day
Average fixed cost refers to the dividend of fixed costs and the quantity of output produced.
Fixed costs must be incurred irrespective of the productivity level and whether production is
done or not.
Average Fixed Costs = Fixed Costs/Quantity Produced = $4000/100 = $40
Average variable cost refers to the dividend of the total variable cost and the quantity of output
produced. Variable costs vary with the production level.
Average variable cost = Total Variable Cost/Quantity produced = $13000/100 = $130
Average total cost refers to the dividend of the total cost and the quantity of output produced in
short run production. It can also be calculated as the sum of both the average variable and
average fixed costs.
Average Total Cost = Average Variable Cost + Average Fixed Cost = $40 + $130 = $170
Total cost refers to total expenses incurred in producing a given level of output. It is the sum of
the variable and fixed costs. It can also be obtained by multiplying the average total cost by the
quantity of output produced.
Total cost = Average Total Cost * Quantity produced = $170 * 100 = $17000
c.
Document Page
ASSIGNMENT 12
Fixed costs remain unchanged regardless of the level of productivity. They are incurred
whether or not production takes place. Labor may be treated as a fixed cost in the case of
executive remunerations.
Variable costs vary with the level of a firm’s productivity. They increase with an increase
in productivity and decrease with a decrease in productivity. Labor may be treated as a variable
cost in the case of overtime costs and the salary of the temporary employees.
Question7
a. The cartel will choose price $25 in order to maximize the overall profits. At this point,
the marginal cost equals marginal revenue.
b. The cartel must produce a total output of 100 in order to maintain this price.
c. An individual firm will be restricted to an output level of 10 in order for this price to be
maintained.
d. An individual firm will be tempted to produce an output level of 20 in order to maximize
its own profit at the agreed price of $25. At this point, the marginal cost, price and the
marginal revenue are all equal.
e. If an individual firm undercut cartel price, without retaliation of the other firms, the price
which would maximize its profit is $25 and the output which would maximize its profit is
15 units. At this point the marginal cost and marginal revenue are equal.
Document Page
ASSIGNMENT 13
References
Ahmadian, A., Hassan, A., & Regassa, H. (2013). THE IMPACT OF OIL PRICE
FLUCTUATIONS ON THE AUTOMOBILE INDUSTRY. International Journal of
Business & Economics Perspectives, 8(2).
Defever, F., & Toubal, F. (2013). Productivity, relationship-specific inputs and the sourcing
modes of multinationals. Journal of Economic Behavior & Organization, 94, 345-357.
Dressler, S. (2016). A long-run, short-run, and politico-economic analysis of the welfare costs of
inflation. Journal of Macroeconomics, 47, 255-269.
Fouquet, R. (2012). Trends in income and price elasticities of transport demand (1850–
2010). Energy Policy, 50, 62-71.
Gorman, W. M. (2017). Measuring the quantities of fixed factors. In Value, capital and
growth (pp. 141-172). Routledge.
Lee, Y., Harrison, J. L., Eisenberg, C., & Lee, B. (2012). Modeling biodiversity benefits and
external costs from a keystone predator reintroduction policy. Journal of Mountain
Science, 9(3), 385-394.
Palmquist, R. B. (2018). Valuing localized externalities. Revealed Preference Approaches to
Environmental Valuation Volumes I and II, 81.
Sabatelli, L. (2016). Relationship between the uncompensated price elasticity and the income
elasticity of demand under conditions of additive preferences. PloS one, 11(3), e0151390.
tabler-icon-diamond-filled.svg

Paraphrase This Document

Need a fresh take? Get an instant paraphrase of this document with our AI Paraphraser
Document Page
ASSIGNMENT 14
Stern, D. I. (2011). Elasticities of substitution and complementarity. Journal of Productivity
Analysis, 36(1), 79-89.
Thampapillai, D. J. (2010). Perfect competition and sustainability: a brief note. International
Journal of Social Economics, 37(5), 384-390.
Varian, H. R. (2013). Public goods and private gifts. Unpublished manuscript. downloaded at
http://people. ischool. berkeley. edu/~ hal/Papers/2013/kick. pdf.
chevron_up_icon
1 out of 14
circle_padding
hide_on_mobile
zoom_out_icon
logo.png

Your All-in-One AI-Powered Toolkit for Academic Success.

Available 24*7 on WhatsApp / Email

[object Object]