Economic Principles Analysis: BEO1105 Assignment Solution
VerifiedAdded on 2022/08/31
|11
|1199
|22
Homework Assignment
AI Summary
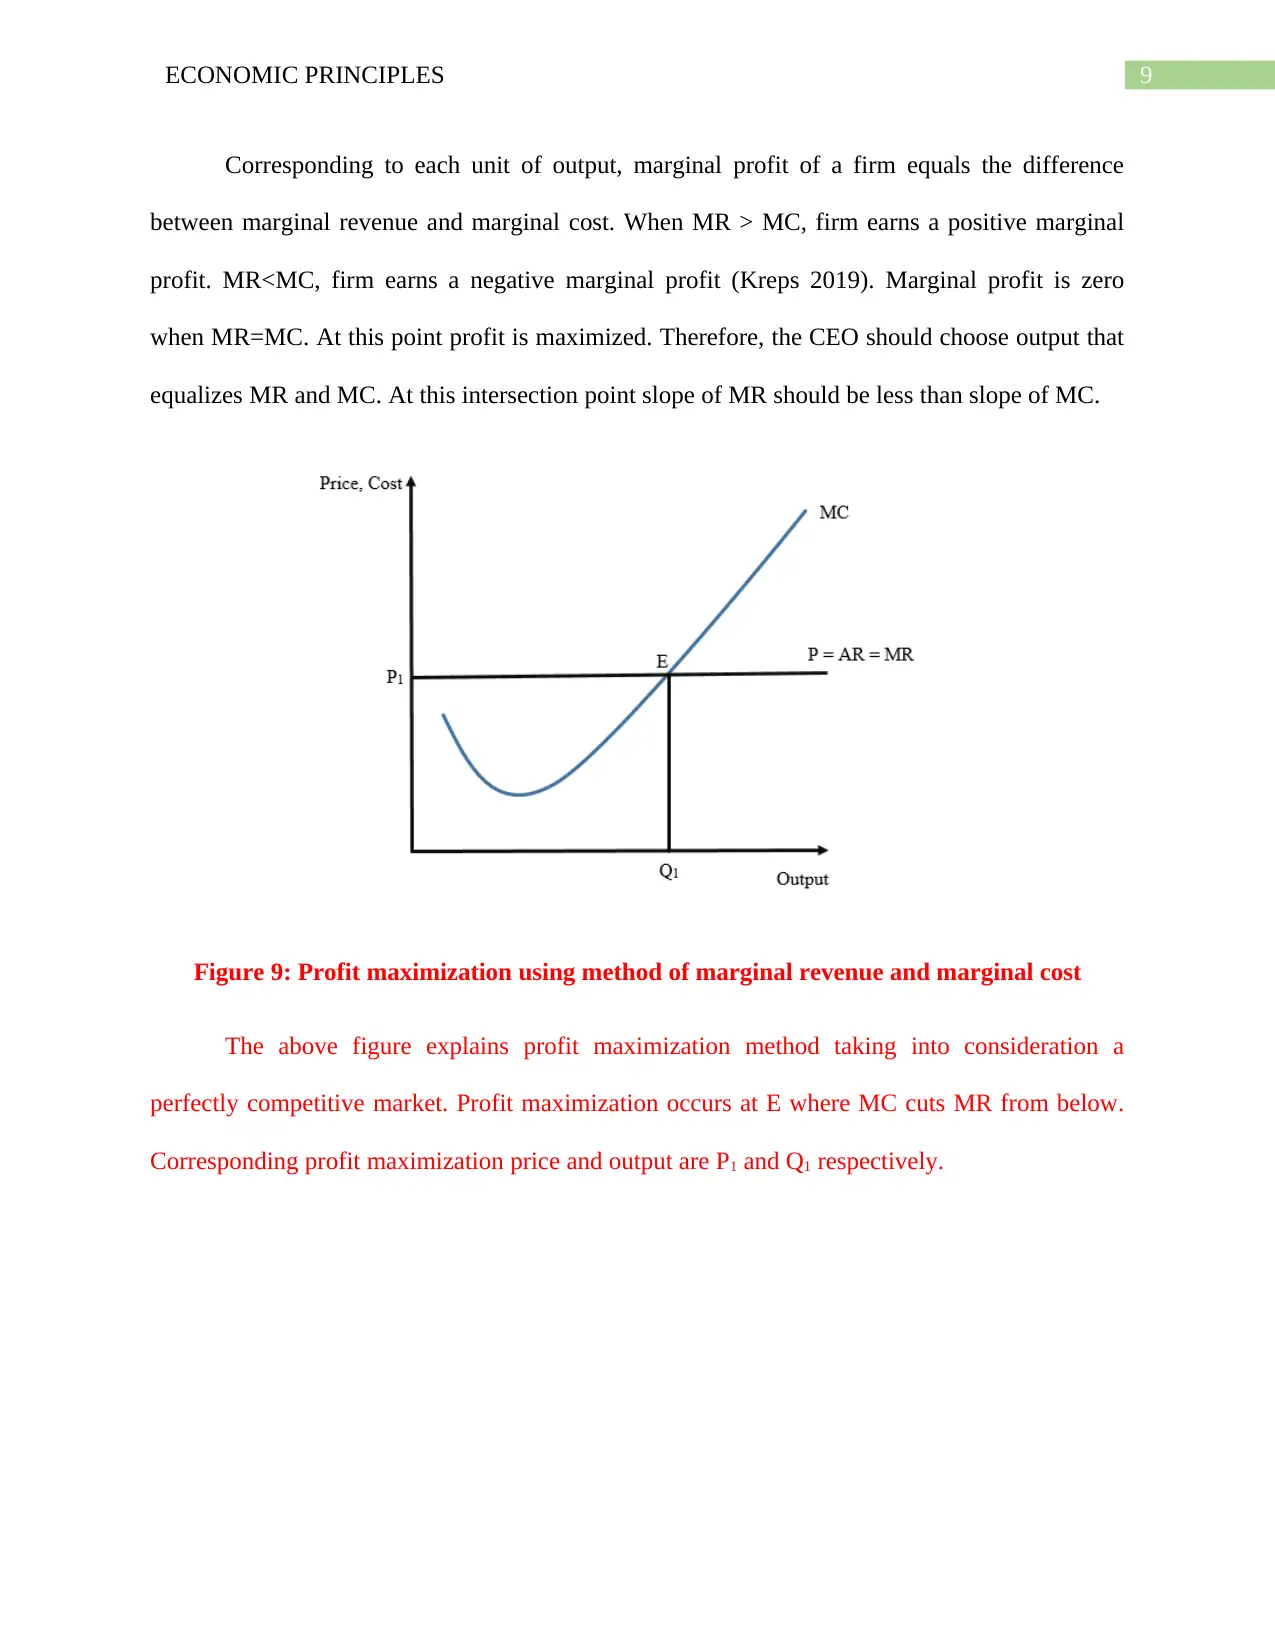
This assignment solution for an economics course (BEO1105) analyzes various economic principles and market dynamics. It addresses questions related to the impact of changes in prices of substitute goods, adoption of new technologies, and income fluctuations on the apple market, using demand and supply graphs to illustrate the market equilibrium adjustments. The solution also critiques flawed reasoning regarding demand curve shifts versus movements along the curve, specifically in the context of garlic consumption. Additionally, it examines the effects of African swine fever on the live pig market in China. The assignment further explores the concept of price elasticity of demand and its implications for revenue maximization. Finally, the solution presents and compares two methods—the total cost-total revenue method and the marginal revenue-marginal cost method—that a CEO can use to determine the profit-maximizing level of output, providing graphical representations and explanations of each method.

Running head: ECONOMIC PRINCIPLES
Economic Principles
Name of the Student
Name of the University
Course ID
Economic Principles
Name of the Student
Name of the University
Course ID
Paraphrase This Document
Need a fresh take? Get an instant paraphrase of this document with our AI Paraphraser

1ECONOMIC PRINCIPLES
Table of Contents
Question 1........................................................................................................................................2
Question 2........................................................................................................................................4
Question 3........................................................................................................................................5
Question 4........................................................................................................................................7
Question 5........................................................................................................................................8
References......................................................................................................................................11

2ECONOMIC PRINCIPLES
Question 1
a)
Figure 1: Effect of a surge in pear prices
A surge in pears’ price encourages people to purchase less pears and more apples since
apple is considered as a substitute of pear. As demand for apple increases, corresponding apples’
demand curve shifts rightward. Boost in demand with the given the supply creates a supply
shortage in the market. In order to eliminate the shortage price has be increased. Price adjusts
unless new equilibrium is attained. There is an increase in price and quantity of apples
corresponding to new equilibrium.
⊘ This is a preview!⊘
Do you want full access?
Subscribe today to unlock all pages.

Trusted by 1+ million students worldwide

3ECONOMIC PRINCIPLES
b)
Figure 2: Impact of new machines adoption
When firms adapt new machines, it contributes to an increase in apples’ supply through
increasing productivity. This moves the apple supply curve to the right. Given the demand an
increase in supply leads to a surplus in the market. For the excess supply to be sold price has be
to fall. Consequently, price of apple starts to fall. This continues unless new equilibrium is
attained balancing existing demand and new supply. The equilibrium moves from E to E1 leading
to an upsurge in equilibrium quantity and a decline in equilibrium price of apples.
c)
Figure 3: Effect of a fall in income
Paraphrase This Document
Need a fresh take? Get an instant paraphrase of this document with our AI Paraphraser

4ECONOMIC PRINCIPLES
Since apple is a normal good, a contraction of income reduces apples’ demand. This
makes an inner shift of the apple demand curve as shown in the above figure (Kreps 2019).
Lower demand with existing supply creates a condition of excess supply in the market.
Equilibrium adjusts to balance demand and supply in the market. Because of the excess supply
price starts to fall. As a result market equilibrium shifts to E2. This results in a decline in price
and quantity corresponding to new equilibrium.
Question 2
The statement confuses concept of movement along the demand curve and shift of the
demand curve. Because of the study showing eating garlic is associated with prevention of heart
disease increases demand garlic. This shifts demand curve of garlic to the right. The increased
demand increases price and quantity of garlic correspond to equilibrium. The statement that
“seeing that the price of garlic has gone up, reduce their demand for garlic resulting in a fall in
the price of garlic” is wrong because this implies higher garlic price reduces demand for garlic
causing demand curve to move left further lowering equilibrium price (McKenzie and Lee 2016).
A hike in equilibrium price through the supply curve, however does not make any change in the
demand curve rather it causes downward movement along the demand curve.
Figure 4: Market for garlic

5ECONOMIC PRINCIPLES
Question 3
The demand for live pig in China has decreases because of spread of African swine fever.
The lower demand moves the demand curve of live pigs inwards. The lower demand has a
tendency to lower equilibrium price and quantity of live pigs. There is a decline in supply of live
pigs because killing of 50 percent of live pig stock at the same time. The decline in live pig stock
shifts the supply curve inward causing equilibrium price to increase while equilibrium quantity
to decrease. Therefore, because of changing scenario for both demand and supply of live pigs,
there is two contrasting effect on price of live pigs. If demand decreases more than supply, then
equilibrium price of pigs will fall. Equilibrium price will increase if supply decreases more than
demand decrease (Cowell 2018). Price remains same if demand and supply decreases by same
magnitude. In all the cases equilibrium quantity of live pigs will decrease.
Figure 5: Demand decreases more than supply
⊘ This is a preview!⊘
Do you want full access?
Subscribe today to unlock all pages.

Trusted by 1+ million students worldwide

6ECONOMIC PRINCIPLES
Figure 6: Supply decreases more than demand
Figure 7: Same magnitude of change in demand and supply
Question 4
a)
Price elasticity of demand= Percentage change∈quantity demanded
Percentage change∈ price
Figure 6: Supply decreases more than demand
Figure 7: Same magnitude of change in demand and supply
Question 4
a)
Price elasticity of demand= Percentage change∈quantity demanded
Percentage change∈ price
Paraphrase This Document
Need a fresh take? Get an instant paraphrase of this document with our AI Paraphraser

7ECONOMIC PRINCIPLES
¿
Q2−Q1
Q1+ Q2
2
× 100
P2−P1
P1+ P2
2
× 100
¿ Q2−Q1
P2−P1
× P1+ P2
Q1+ Q2
¿ 500−475
8−10 × 10+8
475+500
¿ 25
−2 × 18
975
¿−12.5× 0.018462
¿−0.23
b)
The understanding of price elasticity of demand is imperative to maximize total revenue
of business. If demand for a product is price inelastic then business should increase price to
maximize revenue since decrease in sales volume is proportionately less than increase in price
resulting in an increase in revenue (Pindyck and Rubinfeld 2015). In case of elastic demand,
business should lower price to maximize revenue as in this case increase in sales volume because
of the decrease in price is proportionately larger than price decrease. This causes total revenue to
increase.
Question 5

8ECONOMIC PRINCIPLES
The two methods that the CEO can use to determine a profit-maximizing level of output
include Total Cost-Total Revenue method and Marginal Revenue-Marginal Cost method.
Total Cost-Total Revenue method
In order to determine output level that maximizes profit, the CEO can start by
recognizing that profit is computed by deducting total cost from total revenue. Given the total
revenue and total cost the CEO can chose the output which maximizes profit.
Figure 8: Profit maximization using method of total revenue and total cost
When total cost exceeds total revenue firm incurs a loss as shown in point A. Firm earns
only normal profit when total revenue equals total cost. Such a point is shown as B. Profit
reaches at maximum when the distance between total revenue and total cost curve is the largest.
The point corresponds to maximum profit is C.
Marginal Revenue-Marginal Cost method
⊘ This is a preview!⊘
Do you want full access?
Subscribe today to unlock all pages.

Trusted by 1+ million students worldwide

9ECONOMIC PRINCIPLES
Corresponding to each unit of output, marginal profit of a firm equals the difference
between marginal revenue and marginal cost. When MR > MC, firm earns a positive marginal
profit. MR<MC, firm earns a negative marginal profit (Kreps 2019). Marginal profit is zero
when MR=MC. At this point profit is maximized. Therefore, the CEO should choose output that
equalizes MR and MC. At this intersection point slope of MR should be less than slope of MC.
Figure 9: Profit maximization using method of marginal revenue and marginal cost
The above figure explains profit maximization method taking into consideration a
perfectly competitive market. Profit maximization occurs at E where MC cuts MR from below.
Corresponding profit maximization price and output are P1 and Q1 respectively.
Paraphrase This Document
Need a fresh take? Get an instant paraphrase of this document with our AI Paraphraser

10ECONOMIC PRINCIPLES
References
Cowell, F., 2018. Microeconomics: principles and analysis. Oxford University Press.
Kreps, D.M., 2019. Microeconomics for managers. Princeton University Press.
McKenzie, R.B. and Lee, D.R., 2016. Microeconomics for MBAs: The economic way of thinking
for managers. Cambridge University Press.
Pindyck, R.S. and Rubinfeld, D.L., 2015. Microeconomics. Boston: Pearson,.
1 out of 11
Related Documents

Your All-in-One AI-Powered Toolkit for Academic Success.
+13062052269
info@desklib.com
Available 24*7 on WhatsApp / Email
Unlock your academic potential
Copyright © 2020–2025 A2Z Services. All Rights Reserved. Developed and managed by ZUCOL.