University Economics Assignment: Economic Principles Analysis
VerifiedAdded on 2020/03/04
|14
|1500
|382
Homework Assignment
AI Summary
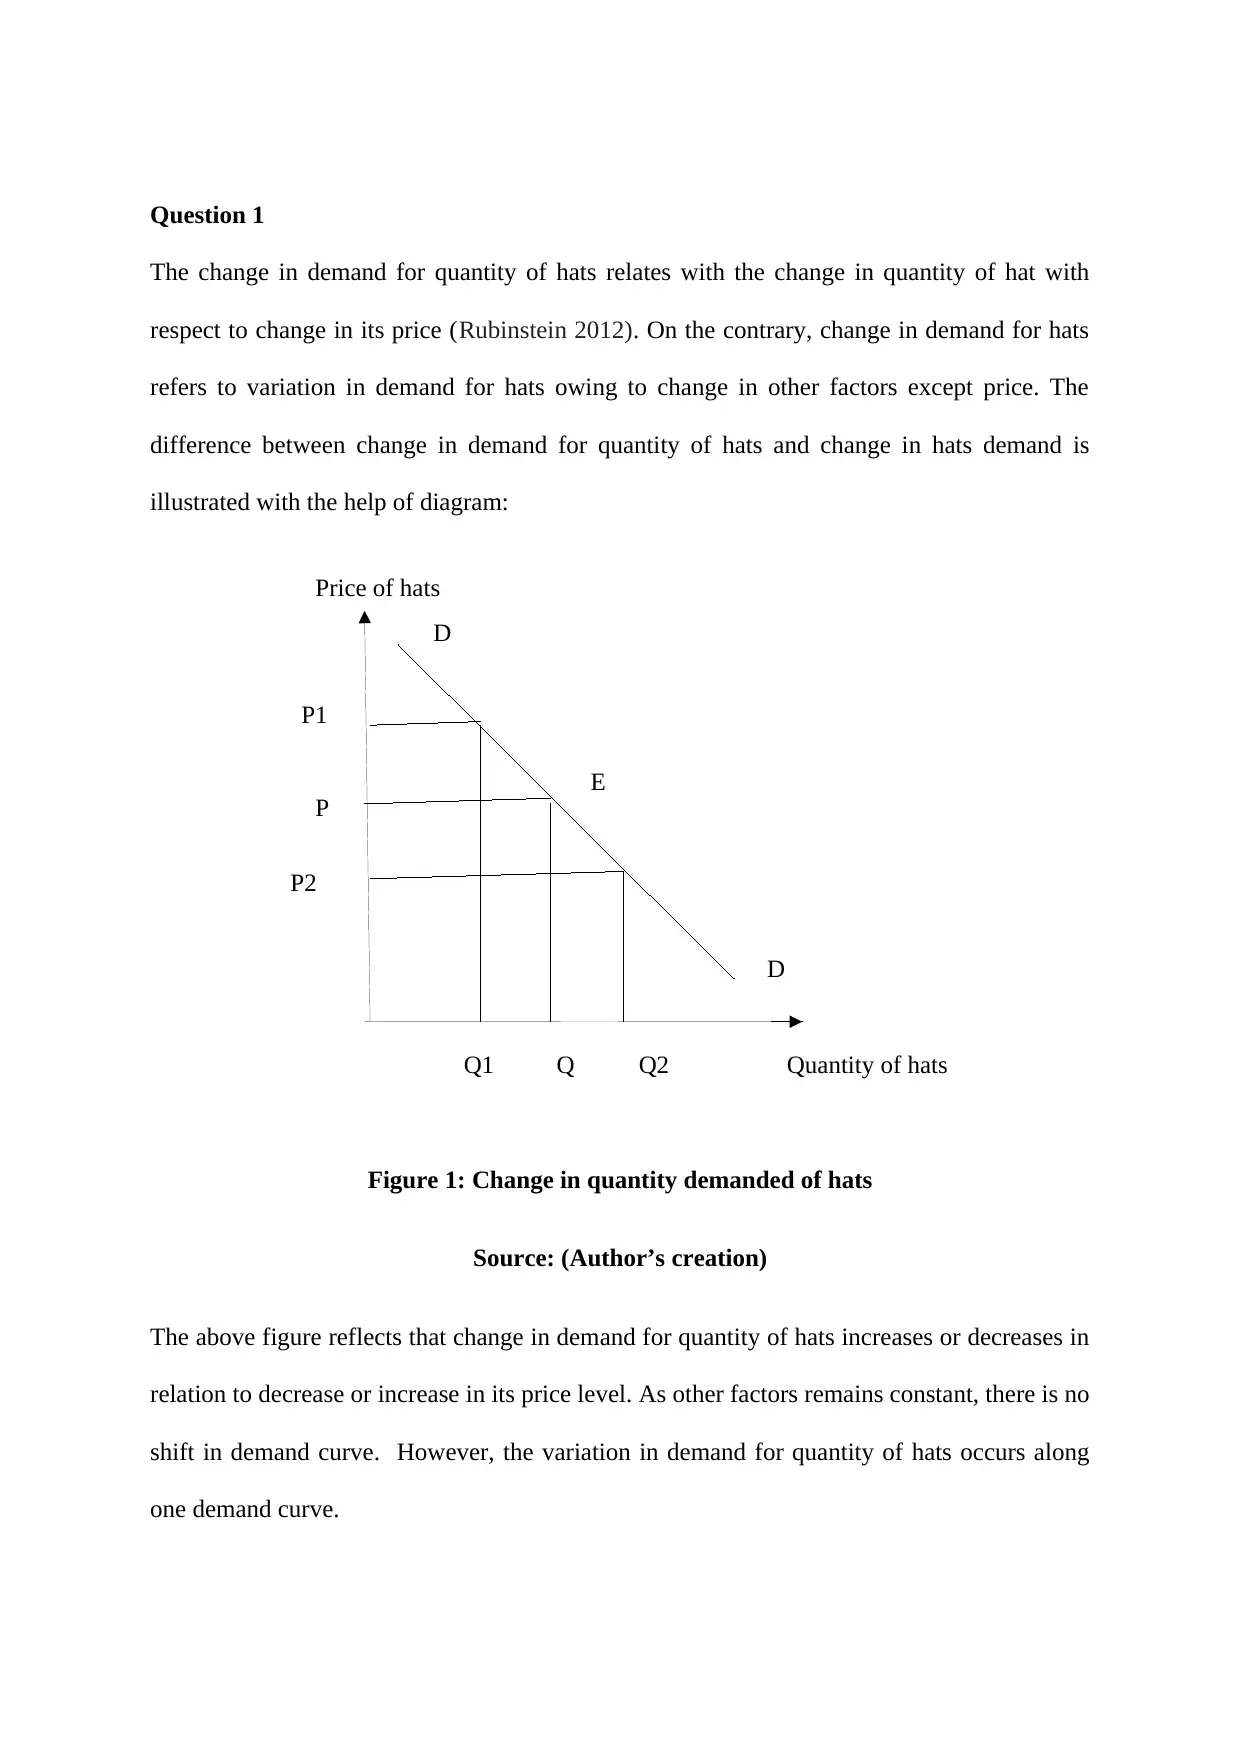
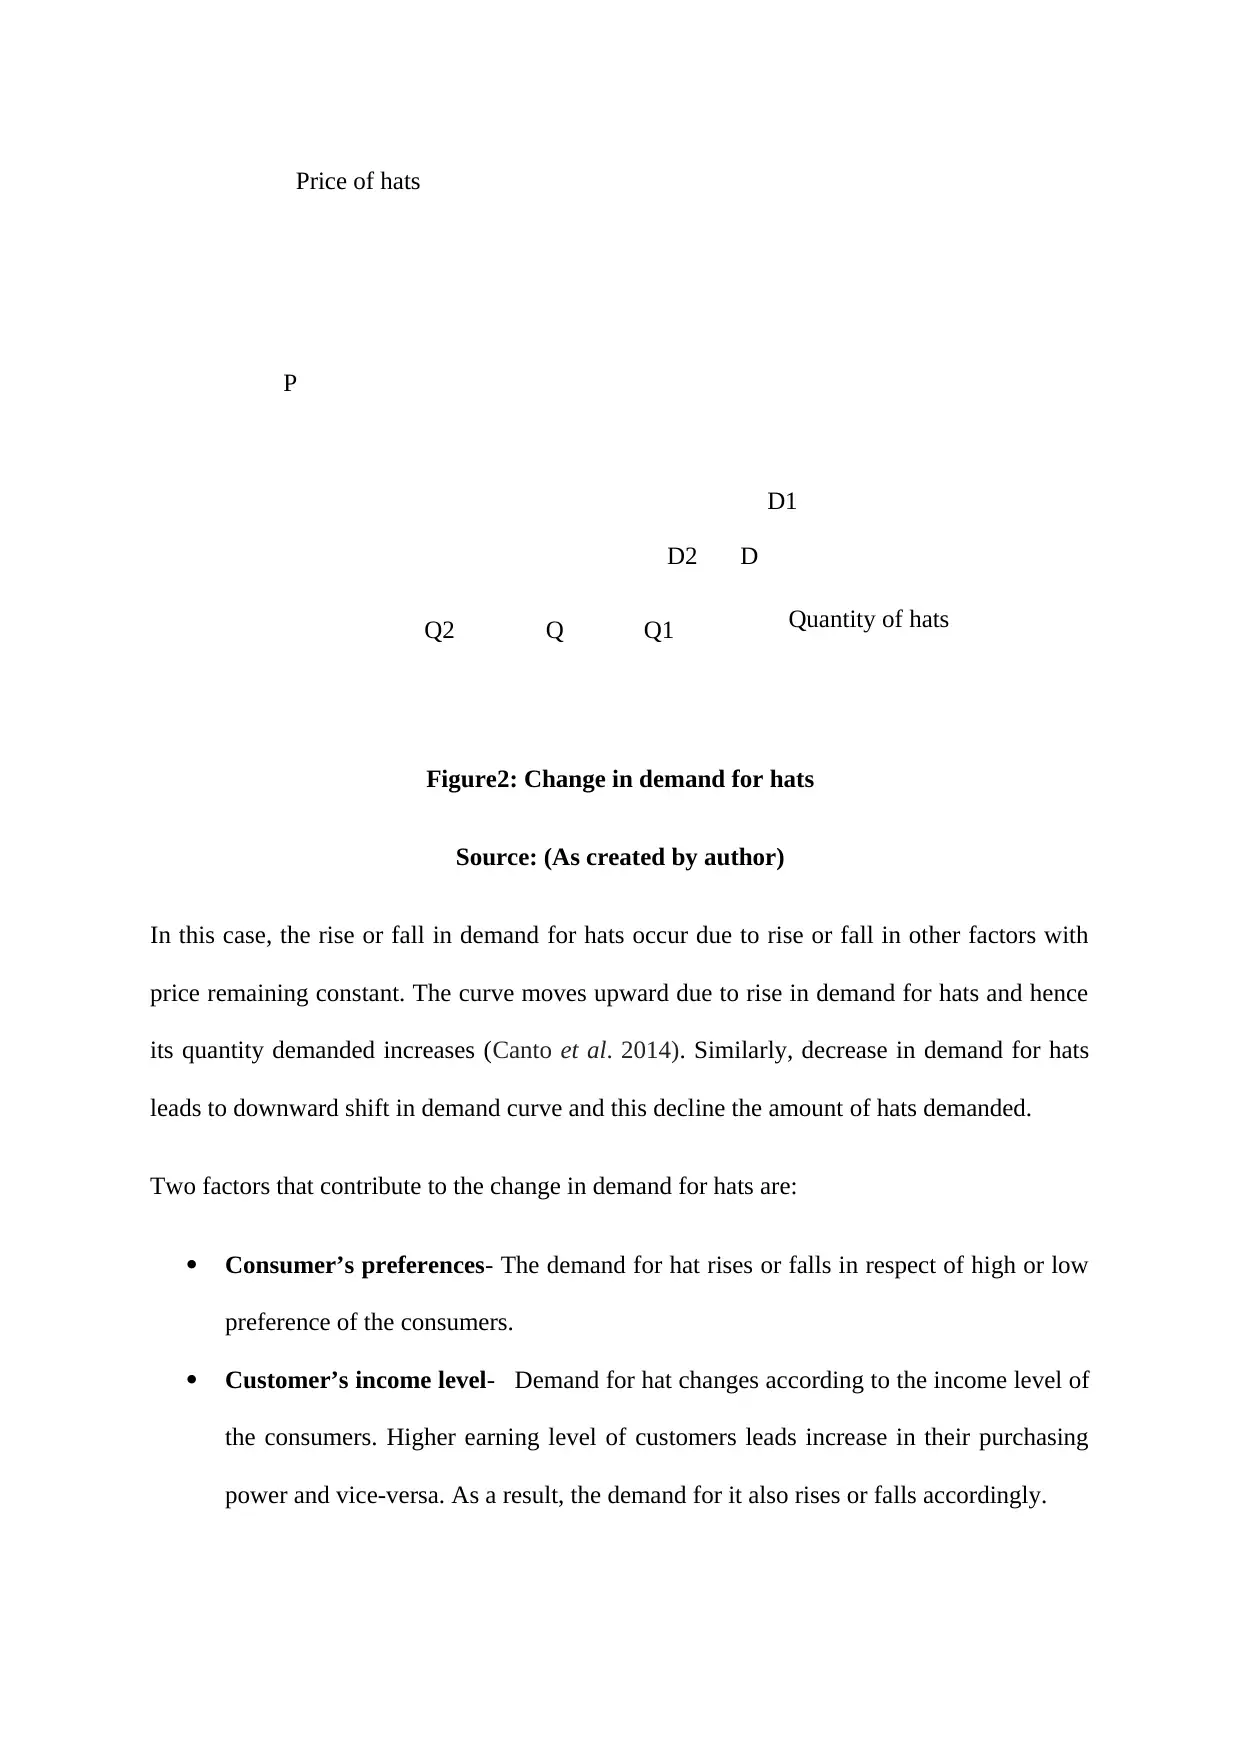
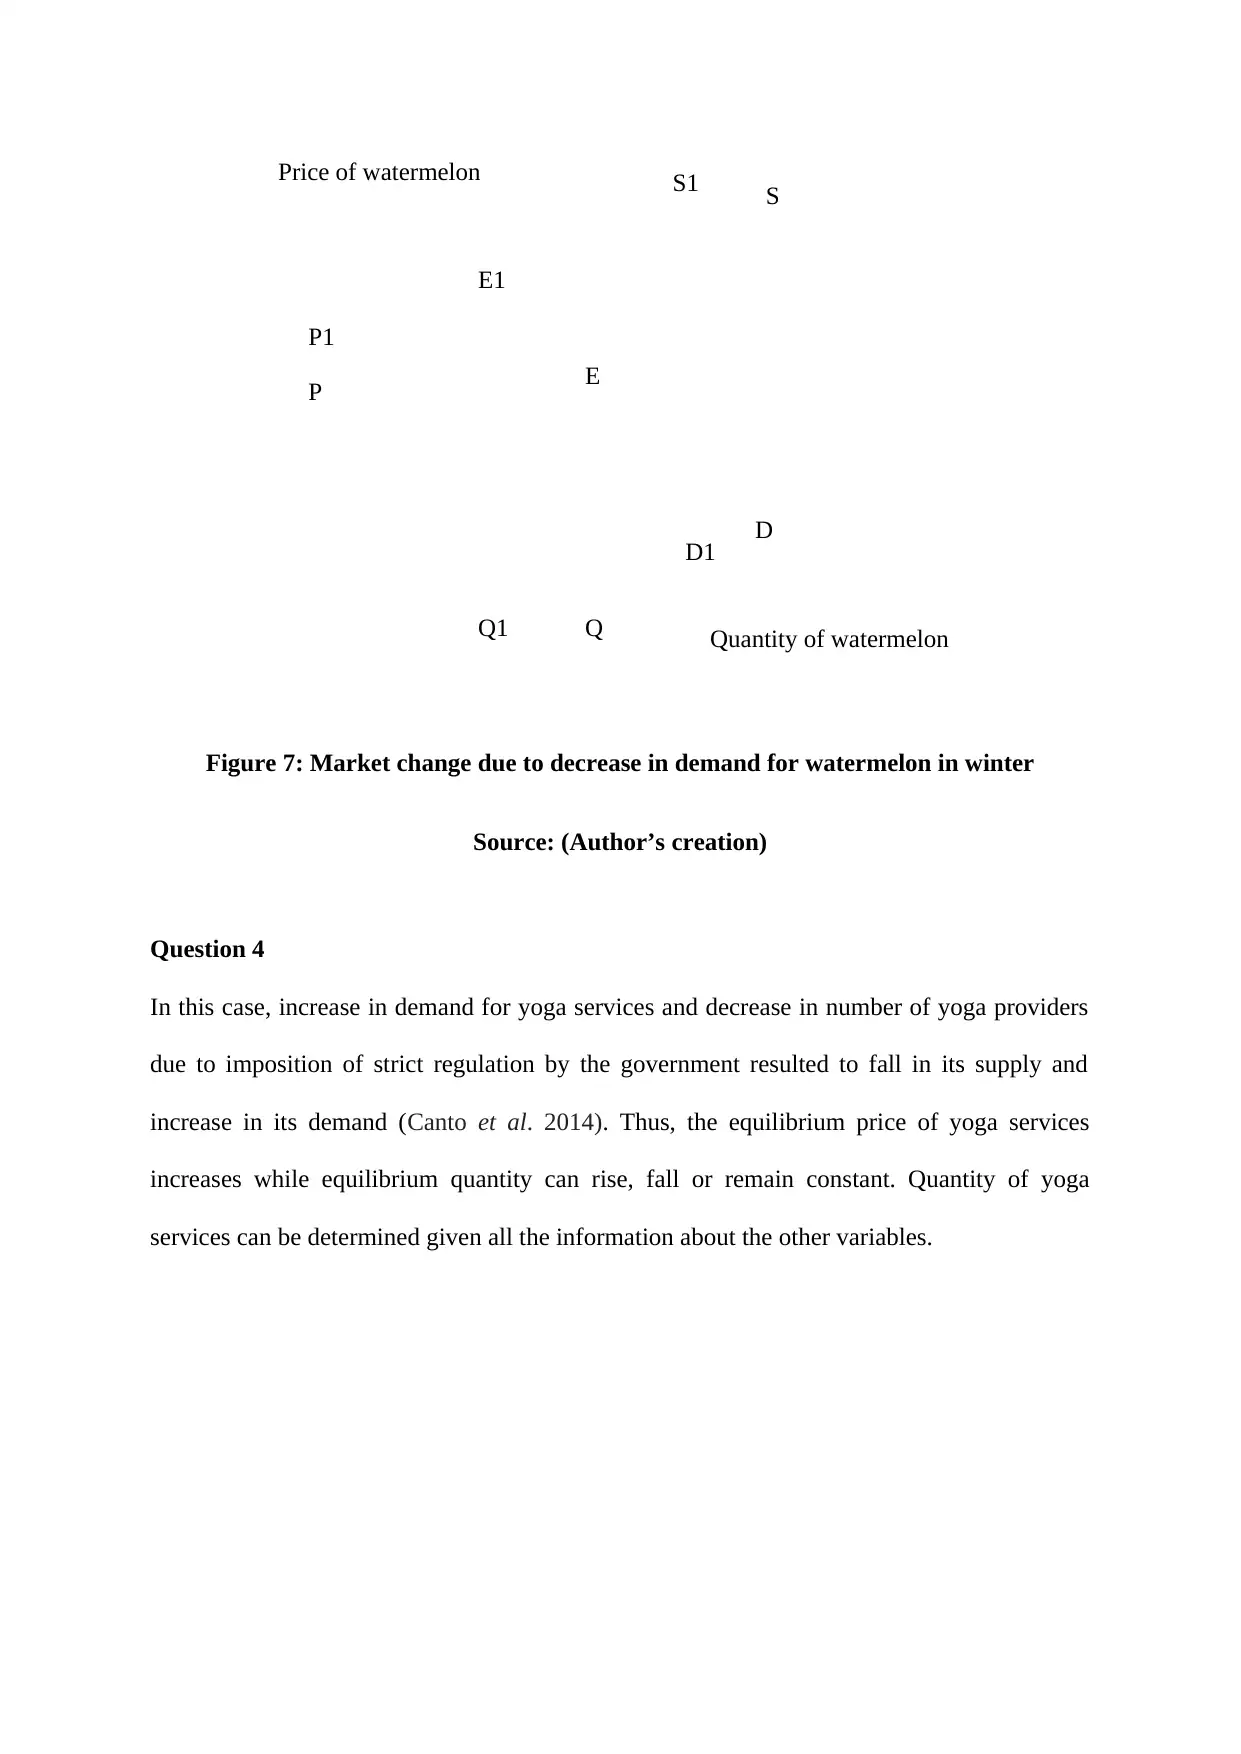
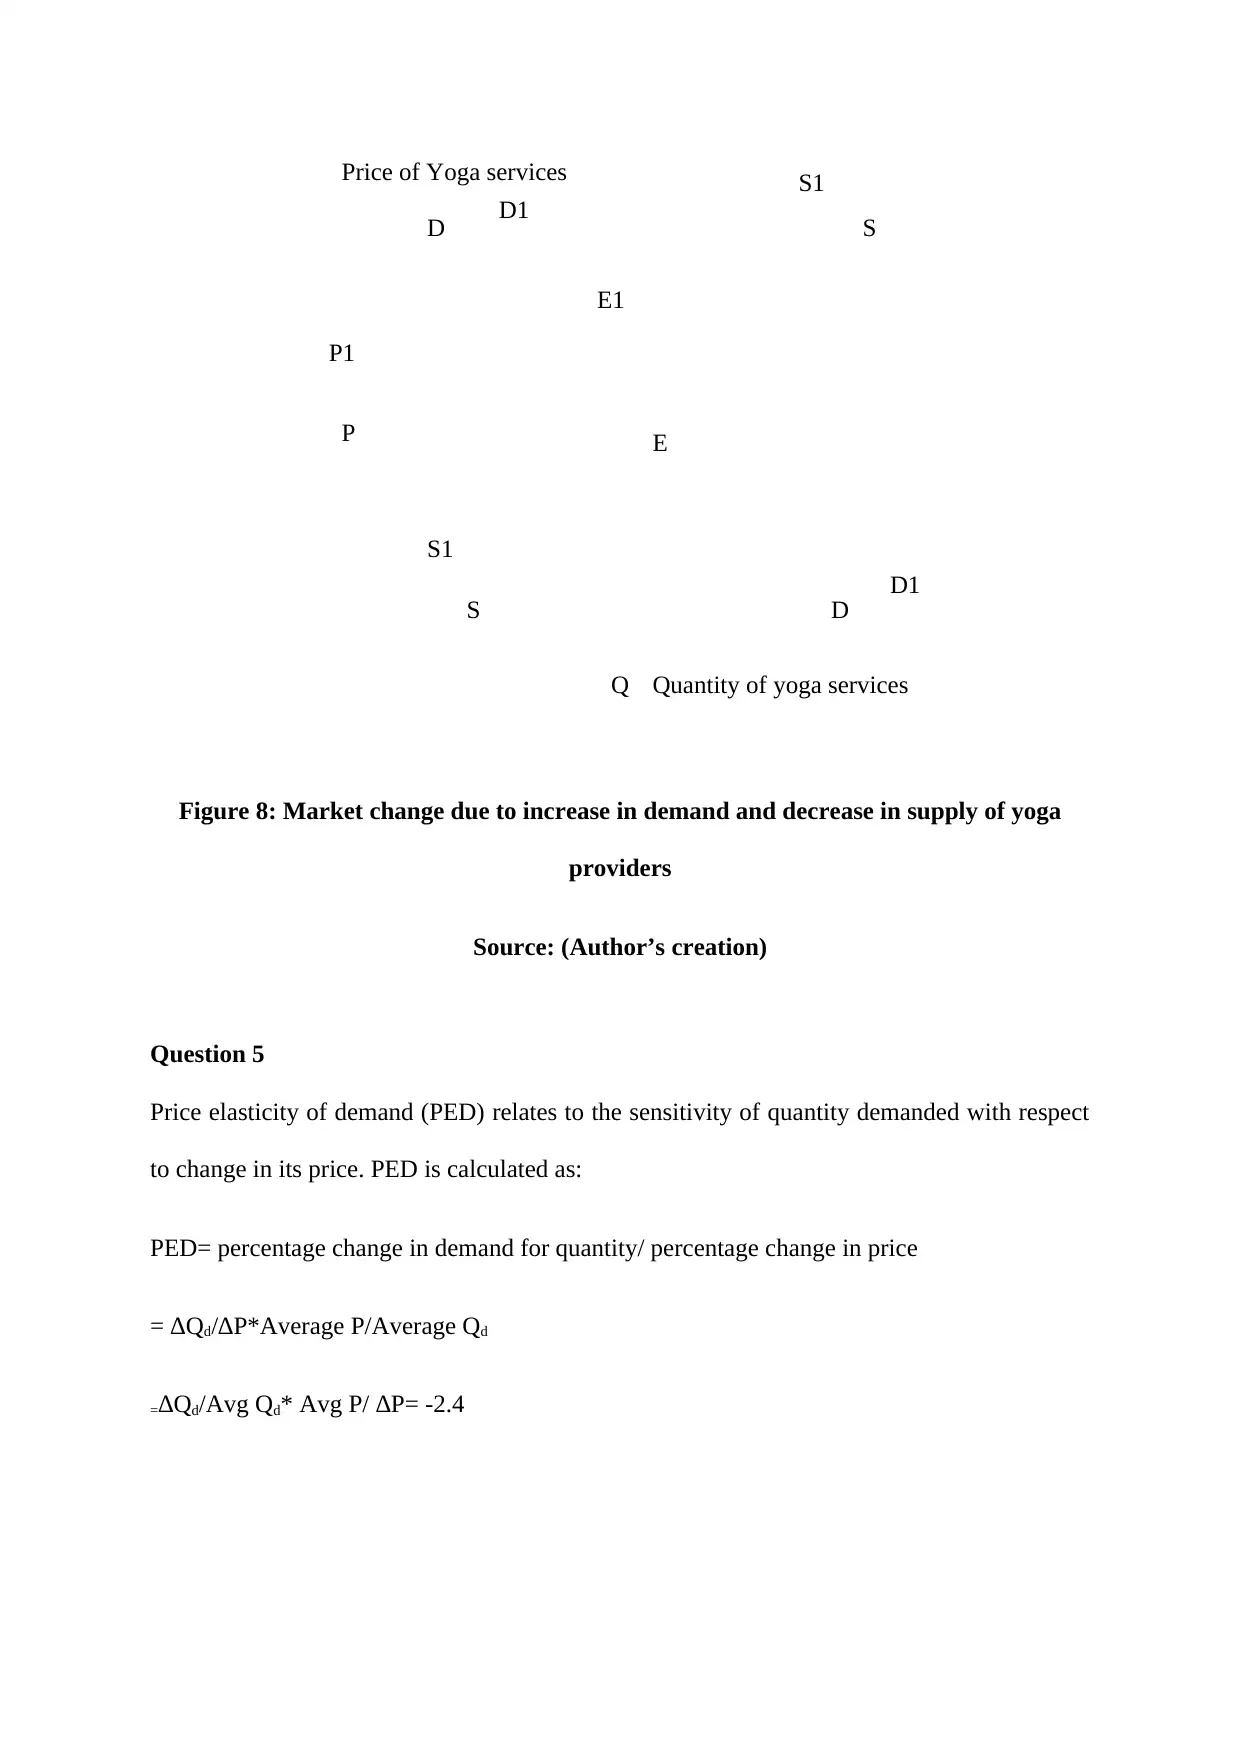
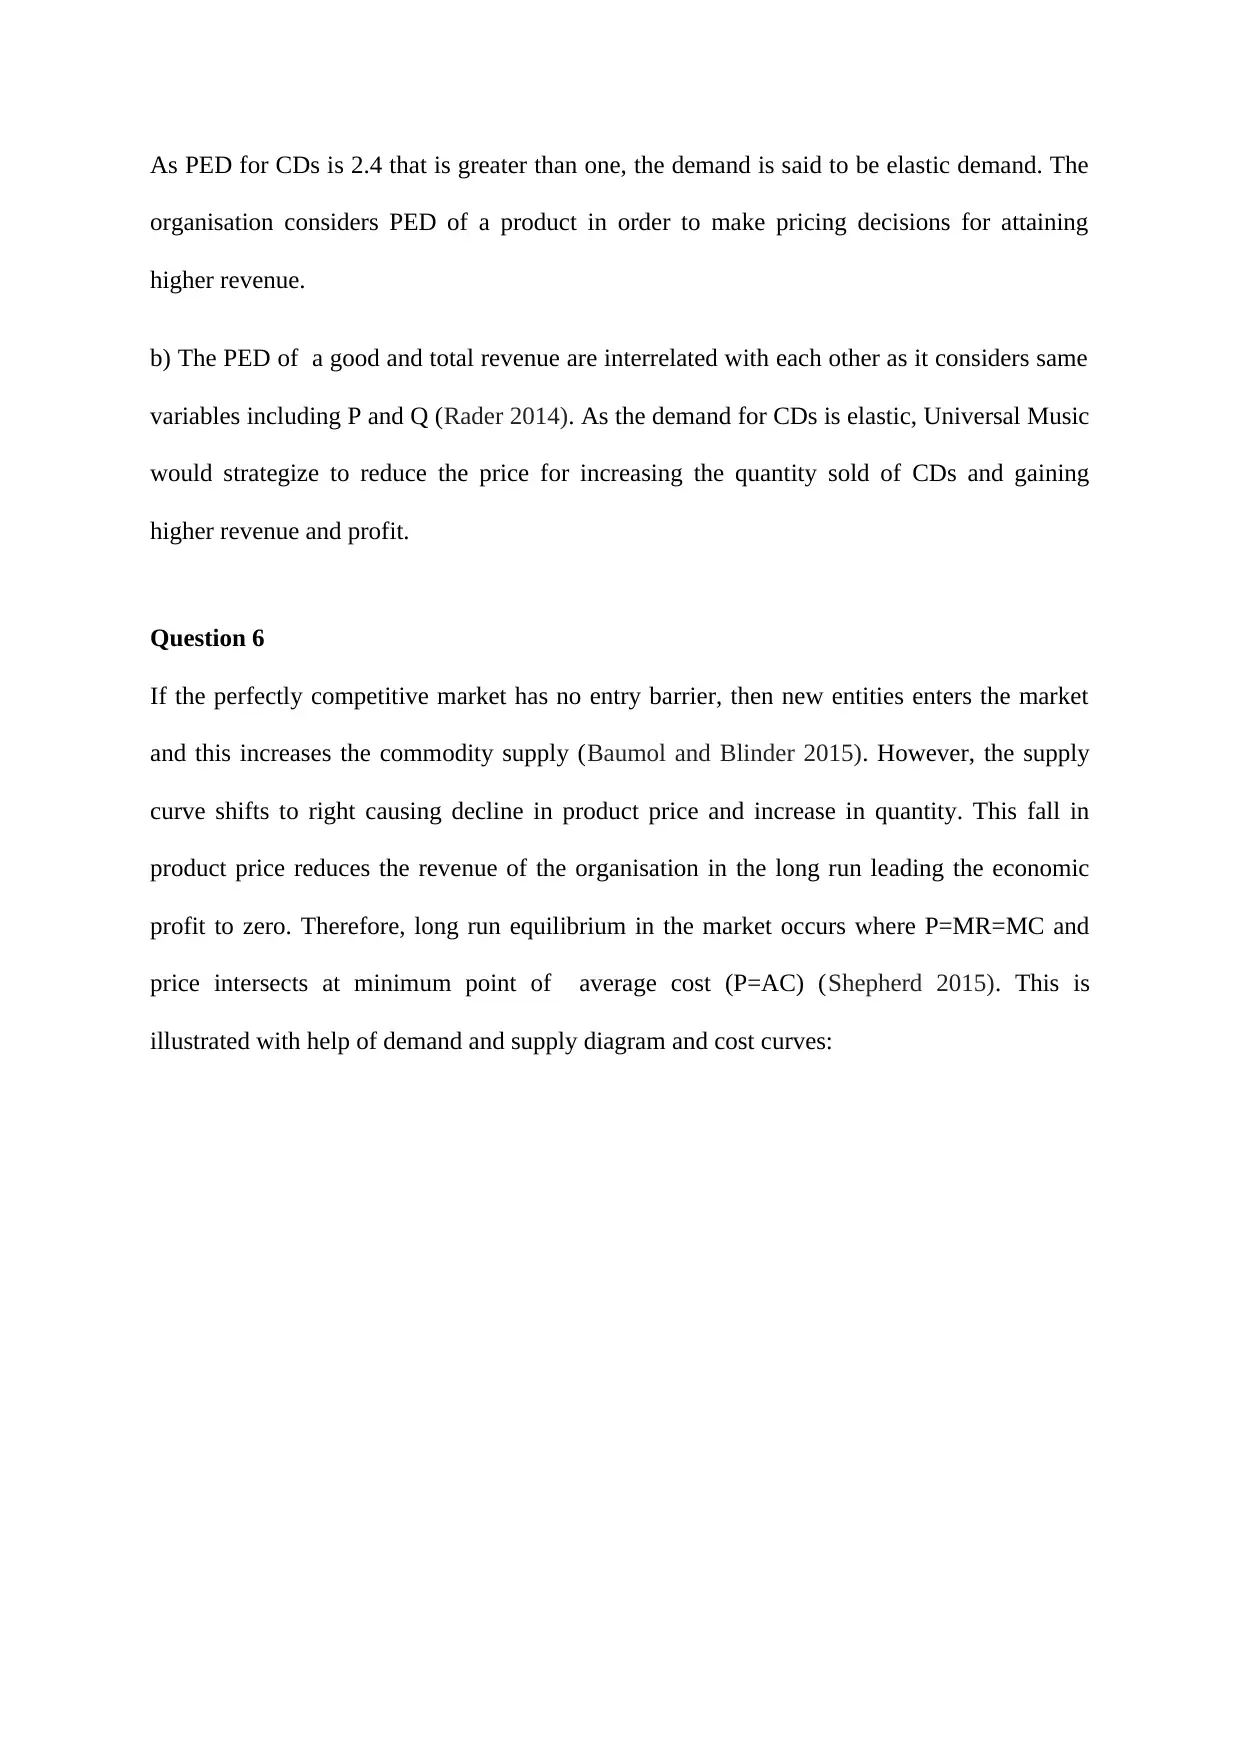
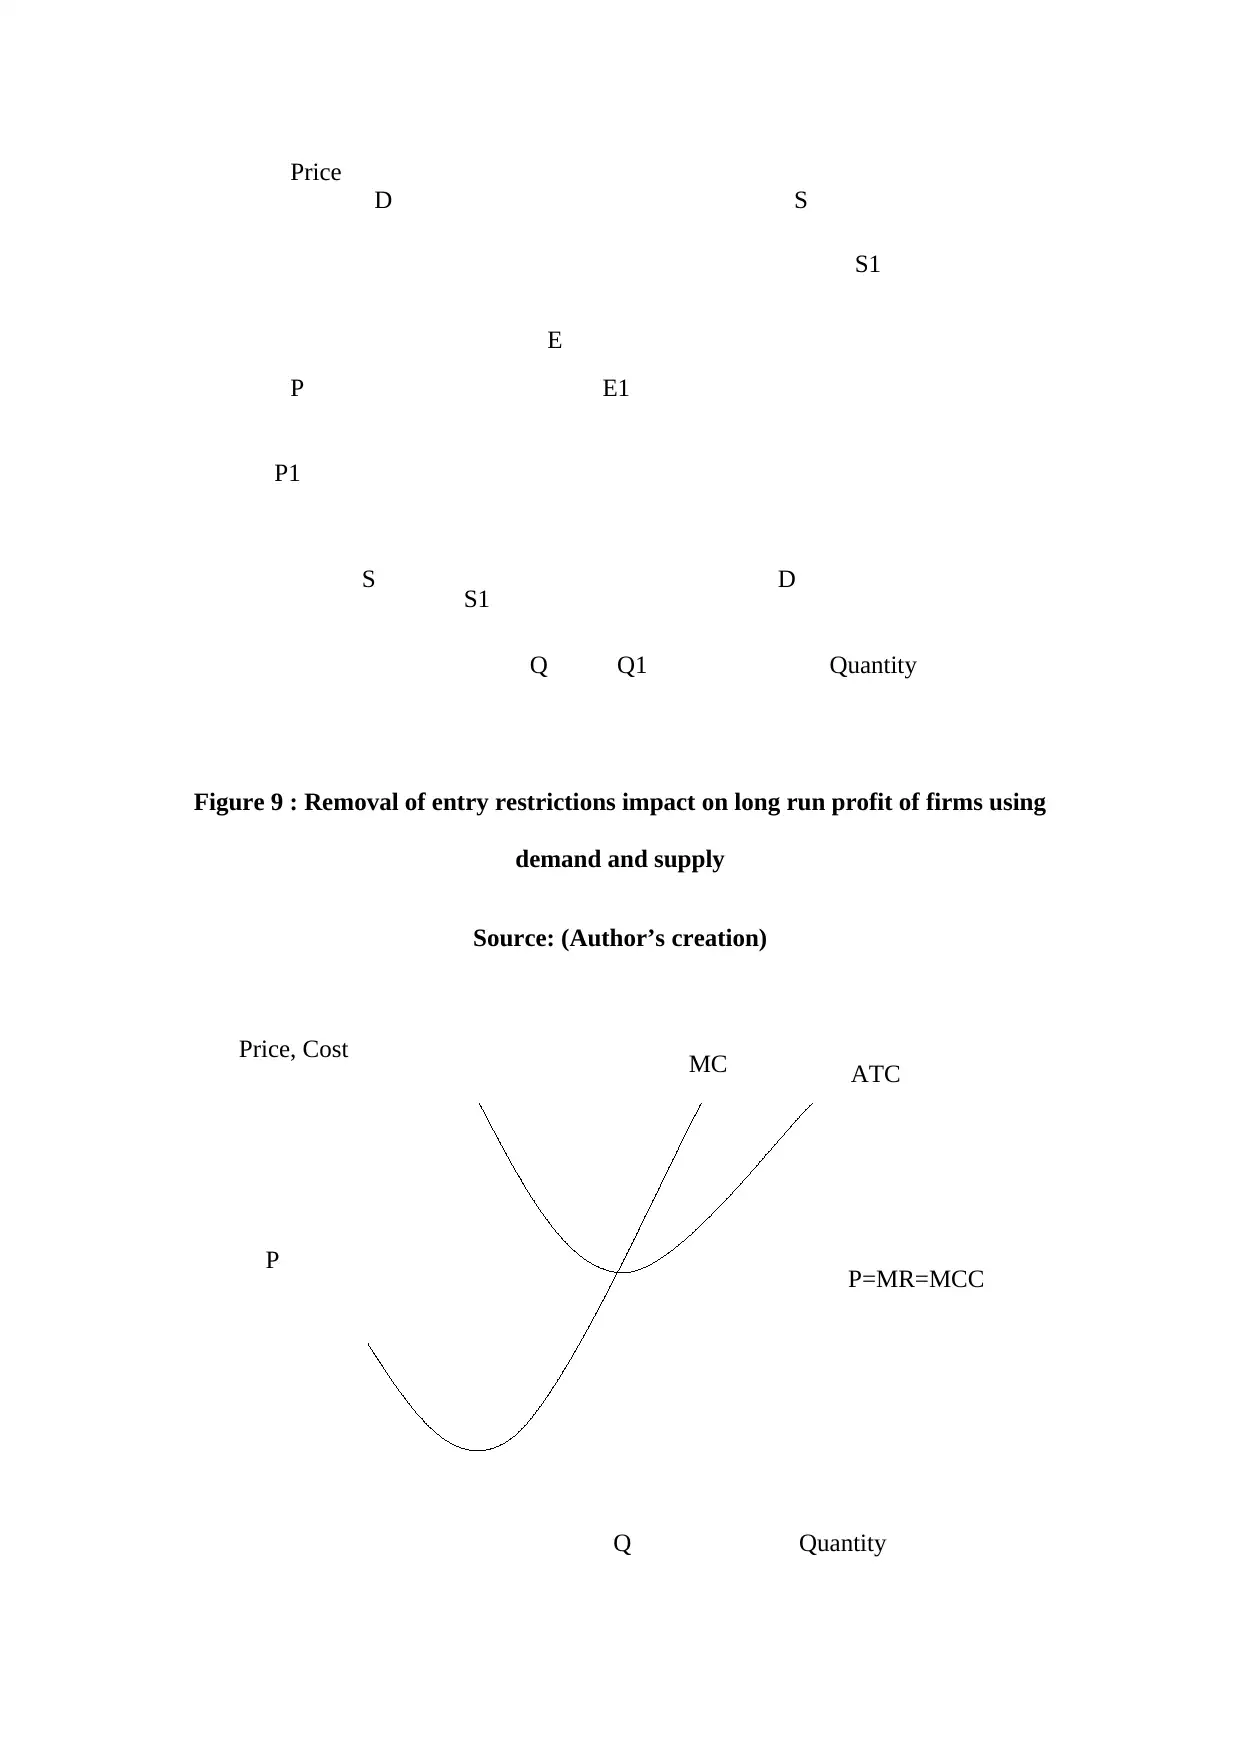
This economics assignment delves into fundamental economic principles, offering a comprehensive analysis of various concepts. It begins by differentiating between changes in quantity demanded versus changes in demand, illustrating these concepts with diagrams and exploring factors influencing demand, such as consumer preferences and income levels. The assignment then examines market equilibrium, analyzing the impact of price changes on supply and demand, and exploring how substitute goods and changes in the number of producers affect market dynamics. Further, it investigates the effects of seasonal demand variations on price and quantity, using the example of watermelons. The assignment also considers the impact of supply and demand shifts on the yoga services market due to regulation changes. Finally, it calculates and interprets price elasticity of demand (PED), relating it to total revenue considerations, and analyzes the long-run equilibrium in a perfectly competitive market with no entry barriers, using both demand-supply and cost curve diagrams. The solution incorporates various figures to explain the concepts. References for all sources are also included.

Running head: ECONOMIC PRINCIPLES
ECONOMIC PRINCIPLES
Name of the student
Name of the University
Author’s Note
ECONOMIC PRINCIPLES
Name of the student
Name of the University
Author’s Note
Paraphrase This Document
Need a fresh take? Get an instant paraphrase of this document with our AI Paraphraser

Table of Contents
Question 1..................................................................................................................................2
Question 2..................................................................................................................................4
Question 3..................................................................................................................................6
Question 4..................................................................................................................................8
Question 5..................................................................................................................................9
Question 6................................................................................................................................10
References................................................................................................................................13

Price of hats
Quantity of hats
D
D
P
E
Q
P1
P2
Q1 Q2
Question 1
The change in demand for quantity of hats relates with the change in quantity of hat with
respect to change in its price (Rubinstein 2012). On the contrary, change in demand for hats
refers to variation in demand for hats owing to change in other factors except price. The
difference between change in demand for quantity of hats and change in hats demand is
illustrated with the help of diagram:
Figure 1: Change in quantity demanded of hats
Source: (Author’s creation)
The above figure reflects that change in demand for quantity of hats increases or decreases in
relation to decrease or increase in its price level. As other factors remains constant, there is no
shift in demand curve. However, the variation in demand for quantity of hats occurs along
one demand curve.
⊘ This is a preview!⊘
Do you want full access?
Subscribe today to unlock all pages.

Trusted by 1+ million students worldwide

Quantity of hats
Price of hats
D1
DD2
Q Q1Q2
P
Figure2: Change in demand for hats
Source: (As created by author)
In this case, the rise or fall in demand for hats occur due to rise or fall in other factors with
price remaining constant. The curve moves upward due to rise in demand for hats and hence
its quantity demanded increases (Canto et al. 2014). Similarly, decrease in demand for hats
leads to downward shift in demand curve and this decline the amount of hats demanded.
Two factors that contribute to the change in demand for hats are:
Consumer’s preferences- The demand for hat rises or falls in respect of high or low
preference of the consumers.
Customer’s income level- Demand for hat changes according to the income level of
the consumers. Higher earning level of customers leads increase in their purchasing
power and vice-versa. As a result, the demand for it also rises or falls accordingly.
Paraphrase This Document
Need a fresh take? Get an instant paraphrase of this document with our AI Paraphraser

D
S
D
S
P
Q
P1
Q1
E
Excess Supply
Question 2
a) Change in price of a product largely impacts on its market. Market equilibrium always
occurs when the demand and supply curve of a commodity interconnects with each
other. However, the equilibrium price and quantity is determined corresponding to
this equilibrium point (Wetzstein 2013). In this case, as the price of solar panel rise
above the equilibrium price (P), the supply of solar panel becomes greater than its
demand. Therefore, excess supply occurs but the demand for it lowers. The figure
below explains the above case:
Figure 3: Impact on market due to rise in price of solar panel.
Source: (As created by author)
b) As electricity and solar panels are substitute goods, decrease in electricity price of an
average household by 50% leads to fall in quantity demanded of solar panels. This is
because both the commodities are substituted in order to satisfy the consumer’s wants
(Hall and Lieberman 2012). This is shown in figure below:
Q2
S
D
S
P
Q
P1
Q1
E
Excess Supply
Question 2
a) Change in price of a product largely impacts on its market. Market equilibrium always
occurs when the demand and supply curve of a commodity interconnects with each
other. However, the equilibrium price and quantity is determined corresponding to
this equilibrium point (Wetzstein 2013). In this case, as the price of solar panel rise
above the equilibrium price (P), the supply of solar panel becomes greater than its
demand. Therefore, excess supply occurs but the demand for it lowers. The figure
below explains the above case:
Figure 3: Impact on market due to rise in price of solar panel.
Source: (As created by author)
b) As electricity and solar panels are substitute goods, decrease in electricity price of an
average household by 50% leads to fall in quantity demanded of solar panels. This is
because both the commodities are substituted in order to satisfy the consumer’s wants
(Hall and Lieberman 2012). This is shown in figure below:
Q2

Quantity of solar panels
Price of electricity
S
S D
D
D1
D1
P
QQ1
P11
Figure 4: Change in quantity demanded of solar panels due to fall in electricity
price
Source: (As created by author)
c) As the number of solar panel producers rises by 50%, its supply rises automatically.
However, rise in amount of solar panel leads to fall in its price. The is shown in
diagram below:
⊘ This is a preview!⊘
Do you want full access?
Subscribe today to unlock all pages.

Trusted by 1+ million students worldwide

S
S1
D
P
P1
Q Q1
D
S
S
Quantity of solar panels
Price of solar panels
Figure 5: Market adjustment due to increase in supply of solar panels
Source: (Author’s creation)
Question 3
Although demand for watermelon increases in summer, its price falls because increase in
supply of watermelon is higher than increase in its demand (Rios et al. 2013). However, the
new equilibrium point occurs at E1 and the corresponding equilibrium price and quantity is
P1 and Q1 respectively.
Paraphrase This Document
Need a fresh take? Get an instant paraphrase of this document with our AI Paraphraser

D D1 S
S1
E
E1
P
Q
P1
Q1 Quantity of watermelon
Price of Watermelon
Figure 6: Market change due to increase in demand for watermelon in summer
Source: (Author’s creation)
On the contrary, as the demand for watermelon decreases in winter, its price increases
because the decrease in supply of watermelon is larger than decline in its demand. Hence, the
new equilibrium quantity is Q1and its corresponding price is P1.

D1 D
S
S1
E
E1
P
Q
P1
Q1 Quantity of watermelon
Price of watermelon
Figure 7: Market change due to decrease in demand for watermelon in winter
Source: (Author’s creation)
Question 4
In this case, increase in demand for yoga services and decrease in number of yoga providers
due to imposition of strict regulation by the government resulted to fall in its supply and
increase in its demand (Canto et al. 2014). Thus, the equilibrium price of yoga services
increases while equilibrium quantity can rise, fall or remain constant. Quantity of yoga
services can be determined given all the information about the other variables.
⊘ This is a preview!⊘
Do you want full access?
Subscribe today to unlock all pages.

Trusted by 1+ million students worldwide

Quantity of yoga services
Price of Yoga services
S
S
D
D
D1
D1
S1
S1
Q
P
P1
E
E1
Figure 8: Market change due to increase in demand and decrease in supply of yoga
providers
Source: (Author’s creation)
Question 5
Price elasticity of demand (PED) relates to the sensitivity of quantity demanded with respect
to change in its price. PED is calculated as:
PED= percentage change in demand for quantity/ percentage change in price
= ∆Qd/∆P*Average P/Average Qd
=∆Qd/Avg Qd* Avg P/ ∆P= -2.4
Paraphrase This Document
Need a fresh take? Get an instant paraphrase of this document with our AI Paraphraser

As PED for CDs is 2.4 that is greater than one, the demand is said to be elastic demand. The
organisation considers PED of a product in order to make pricing decisions for attaining
higher revenue.
b) The PED of a good and total revenue are interrelated with each other as it considers same
variables including P and Q (Rader 2014). As the demand for CDs is elastic, Universal Music
would strategize to reduce the price for increasing the quantity sold of CDs and gaining
higher revenue and profit.
Question 6
If the perfectly competitive market has no entry barrier, then new entities enters the market
and this increases the commodity supply (Baumol and Blinder 2015). However, the supply
curve shifts to right causing decline in product price and increase in quantity. This fall in
product price reduces the revenue of the organisation in the long run leading the economic
profit to zero. Therefore, long run equilibrium in the market occurs where P=MR=MC and
price intersects at minimum point of average cost (P=AC) (Shepherd 2015). This is
illustrated with help of demand and supply diagram and cost curves:

D
D S
S1
S S1
P
P1
Q Q1 Quantity
Price
E
E1
Quantity
Price, Cost
P=MR=MCC
P
ATCMC
Q
Figure 9 : Removal of entry restrictions impact on long run profit of firms using
demand and supply
Source: (Author’s creation)
D S
S1
S S1
P
P1
Q Q1 Quantity
Price
E
E1
Quantity
Price, Cost
P=MR=MCC
P
ATCMC
Q
Figure 9 : Removal of entry restrictions impact on long run profit of firms using
demand and supply
Source: (Author’s creation)
⊘ This is a preview!⊘
Do you want full access?
Subscribe today to unlock all pages.

Trusted by 1+ million students worldwide
1 out of 14
Related Documents

Your All-in-One AI-Powered Toolkit for Academic Success.
+13062052269
info@desklib.com
Available 24*7 on WhatsApp / Email
Unlock your academic potential
Copyright © 2020–2025 A2Z Services. All Rights Reserved. Developed and managed by ZUCOL.