Economic Principles and Decision Making: Atollia Market Analysis
VerifiedAdded on 2021/05/31
|16
|3156
|174
Report
AI Summary
This report provides an economic analysis of the Atollia market, focusing on the factors influencing demand for a new energy bar product. The analysis begins with an executive summary and introduction, followed by a detailed examination of the impact of income, inflation, and tariff rates on demand. The report utilizes regression analysis to model the relationship between these economic variables and demand, finding that income has a positive impact, while tariff and inflation have negative impacts. The report also explores fundamental economic theories such as supply and demand, aggregate supply and demand, the Phillips curve, and the Laffer curve to further understand the market dynamics. The findings suggest that the Atollia market has potential for the energy bar, but increasing tariff rates and inflation could negatively affect sales. The report concludes with recommendations for the company and a reference list.
Running Head: ECONOMIC PRINCIPLES AND DECISION MAKING
Economic Principles and Decision Making
Name of the Student
Name of the University
Course ID
Economic Principles and Decision Making
Name of the Student
Name of the University
Course ID
Paraphrase This Document
Need a fresh take? Get an instant paraphrase of this document with our AI Paraphraser
1ECONOMIC PRINCIPLES AND DECISION MAKING
Executive Summary
Business often considers business expansion in a new location. The location choice depends on
the favorable economic and business condition of the concerned location. Schmeckt Gut has
initiated a plan to launch its Besser energy bar in the Atollia market. The company is concern
about the expected sales in the new market. Prior to make an entry in Atollia market, demand
needs to be estimated. For this, market research is conducted to obtain information on income,
tariff, inflation and number of gyms. The demand for energy is modeled with three variables;
income, inflation and tariff rate. Income has a positive association with demand while tariff and
inflation has an inverse relation with demand.
2ECONOMIC PRINCIPLES AND DECISION MAKING
Table of Contents
Introduction......................................................................................................................................3
Matching projection on income, inflation and tariff rate.................................................................3
Supply and demand......................................................................................................................4
Model of aggregate supply and aggregate demand.....................................................................6
Phillips Curve..............................................................................................................................7
Laffer curve.................................................................................................................................8
Evaluation of potential impact of income, inflation and tariff on demand....................................10
Recommendation...........................................................................................................................12
Conclusion.....................................................................................................................................12
Reference list.................................................................................................................................14
⊘ This is a preview!⊘
Do you want full access?
Subscribe today to unlock all pages.
Trusted by 1+ million students worldwide
3ECONOMIC PRINCIPLES AND DECISION MAKING
Introduction
Different economic variables play an important in decision making process of a business.
Depending in the underlying economic scenario, the organization makes their location decision.
Volume of sales depend on the demand of the concerned product. In demand estimation, a
number factors are taken into consideration. The main factor determining purchasing power and
hence demand is income. In context of a nation, national income used as a measure to find
aggregate demand. The fluctuation in income or demand influence price level of the economy.
Inflation rate captures the trend in the movement of price level (Dullien et al, 2017). In case of
goods imported from outside a nation, the demand is also influenced by imposed tariff on import
tariff. The paper is intended to make a projection regarding change in these economic variables
on demand of the energy bar in the Atollia market. The information is important for Schmeckt
Gut that plans to introduce Besser energy bar the Atollia market within few months.
A market research is conducted on Atollia market. The findings of market research with
the aid of economic theories are used to analyze the likely impact of changes in income, inflation
and tariff on demand. The analysis aims to provide some useful insight to the company before
launching the energy bar in Atollia market.
Evaluation of potential impact of income, inflation and tariff on demand
A projected increase in income comes with a projected increase in import tariff and
inflation. In order to model the relation of demand for energy bars with income, inflation and
tariff rate a multiple regression analysis is conducted (Keith, 2014). In the regression model
demand is taken as the dependent variable and income, inflation and tariff rate is taken as
independent variables.
Paraphrase This Document
Need a fresh take? Get an instant paraphrase of this document with our AI Paraphraser
4ECONOMIC PRINCIPLES AND DECISION MAKING
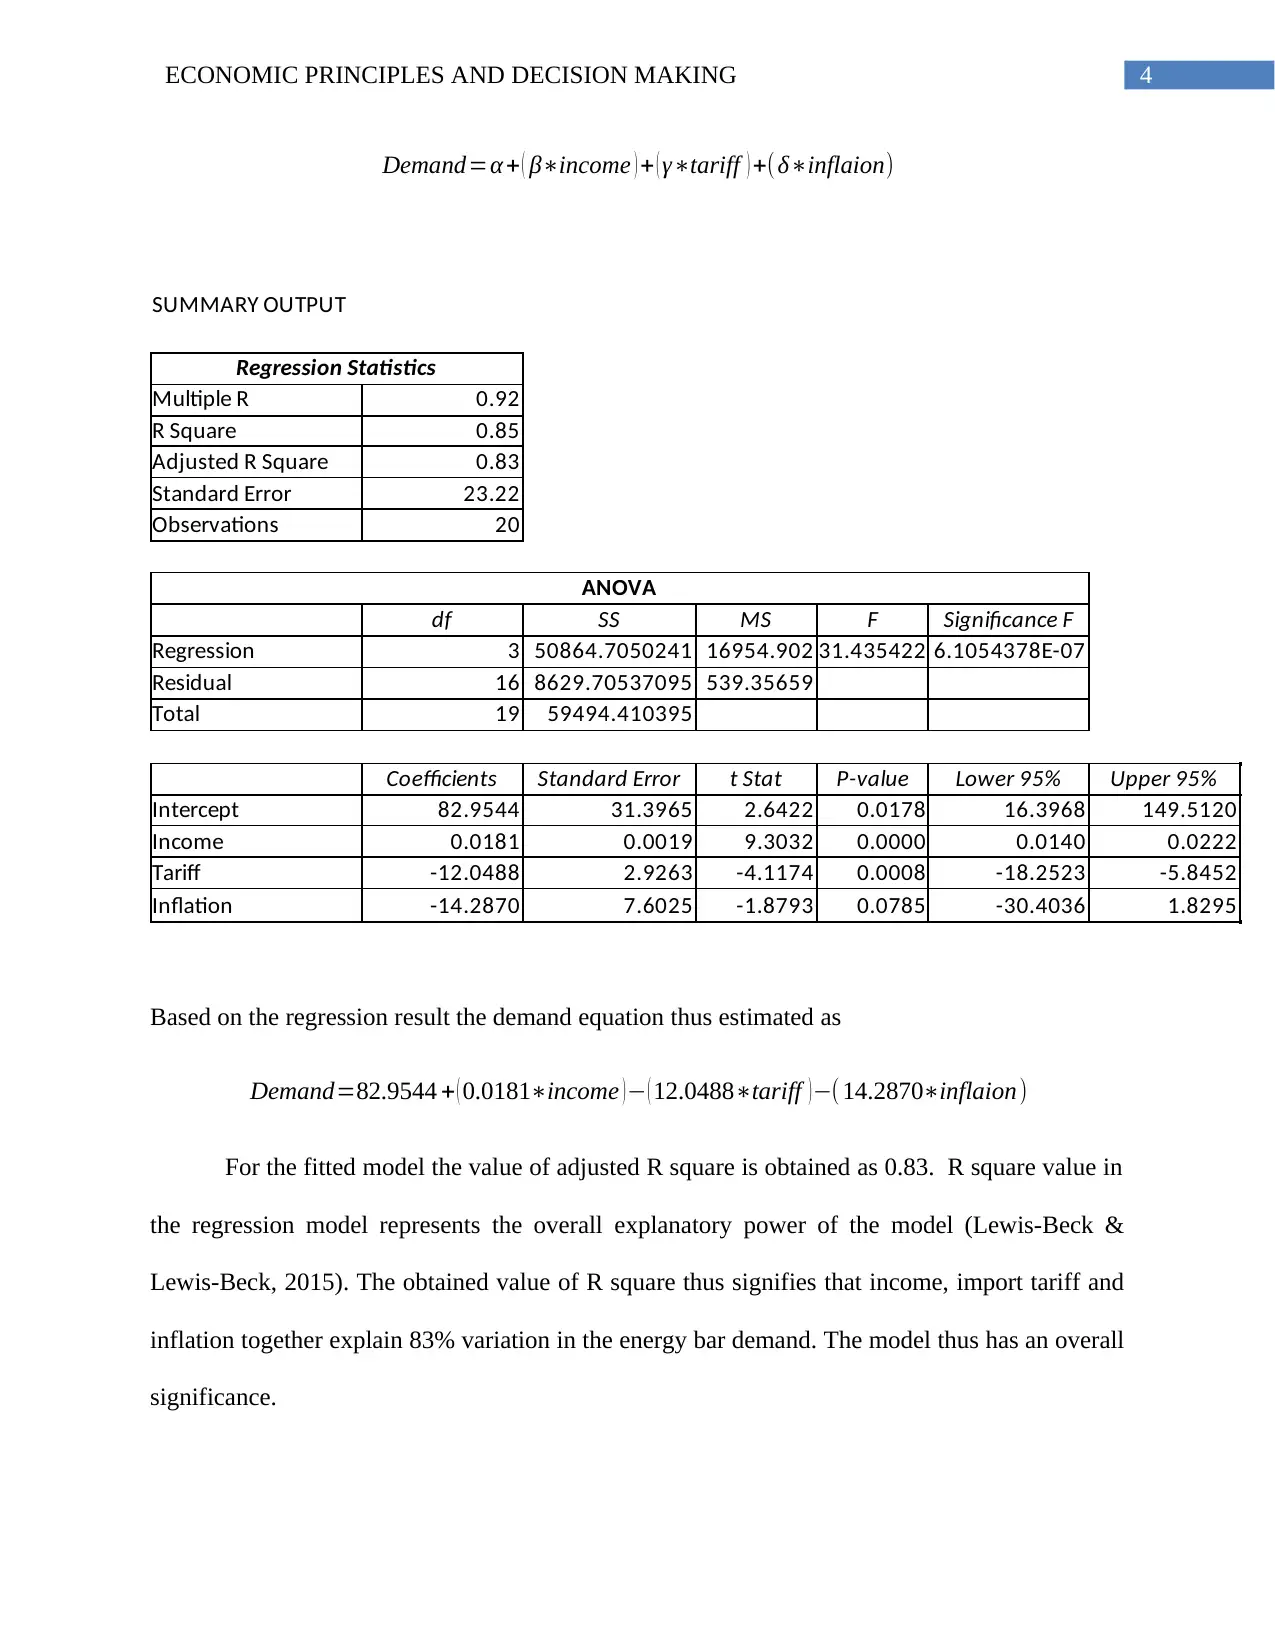
Demand=α + ( β∗income ) + ( γ∗tariff ) +(δ∗inflaion)
SUMMARY OUTPUT
Regression Statistics
Multiple R 0.92
R Square 0.85
Adjusted R Square 0.83
Standard Error 23.22
Observations 20
ANOVA
df SS MS F Significance F
Regression 3 50864.7050241 16954.902 31.435422 6.1054378E-07
Residual 16 8629.70537095 539.35659
Total 19 59494.410395
Coefficients Standard Error t Stat P-value Lower 95% Upper 95%
Intercept 82.9544 31.3965 2.6422 0.0178 16.3968 149.5120
Income 0.0181 0.0019 9.3032 0.0000 0.0140 0.0222
Tariff -12.0488 2.9263 -4.1174 0.0008 -18.2523 -5.8452
Inflation -14.2870 7.6025 -1.8793 0.0785 -30.4036 1.8295
Based on the regression result the demand equation thus estimated as
Demand=82.9544 + ( 0.0181∗income ) − ( 12.0488∗tariff ) −( 14.2870∗inflaion)
For the fitted model the value of adjusted R square is obtained as 0.83. R square value in
the regression model represents the overall explanatory power of the model (Lewis-Beck &
Lewis-Beck, 2015). The obtained value of R square thus signifies that income, import tariff and
inflation together explain 83% variation in the energy bar demand. The model thus has an overall
significance.
5ECONOMIC PRINCIPLES AND DECISION MAKING
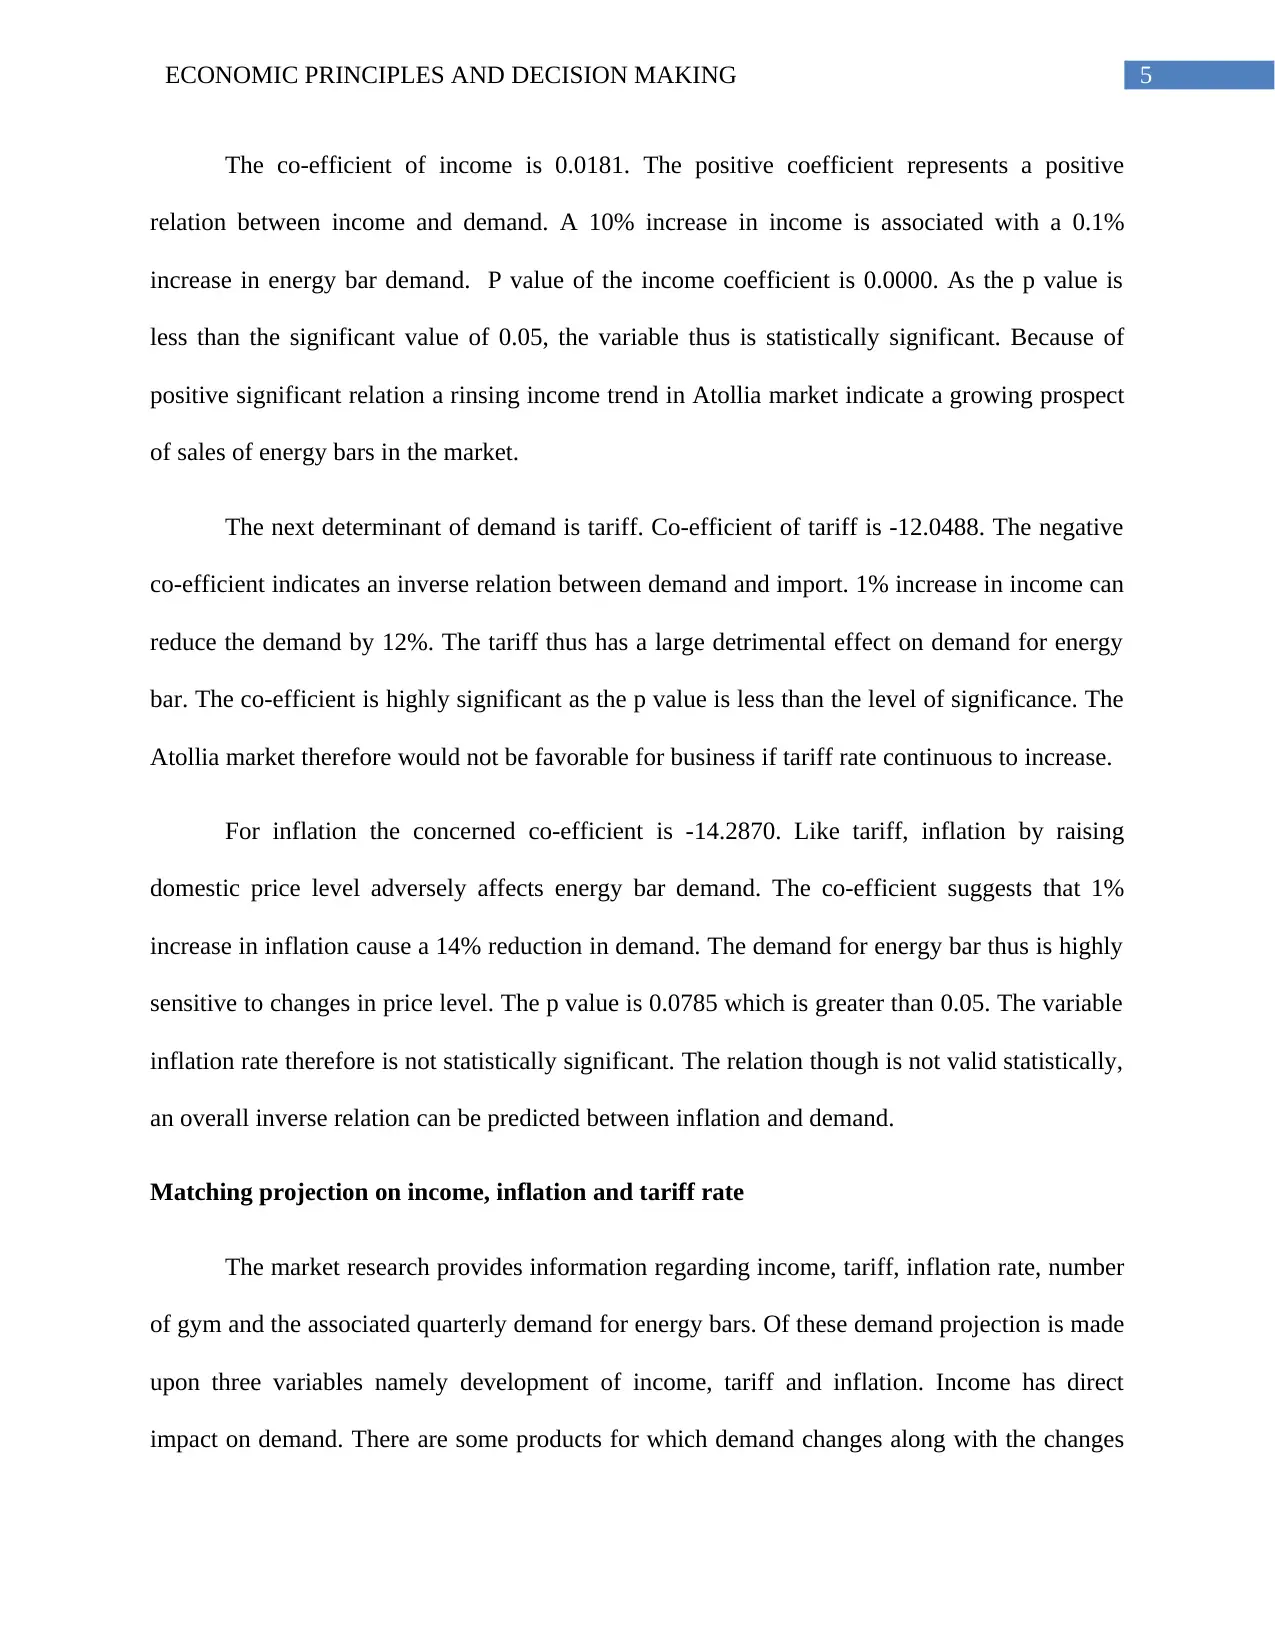
The co-efficient of income is 0.0181. The positive coefficient represents a positive
relation between income and demand. A 10% increase in income is associated with a 0.1%
increase in energy bar demand. P value of the income coefficient is 0.0000. As the p value is
less than the significant value of 0.05, the variable thus is statistically significant. Because of
positive significant relation a rinsing income trend in Atollia market indicate a growing prospect
of sales of energy bars in the market.
The next determinant of demand is tariff. Co-efficient of tariff is -12.0488. The negative
co-efficient indicates an inverse relation between demand and import. 1% increase in income can
reduce the demand by 12%. The tariff thus has a large detrimental effect on demand for energy
bar. The co-efficient is highly significant as the p value is less than the level of significance. The
Atollia market therefore would not be favorable for business if tariff rate continuous to increase.
For inflation the concerned co-efficient is -14.2870. Like tariff, inflation by raising
domestic price level adversely affects energy bar demand. The co-efficient suggests that 1%
increase in inflation cause a 14% reduction in demand. The demand for energy bar thus is highly
sensitive to changes in price level. The p value is 0.0785 which is greater than 0.05. The variable
inflation rate therefore is not statistically significant. The relation though is not valid statistically,
an overall inverse relation can be predicted between inflation and demand.
Matching projection on income, inflation and tariff rate
The market research provides information regarding income, tariff, inflation rate, number
of gym and the associated quarterly demand for energy bars. Of these demand projection is made
upon three variables namely development of income, tariff and inflation. Income has direct
impact on demand. There are some products for which demand changes along with the changes
⊘ This is a preview!⊘
Do you want full access?
Subscribe today to unlock all pages.
Trusted by 1+ million students worldwide
6ECONOMIC PRINCIPLES AND DECISION MAKING
in consumption habit. Demand for energy bars is associated with healthy habits of people. An
increases in income allows people to afford healthy habits like going to gym, consuming energy
bars and others. By the law of demand, price has a negative relation with demand. The
magnitude of change in demand depends on the concerned elasticity of demand. Income by
increasing purchasing power and demand create an upward pressure on price. Therefore, an
income change might be associated with a change in price level or inflation. The price level can
be further aggravated with changes in import tariff. Tariff raises the price of imported goods. The
imported price when combines with domestic price level, results in an increase in the inflation
rate. The association of income, inflation and tariff in influencing demand are analyzed with
support of fundamental economic theories. The theories discussed here include basic model of
demand and supply, macroeconomic model of aggregate demand and aggregate supply, the
Phillips curve and the Laffer curve. Each has its own significance in determining demand,
inflation, income and optimum amount of tariff rate.
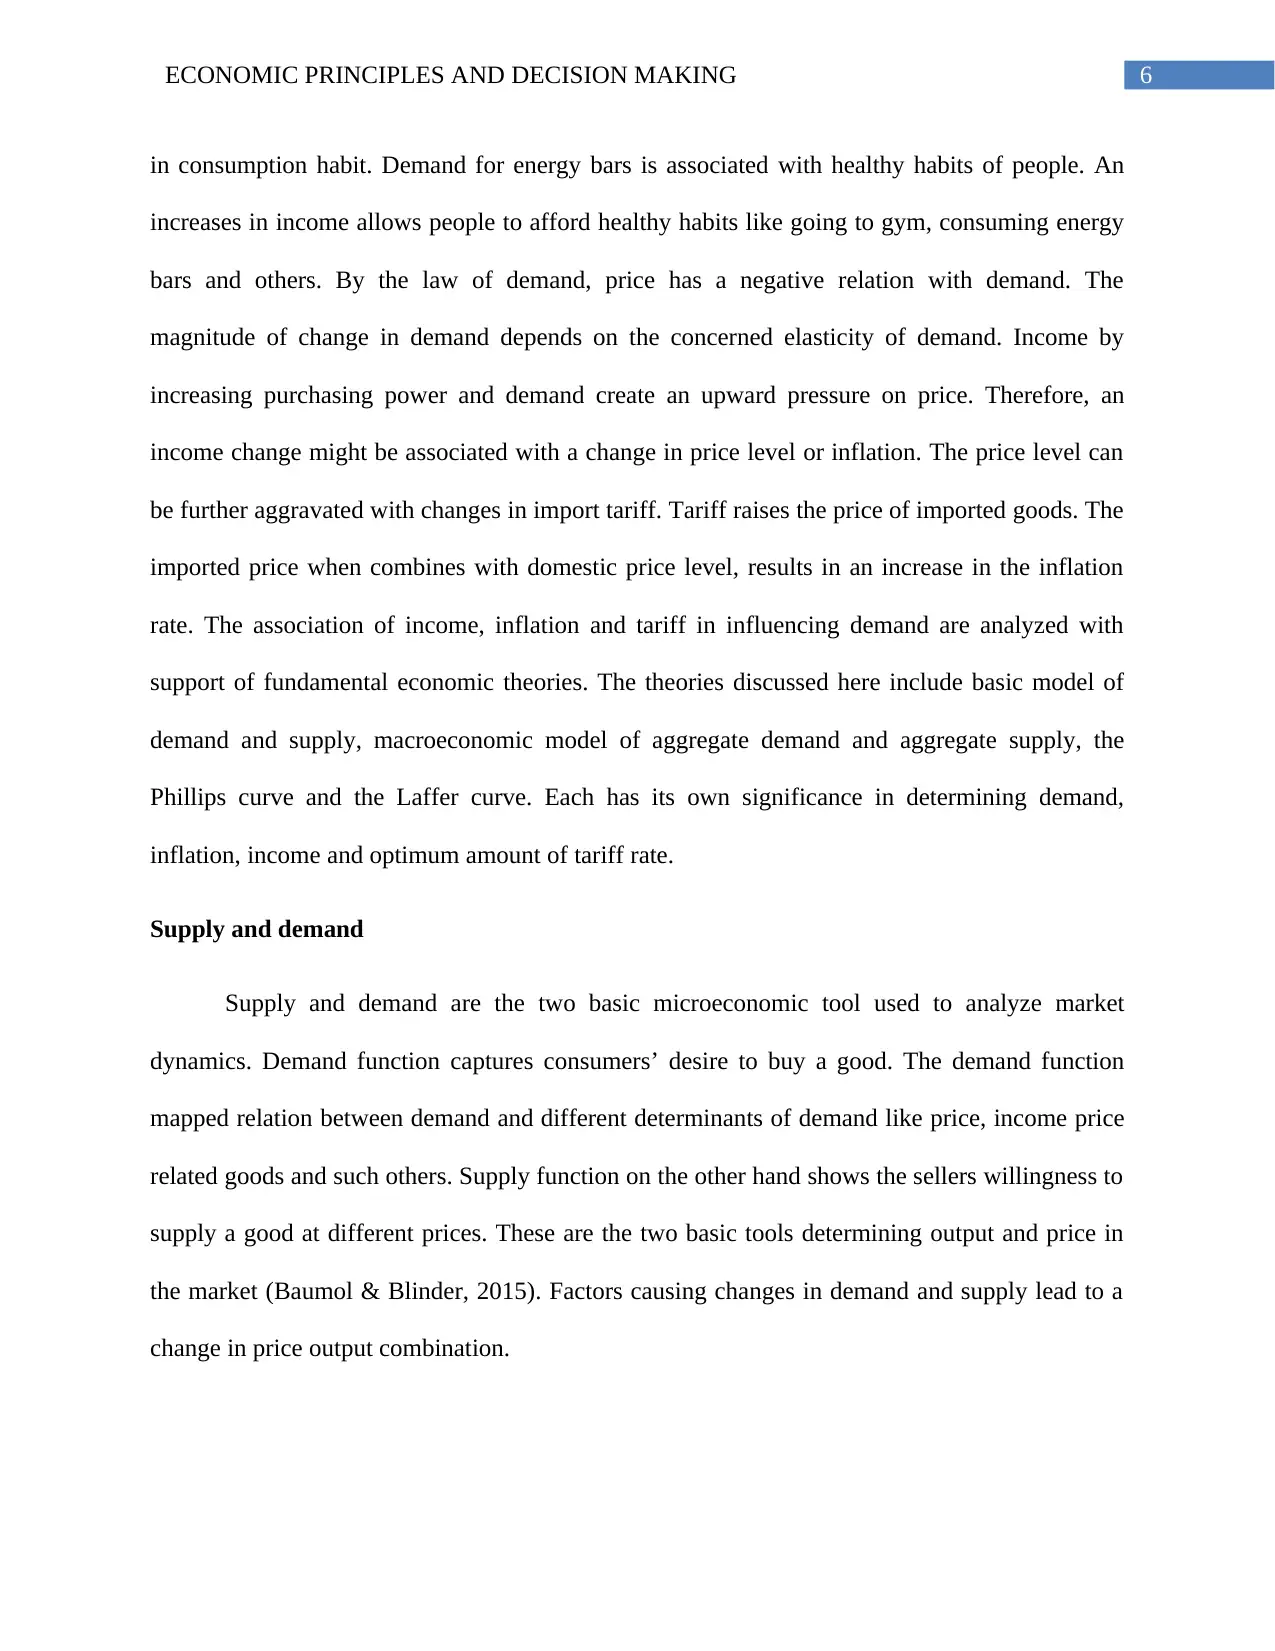
Supply and demand
Supply and demand are the two basic microeconomic tool used to analyze market
dynamics. Demand function captures consumers’ desire to buy a good. The demand function
mapped relation between demand and different determinants of demand like price, income price
related goods and such others. Supply function on the other hand shows the sellers willingness to
supply a good at different prices. These are the two basic tools determining output and price in
the market (Baumol & Blinder, 2015). Factors causing changes in demand and supply lead to a
change in price output combination.
in consumption habit. Demand for energy bars is associated with healthy habits of people. An
increases in income allows people to afford healthy habits like going to gym, consuming energy
bars and others. By the law of demand, price has a negative relation with demand. The
magnitude of change in demand depends on the concerned elasticity of demand. Income by
increasing purchasing power and demand create an upward pressure on price. Therefore, an
income change might be associated with a change in price level or inflation. The price level can
be further aggravated with changes in import tariff. Tariff raises the price of imported goods. The
imported price when combines with domestic price level, results in an increase in the inflation
rate. The association of income, inflation and tariff in influencing demand are analyzed with
support of fundamental economic theories. The theories discussed here include basic model of
demand and supply, macroeconomic model of aggregate demand and aggregate supply, the
Phillips curve and the Laffer curve. Each has its own significance in determining demand,
inflation, income and optimum amount of tariff rate.
Supply and demand
Supply and demand are the two basic microeconomic tool used to analyze market
dynamics. Demand function captures consumers’ desire to buy a good. The demand function
mapped relation between demand and different determinants of demand like price, income price
related goods and such others. Supply function on the other hand shows the sellers willingness to
supply a good at different prices. These are the two basic tools determining output and price in
the market (Baumol & Blinder, 2015). Factors causing changes in demand and supply lead to a
change in price output combination.
Paraphrase This Document
Need a fresh take? Get an instant paraphrase of this document with our AI Paraphraser
7ECONOMIC PRINCIPLES AND DECISION MAKING
Figure 1: Demand-Supply model and equilibrium
(Source: as created by Author)
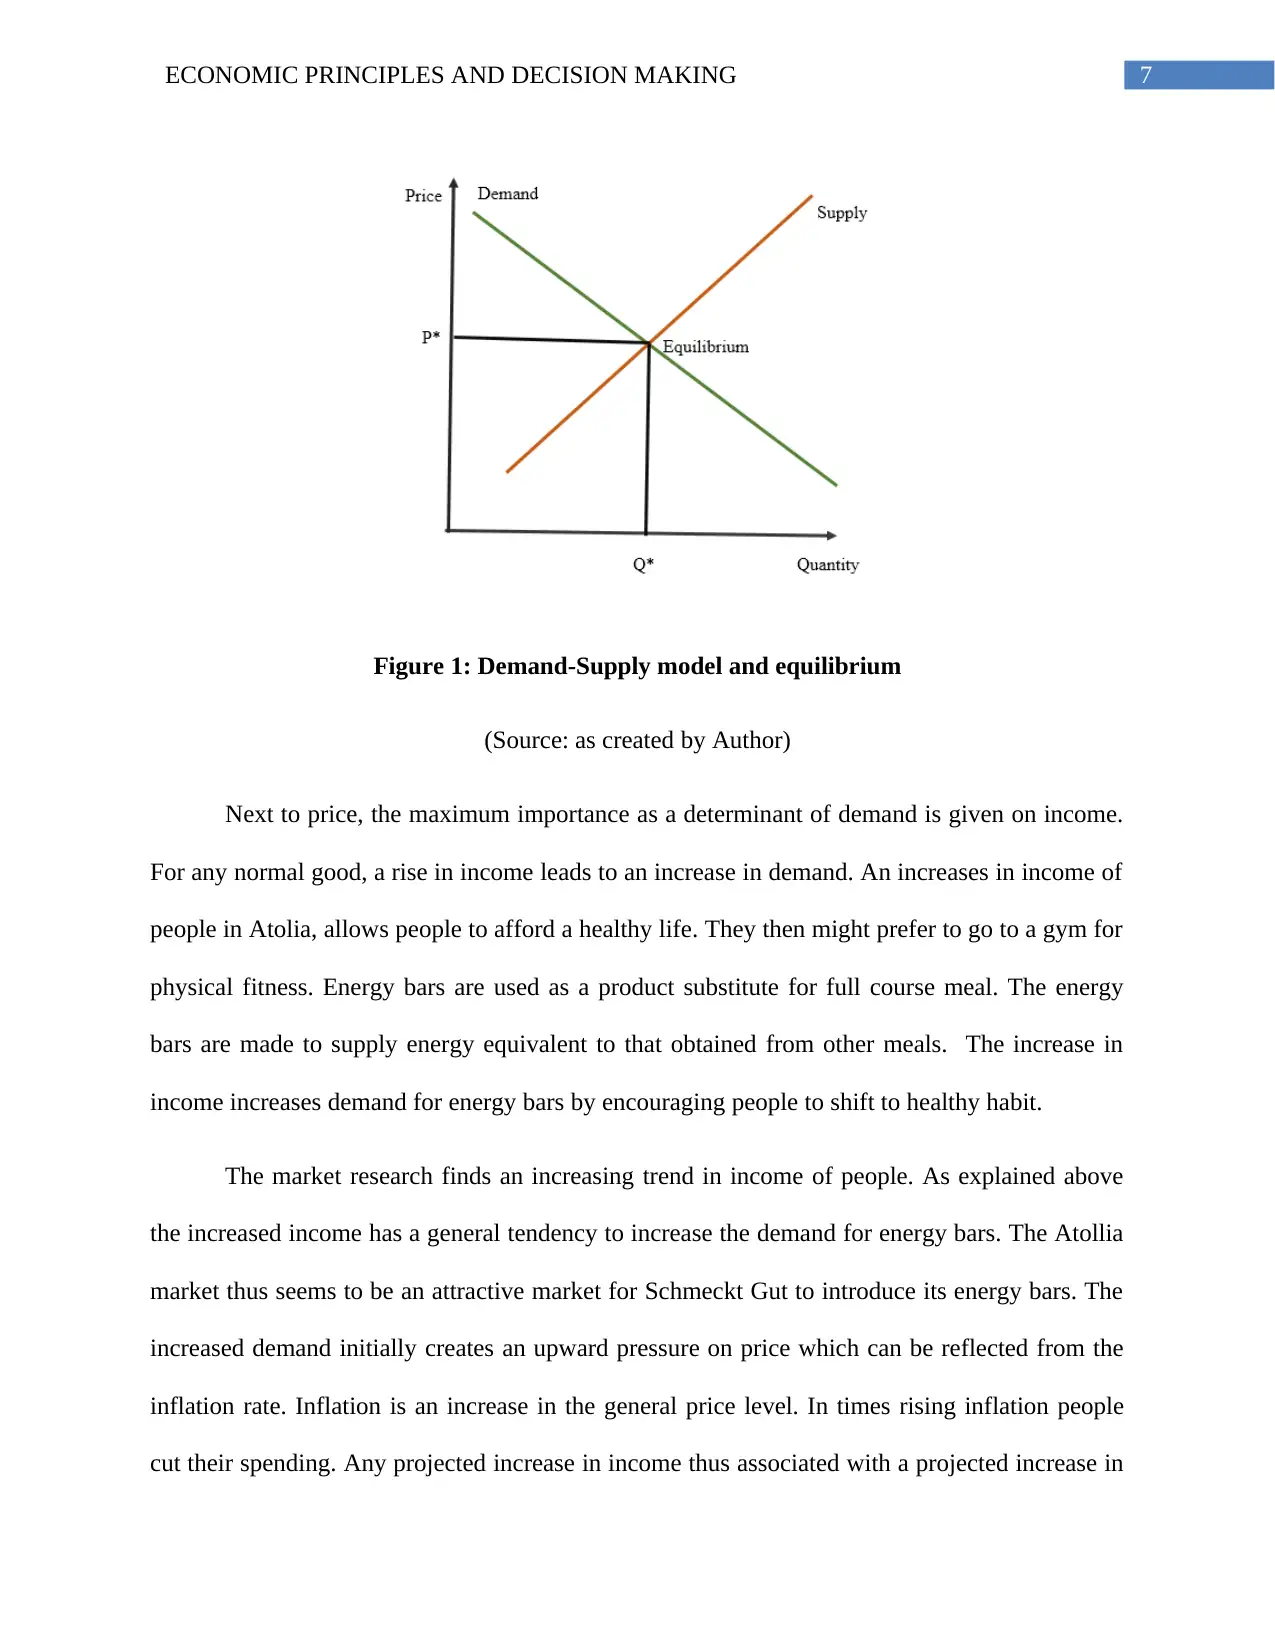
Next to price, the maximum importance as a determinant of demand is given on income.
For any normal good, a rise in income leads to an increase in demand. An increases in income of
people in Atolia, allows people to afford a healthy life. They then might prefer to go to a gym for
physical fitness. Energy bars are used as a product substitute for full course meal. The energy
bars are made to supply energy equivalent to that obtained from other meals. The increase in
income increases demand for energy bars by encouraging people to shift to healthy habit.
The market research finds an increasing trend in income of people. As explained above
the increased income has a general tendency to increase the demand for energy bars. The Atollia
market thus seems to be an attractive market for Schmeckt Gut to introduce its energy bars. The
increased demand initially creates an upward pressure on price which can be reflected from the
inflation rate. Inflation is an increase in the general price level. In times rising inflation people
cut their spending. Any projected increase in income thus associated with a projected increase in
Figure 1: Demand-Supply model and equilibrium
(Source: as created by Author)
Next to price, the maximum importance as a determinant of demand is given on income.
For any normal good, a rise in income leads to an increase in demand. An increases in income of
people in Atolia, allows people to afford a healthy life. They then might prefer to go to a gym for
physical fitness. Energy bars are used as a product substitute for full course meal. The energy
bars are made to supply energy equivalent to that obtained from other meals. The increase in
income increases demand for energy bars by encouraging people to shift to healthy habit.
The market research finds an increasing trend in income of people. As explained above
the increased income has a general tendency to increase the demand for energy bars. The Atollia
market thus seems to be an attractive market for Schmeckt Gut to introduce its energy bars. The
increased demand initially creates an upward pressure on price which can be reflected from the
inflation rate. Inflation is an increase in the general price level. In times rising inflation people
cut their spending. Any projected increase in income thus associated with a projected increase in
8ECONOMIC PRINCIPLES AND DECISION MAKING
price inflation (Mahanty, 2014). Inflation might also be resulted from an increase in price of
imported goods. Tariff rate by raising price of the imported goods produces an adverse impact on
demand. Tariff is often offered with the objective of protecting domestic firms from international
competition. A high tariff however has a distortionary effect both for importing and exporting
nation.
Model of aggregate supply and aggregate demand
The supply demand dynamics of a single market provides insight of a particular market.
In order to understand state of the entire economy the concept of aggregate demand and
aggregate supply is needed. The aggregate demand in contrast to individual demand represents
the demand of the whole economy (Johnson, 2017). It is expressed as a sum of expenditure made
on consumption, investment, government expenditure and net export. The aggregate supply
represent the goods and services available to the economy in a given year instead of supply in a
particular market. Interaction of forces of aggregate demand and aggregate supply determines
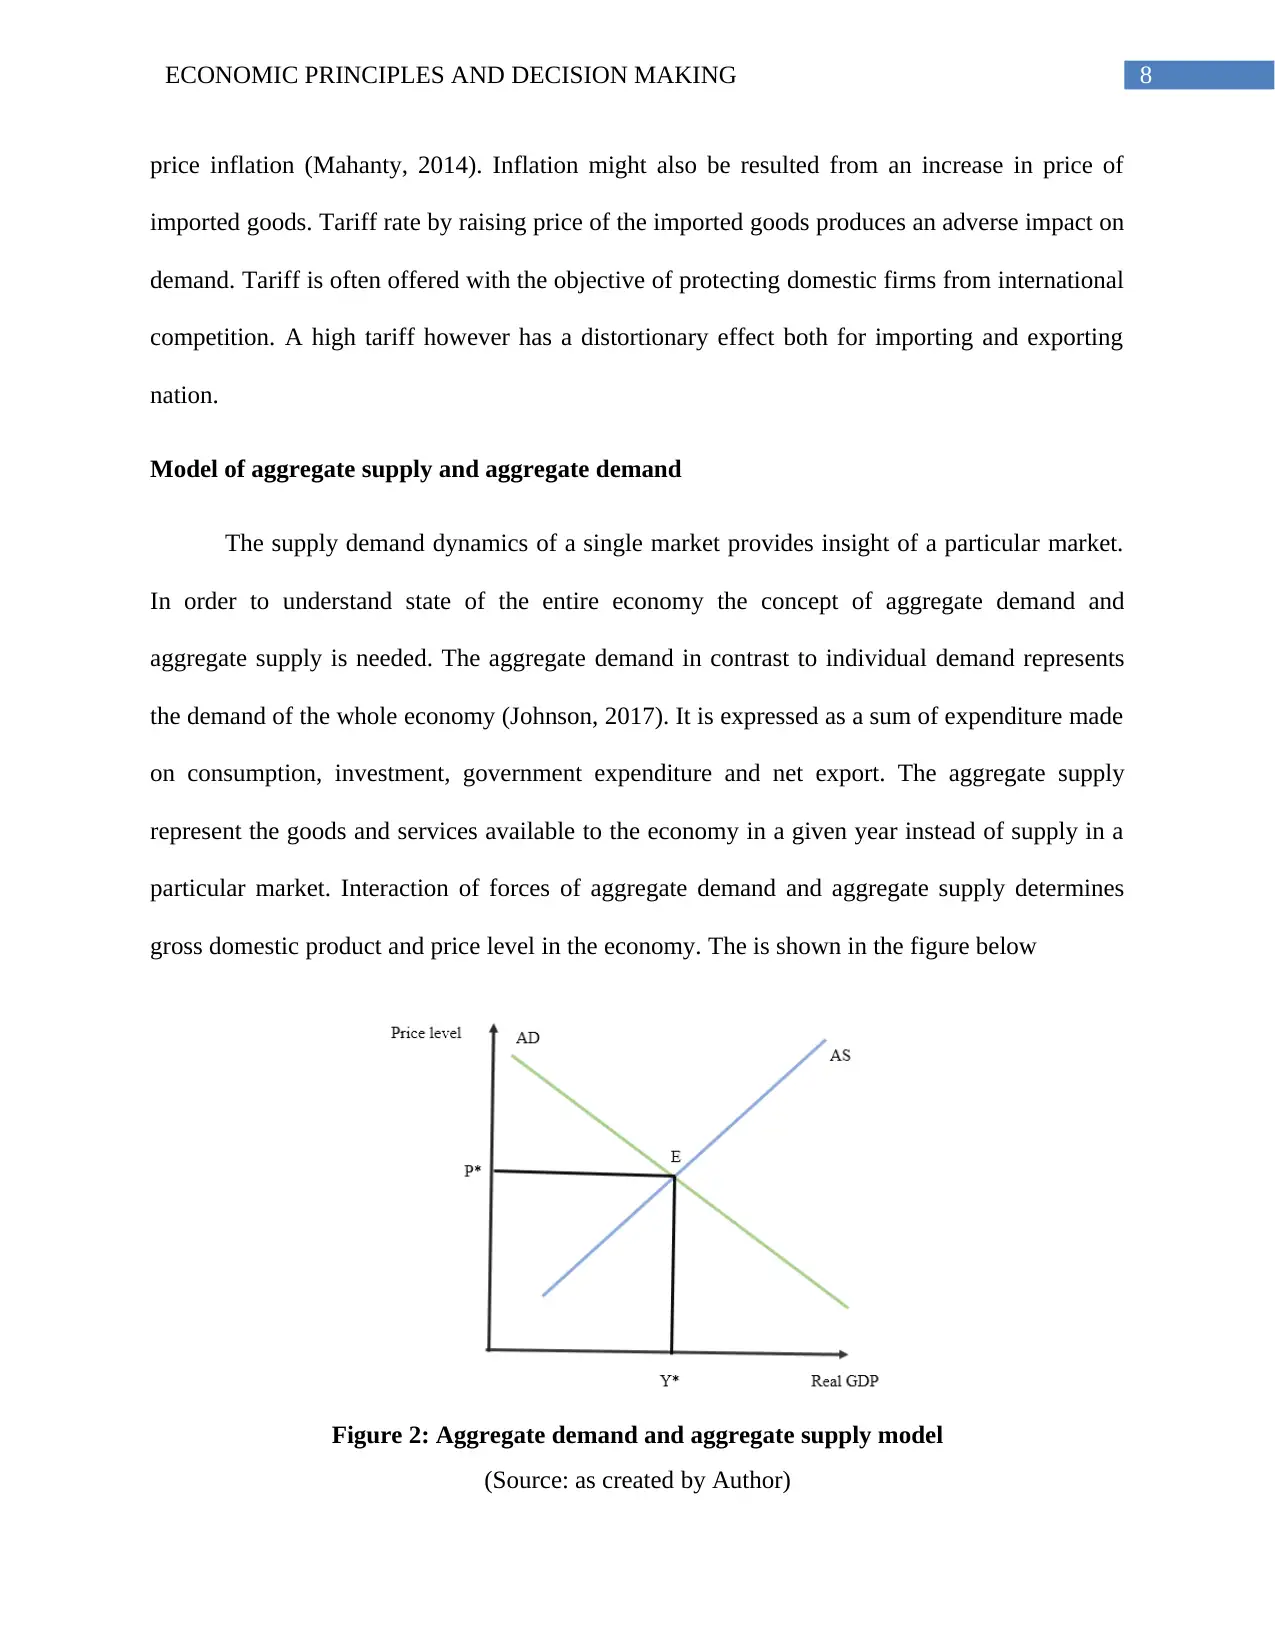
gross domestic product and price level in the economy. The is shown in the figure below
Figure 2: Aggregate demand and aggregate supply model
(Source: as created by Author)
price inflation (Mahanty, 2014). Inflation might also be resulted from an increase in price of
imported goods. Tariff rate by raising price of the imported goods produces an adverse impact on
demand. Tariff is often offered with the objective of protecting domestic firms from international
competition. A high tariff however has a distortionary effect both for importing and exporting
nation.
Model of aggregate supply and aggregate demand
The supply demand dynamics of a single market provides insight of a particular market.
In order to understand state of the entire economy the concept of aggregate demand and
aggregate supply is needed. The aggregate demand in contrast to individual demand represents
the demand of the whole economy (Johnson, 2017). It is expressed as a sum of expenditure made
on consumption, investment, government expenditure and net export. The aggregate supply
represent the goods and services available to the economy in a given year instead of supply in a
particular market. Interaction of forces of aggregate demand and aggregate supply determines
gross domestic product and price level in the economy. The is shown in the figure below
Figure 2: Aggregate demand and aggregate supply model
(Source: as created by Author)
⊘ This is a preview!⊘
Do you want full access?
Subscribe today to unlock all pages.
Trusted by 1+ million students worldwide
9ECONOMIC PRINCIPLES AND DECISION MAKING
The downward sloping curve shows the aggregate demand curve. The aggregate supply
curve is the upward sloping curve AS. The two curves meet at point E. It is the point of
macroeconomic equilibrium. Corresponding to the macroeconomic equilibrium, the GDP is
determined as Y* with associated price level of P*.
The aggregate demand changes in response to changes in different components of
aggregate demand. All the three factors income and tariff rate by effecting aggregate demand can
influence inflation and real output. When income increases, then there is an overall increase in
consumption expenditure. An increase in consumption expenditure increases aggregate demand.
As aggregate demand curve shifts upward there is an increase in general price level of inflation.
The inflation thus caused by a rising demand side pressure is termed as demand-pull inflation
(Jacoby & Brooman, 2017). The increases income marks an increase in both domestic and
import demand. The increased import demand however reduces aggregate demand following a
decline in net export. In order to restrict import government might opt the policy of imposing an
import tariff. The import tariff makes people pay a higher price for the goods imported outside.
The increased import price creates an inflationary pressure on the domestic price level.
Phillips Curve
An interrelation exists among different macroeconomic variables. This is to say that
movement in any one variable is associated with a change in other variables. Two such
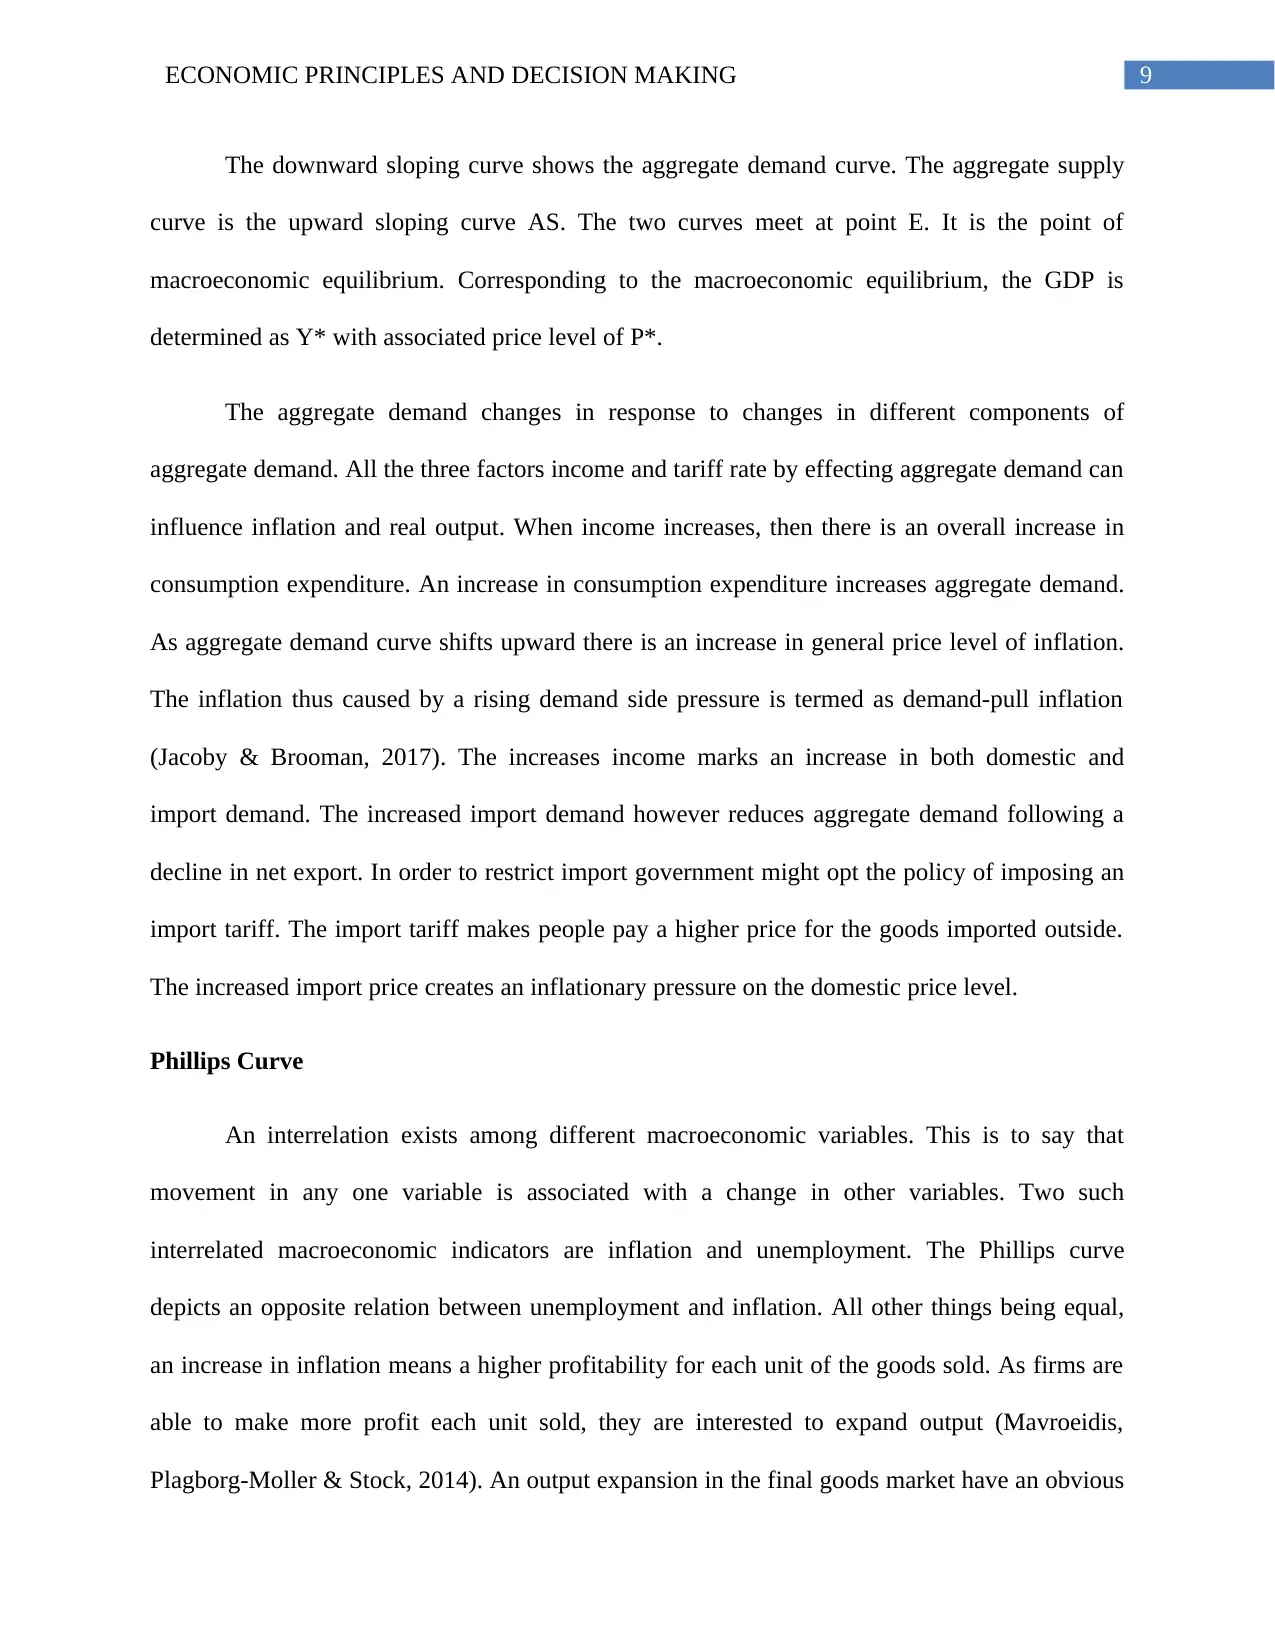
interrelated macroeconomic indicators are inflation and unemployment. The Phillips curve
depicts an opposite relation between unemployment and inflation. All other things being equal,
an increase in inflation means a higher profitability for each unit of the goods sold. As firms are
able to make more profit each unit sold, they are interested to expand output (Mavroeidis,
Plagborg-Moller & Stock, 2014). An output expansion in the final goods market have an obvious
The downward sloping curve shows the aggregate demand curve. The aggregate supply
curve is the upward sloping curve AS. The two curves meet at point E. It is the point of
macroeconomic equilibrium. Corresponding to the macroeconomic equilibrium, the GDP is
determined as Y* with associated price level of P*.
The aggregate demand changes in response to changes in different components of
aggregate demand. All the three factors income and tariff rate by effecting aggregate demand can
influence inflation and real output. When income increases, then there is an overall increase in
consumption expenditure. An increase in consumption expenditure increases aggregate demand.
As aggregate demand curve shifts upward there is an increase in general price level of inflation.
The inflation thus caused by a rising demand side pressure is termed as demand-pull inflation
(Jacoby & Brooman, 2017). The increases income marks an increase in both domestic and
import demand. The increased import demand however reduces aggregate demand following a
decline in net export. In order to restrict import government might opt the policy of imposing an
import tariff. The import tariff makes people pay a higher price for the goods imported outside.
The increased import price creates an inflationary pressure on the domestic price level.
Phillips Curve
An interrelation exists among different macroeconomic variables. This is to say that
movement in any one variable is associated with a change in other variables. Two such
interrelated macroeconomic indicators are inflation and unemployment. The Phillips curve
depicts an opposite relation between unemployment and inflation. All other things being equal,
an increase in inflation means a higher profitability for each unit of the goods sold. As firms are
able to make more profit each unit sold, they are interested to expand output (Mavroeidis,
Plagborg-Moller & Stock, 2014). An output expansion in the final goods market have an obvious
Paraphrase This Document
Need a fresh take? Get an instant paraphrase of this document with our AI Paraphraser
10ECONOMIC PRINCIPLES AND DECISION MAKING
impact on factor market. In the process as labor demand increases, unemployment falls. For this
reasons, a low to moderate inflation rate is accepted for a healthy economy. Any anti-inflationary
policy thus might have adverse impact on employment.
Figure 3: Phillips curve relation
(Source: Uribe & Schmitt-Grohé, 2017)
For the Atollia market, gain in income results in an increase demand and inflation. As the
general price level increases, as depicted by Phillips relation unemployment reduces. The gain in
employment can again contribute to an increase income and demand.
Laffer curve
Laffer curve describes the relation between rate of tax and revenue generated from the
tax. Revenue from taxes does not increase uniformly for every unit increase in tax rate. The
revenue at the initial state increases with rise in tax rate. Revenue however continues to be
increase up to a certain level. After that level revenue founds to be falling. This makes the Laffer
11ECONOMIC PRINCIPLES AND DECISION MAKING
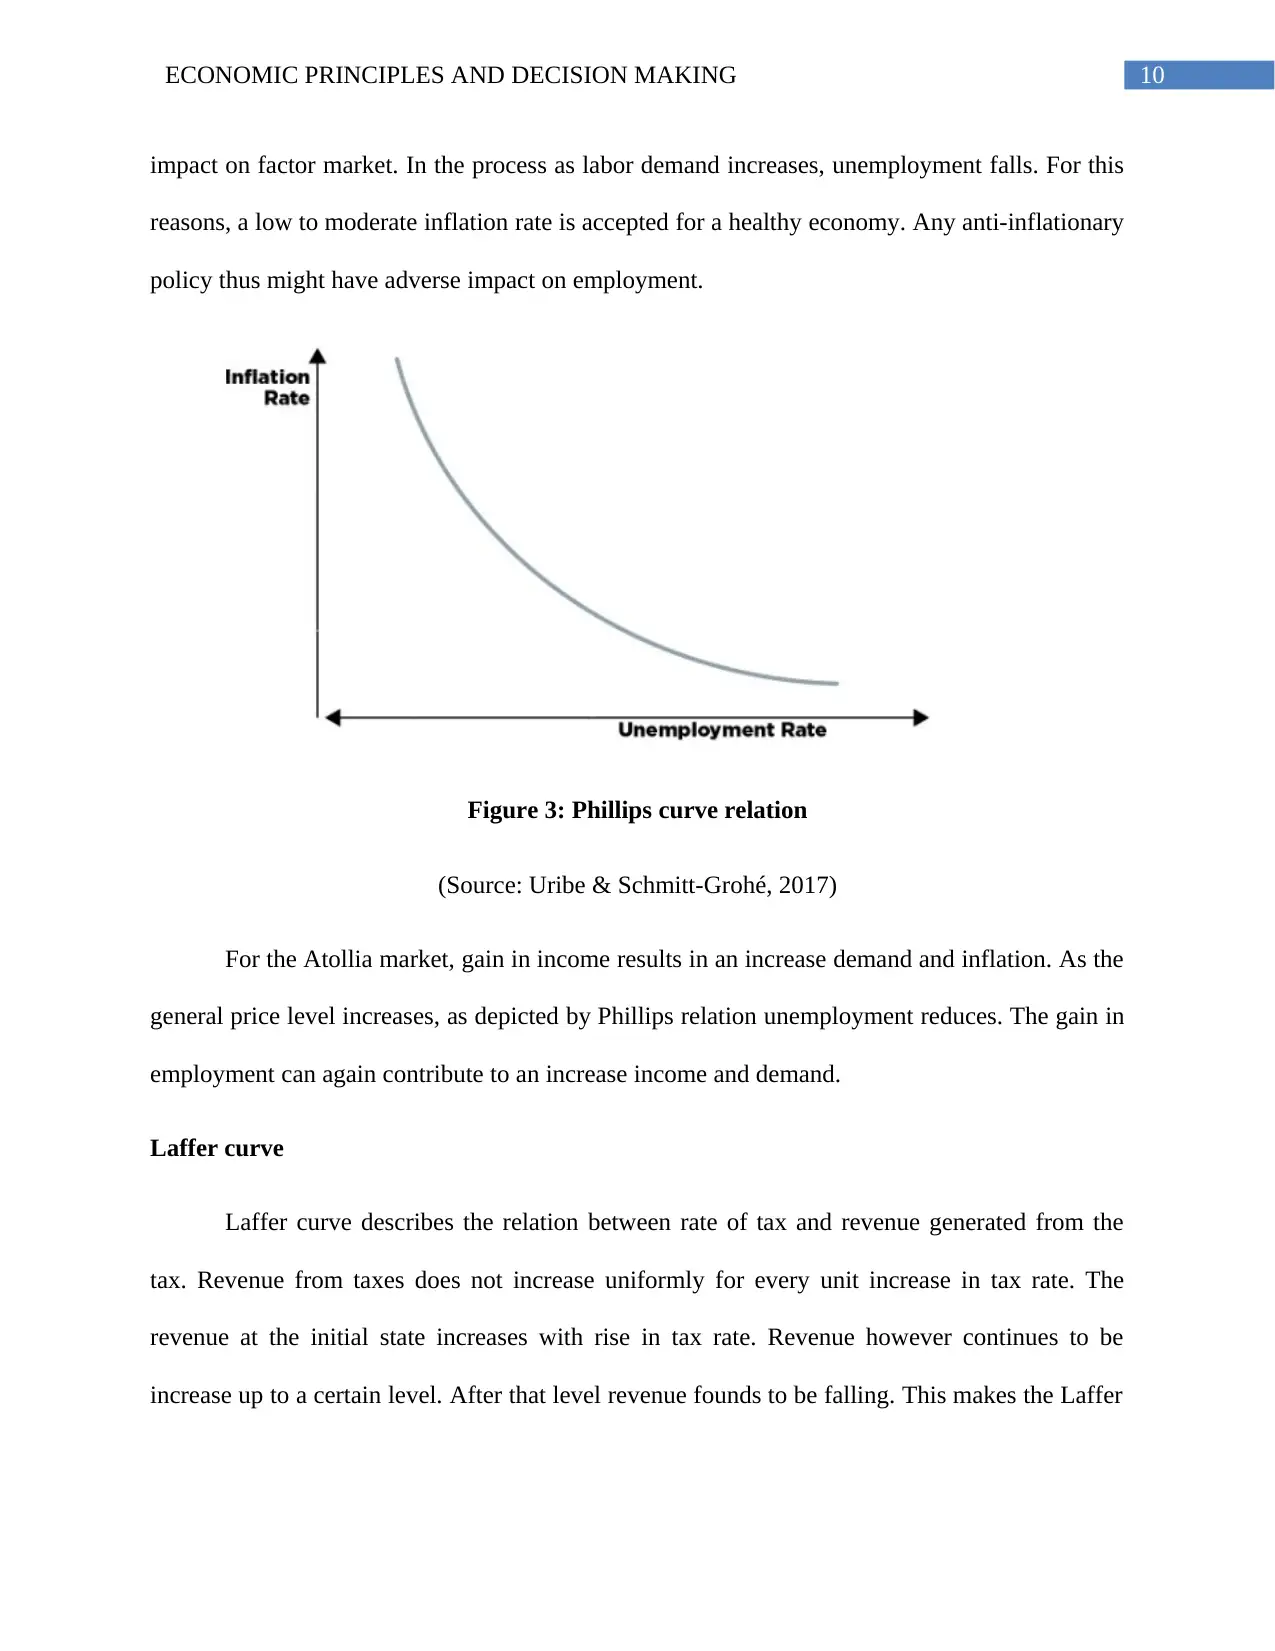
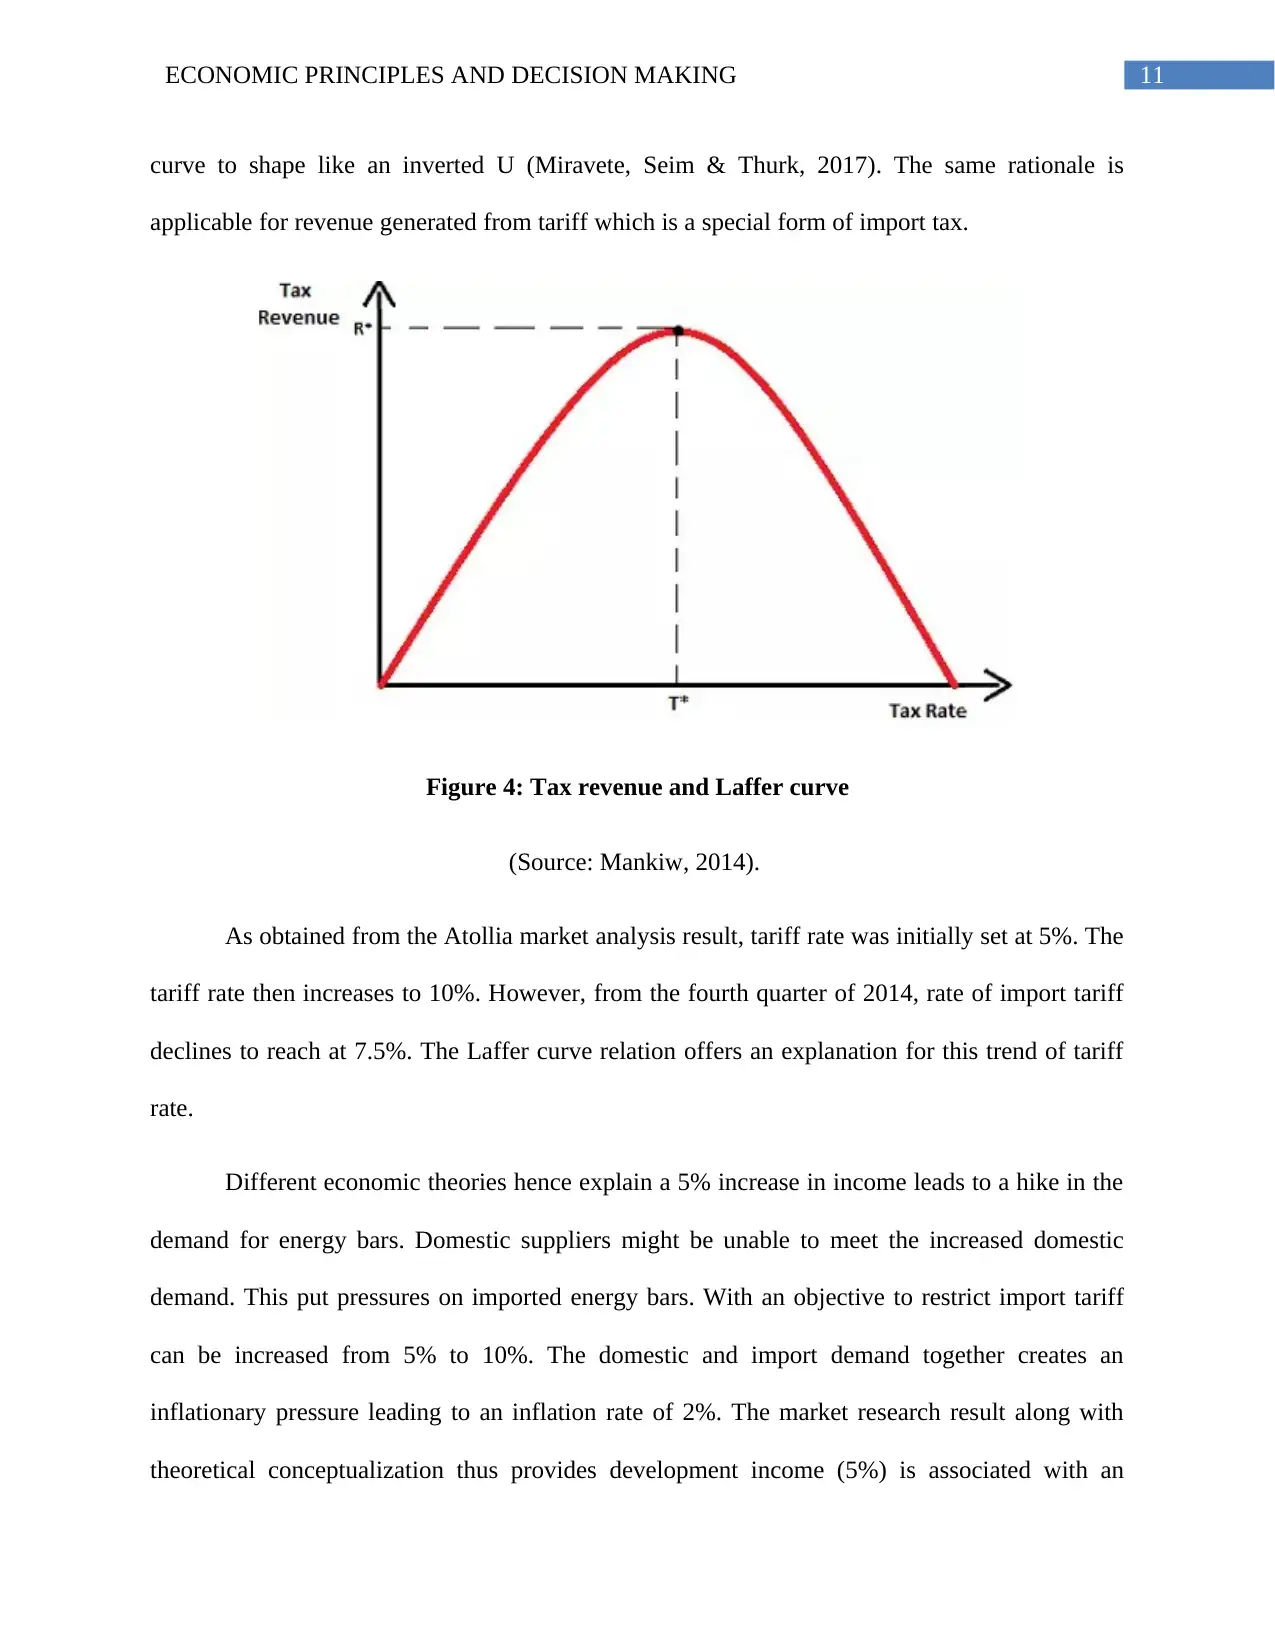
curve to shape like an inverted U (Miravete, Seim & Thurk, 2017). The same rationale is
applicable for revenue generated from tariff which is a special form of import tax.
Figure 4: Tax revenue and Laffer curve
(Source: Mankiw, 2014).
As obtained from the Atollia market analysis result, tariff rate was initially set at 5%. The
tariff rate then increases to 10%. However, from the fourth quarter of 2014, rate of import tariff
declines to reach at 7.5%. The Laffer curve relation offers an explanation for this trend of tariff
rate.
Different economic theories hence explain a 5% increase in income leads to a hike in the
demand for energy bars. Domestic suppliers might be unable to meet the increased domestic
demand. This put pressures on imported energy bars. With an objective to restrict import tariff
can be increased from 5% to 10%. The domestic and import demand together creates an
inflationary pressure leading to an inflation rate of 2%. The market research result along with
theoretical conceptualization thus provides development income (5%) is associated with an
⊘ This is a preview!⊘
Do you want full access?
Subscribe today to unlock all pages.
Trusted by 1+ million students worldwide
1 out of 16
Related Documents


Your All-in-One AI-Powered Toolkit for Academic Success.
+13062052269
info@desklib.com
Available 24*7 on WhatsApp / Email
![[object Object]](/_next/static/media/star-bottom.7253800d.svg)
Unlock your academic potential
Copyright © 2020–2026 A2Z Services. All Rights Reserved. Developed and managed by ZUCOL.