Economic Principles & Decision Making: Impact of Income Analysis
VerifiedAdded on 2020/10/05
|20
|4638
|188
Report
AI Summary
This report delves into the core principles of economics and the decision-making processes central to modern economic understanding. It examines the factors influencing tariff and inflation rates, with a specific focus on how changes in income impact these economic indicators. The report explores key economic concepts such as aggregate demand and supply, the Phillips curve, and the Laffer curve to illustrate the relationships between income, purchasing power, and government policies like taxation and tariffs. Through regression analysis, the study quantifies the relationship between income and economic variables, highlighting a positive correlation between independent and dependent variables. The analysis considers cost-push and demand-pull inflation, globalization's effects, and the trade-offs inherent in macroeconomic objectives. The report concludes with recommendations for managing economic variables and understanding the interplay of income, tariffs, and inflation, offering a comprehensive view of economic dynamics and decision-making.
ECONOMIC PRINCIPLES
& DECISION MAKING
& DECISION MAKING
Paraphrase This Document
Need a fresh take? Get an instant paraphrase of this document with our AI Paraphraser
Executive summary
The report is about the Economic principle and decision making which refers to the
process of decision making which is major building blocking of modern economics and it also a
central concept around which course is built. There are many factors which can be considered for
the reason of increasing tariff rates and inflation rates. It is possible that certain change in income
can cause in many rates and factors of the economy among which major impact is on the tariff
rates and inflation rates by government.
There must be equal demand and supply for smooth flow in the market factors
Government will increase the tariff rates so that import goods become more expensive and not
affordable by the consumers so to avoid imports which further leads to import substitution.Cost
push inflation can be explained as the inflation which is caused by the rising price of the goods
and services whereas demand pull inflation is rise in price of the goods and services due to
excess of aggregate demand than aggregate supply
Openness to the trade and investment (Globalisation) has substantially contributed in the
national growth but to maintain the equality ad stability in demand and supply government of the
nation still impose high tariffs on the imported goods so that purchasing power can decrease and
supply can be matched with those of demand. Lower unemployment may bring huge inflation
which implies the trade off between import macroeconomics objectives. Increases income of the
consumer leads increase in the purchasing power of the consumer which further raises the
demand. The importance of the theory is to provide an economic justification for the political
popular policy of cutting tax rate
To undertake the situation and to reduce the purchasing power government will tend to
impose more taxes and tariffs for enhancing import substitution. There can be many factors
which can be used for controlling the inflation rates, increasing purchasing power and increasing
tariffs rates.
It is interpreted from the above report that average income of all the given consumers is
20712.67 and average annual income is 114.14 which have direct impact is on the increasing rate
of tariffs and inflation rates and R square showing the .918 value which ,means that there is
91.8% of relationship between the independent variable and dependent variables it also depicts
there is positive relationship between them.

⊘ This is a preview!⊘
Do you want full access?
Subscribe today to unlock all pages.
Trusted by 1+ million students worldwide
TABLE OF CONTENTS
..........................................................................................................................................................2
INTRODUCTION...........................................................................................................................3
Impact of income on rising inflation rate and tariffs.............................................................3
The impact of the different predictions for income development, inflation rate development
and tariff rate development on the potential demand of Schmeckt Gut with a multiple
regression analysis using data..............................................................................................10
Recommendation..................................................................................................................15
CONCLUSION..............................................................................................................................15
REFERENCES..............................................................................................................................16
Online...................................................................................................................................17
Paraphrase This Document
Need a fresh take? Get an instant paraphrase of this document with our AI Paraphraser
INTRODUCTION
The report is about the Economic principle and decision making which refers to the
process of decision making which is major building blocking of modern economics and it also a
central concept around which course is built. Various economic principles, and factors are used
for making the useful decision out if the given input.
The report will further explain about the different factors and the change in income which
directly affect the inflation rate, and taxes rates of economy through different concepts which
includes supply and demand, The fillips curve, aggregated demand and aggregated supply, The
Laffer curve which says about the different concepts through which the understanding regarding
the impact of income on inflation rates and tariffs rate can be made. This impact will be
explained with the help of using the regression analysis through which relationship can be
measured of dependent variable and independent variables.
Impact of income on rising inflation rate and tariffs
There are many factors which can be considered for the reason of increasing tariff rates
and inflation rates. This is not necessary that change in every factor will cause change in these
rates. Any one factor can also be a cause for the change in the above rates(Ball, 2017). Economy
is completely based on the different factors including foreign exchange, Gross domestic product,
national income, growth rate, inflation rate, tariff, excise etc. which somewhere affect the growth
and fall of the economy of the nation( Bartholomew and et.al., 2018). Every citizen is also
responsible for the change caused in the economy. To increase and improve the economic
condition it is necessary to keep all the rates stable and change according to the situations in
favourable manner.
It is possible that certain change in income can cause in many rates and factors of the
economy among which major impact is on the tariff rates and inflation rates by
government( Becker, 2017). This statement can be supported by the given description:
Aggregated demand and aggregated supply
Increase in consumer's income will give great rise in the purchasing power of the people that is
they want to purchase and consume more. Their increase income make it possible to afford the
goods and consume for their satisfaction. Increase in Purchasing power will further increase the
demand which may not be equal to the supply by the companies and organisation(Brim, 2017).
There must be equal demand and supply for smooth flow in the market factors. This situation
will influence the government of the nation to increase the inflation rates that is they will charge
higher price on consumer goods so that demand can tends to fall and can match given
supply( Emas, 2015).
Increase purchasing power will also lead to more import of the goods and services which
is not available in the particular country than people of the country will try to consume the
imported products which is downfall of the economic currency(Frederiks, Stenner and Hobman,
2015). To improve the situation government will also increase tariff rates that is the rate of
importing the goods. Government will increase the tariff rates so that import goods become more
expensive and not affordable by the consumers so to avoid imports which further leads to import
substitution.There can be two types of inflation which is categorised into cost push inflation and
demand pull inflation.
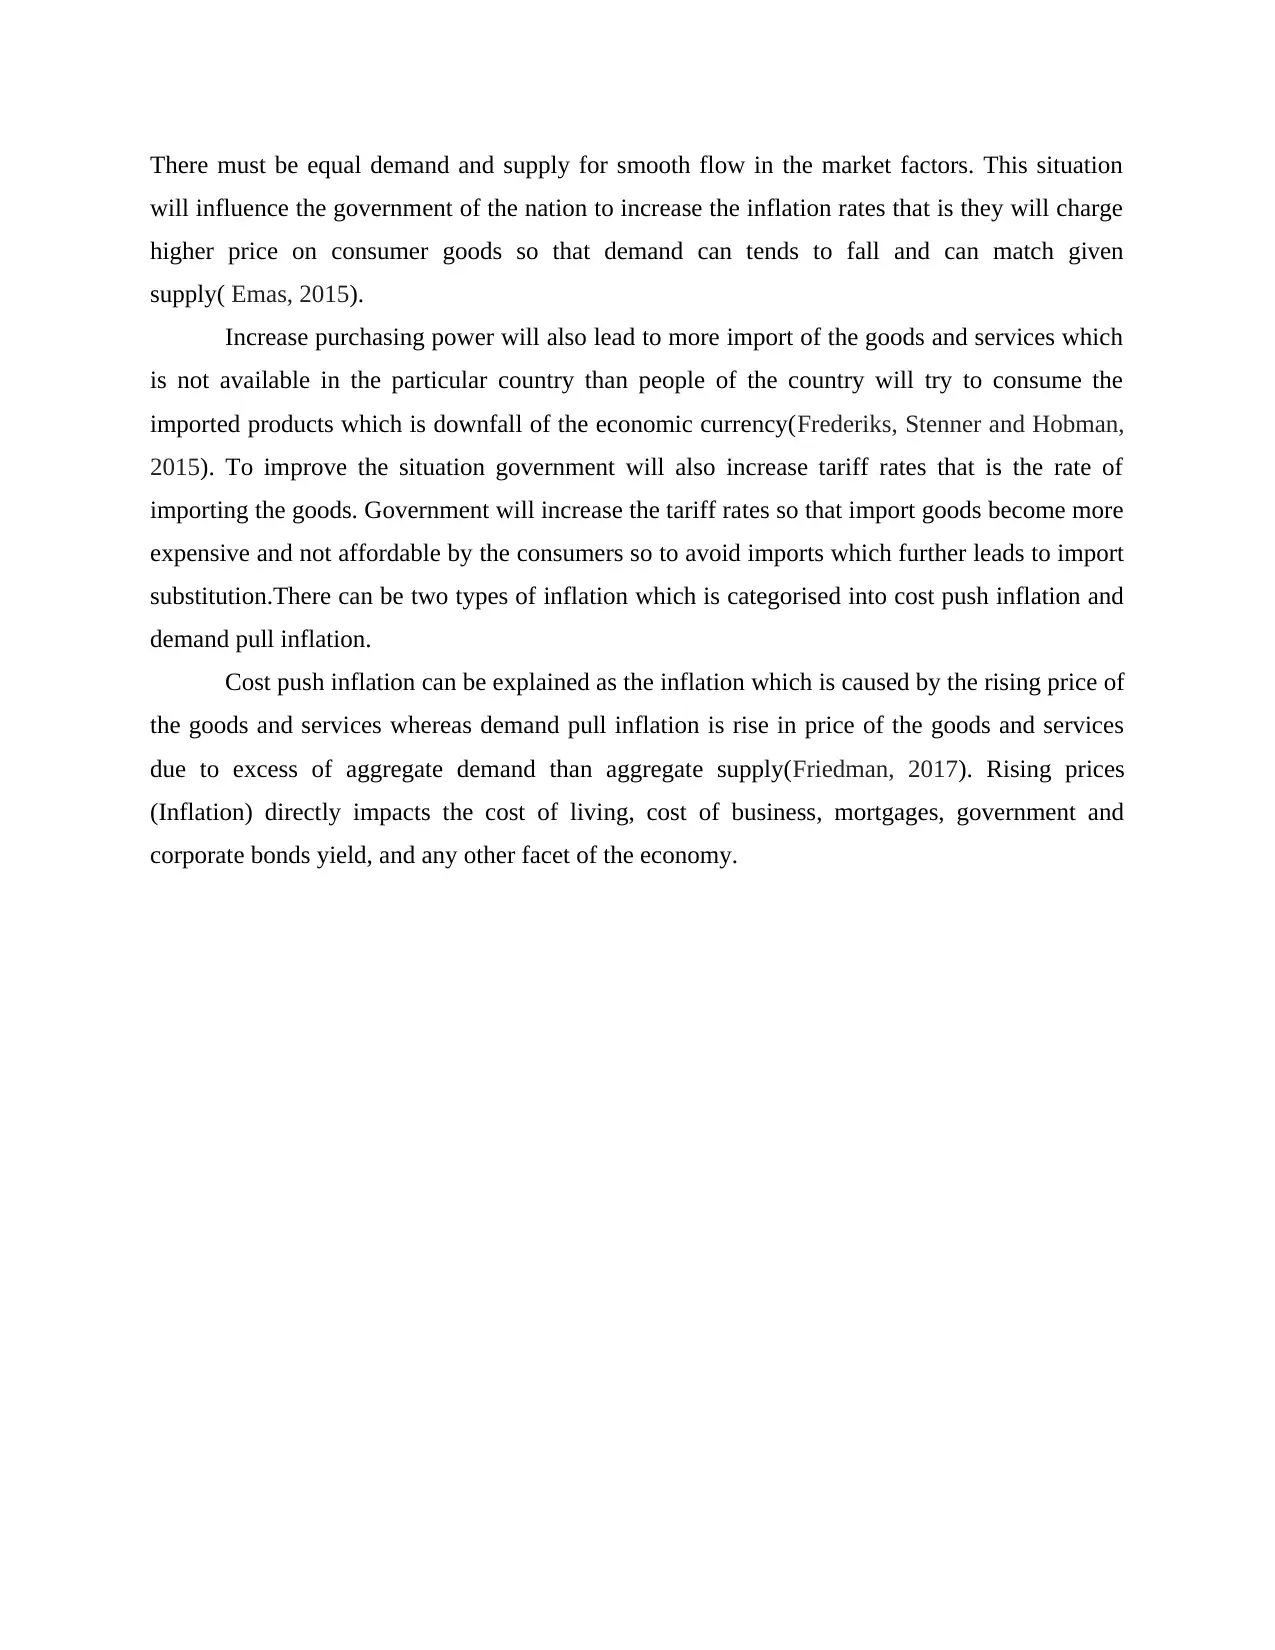
Cost push inflation can be explained as the inflation which is caused by the rising price of
the goods and services whereas demand pull inflation is rise in price of the goods and services
due to excess of aggregate demand than aggregate supply(Friedman, 2017). Rising prices
(Inflation) directly impacts the cost of living, cost of business, mortgages, government and
corporate bonds yield, and any other facet of the economy.
will influence the government of the nation to increase the inflation rates that is they will charge
higher price on consumer goods so that demand can tends to fall and can match given
supply( Emas, 2015).
Increase purchasing power will also lead to more import of the goods and services which
is not available in the particular country than people of the country will try to consume the
imported products which is downfall of the economic currency(Frederiks, Stenner and Hobman,
2015). To improve the situation government will also increase tariff rates that is the rate of
importing the goods. Government will increase the tariff rates so that import goods become more
expensive and not affordable by the consumers so to avoid imports which further leads to import
substitution.There can be two types of inflation which is categorised into cost push inflation and
demand pull inflation.
Cost push inflation can be explained as the inflation which is caused by the rising price of
the goods and services whereas demand pull inflation is rise in price of the goods and services
due to excess of aggregate demand than aggregate supply(Friedman, 2017). Rising prices
(Inflation) directly impacts the cost of living, cost of business, mortgages, government and
corporate bonds yield, and any other facet of the economy.
⊘ This is a preview!⊘
Do you want full access?
Subscribe today to unlock all pages.
Trusted by 1+ million students worldwide
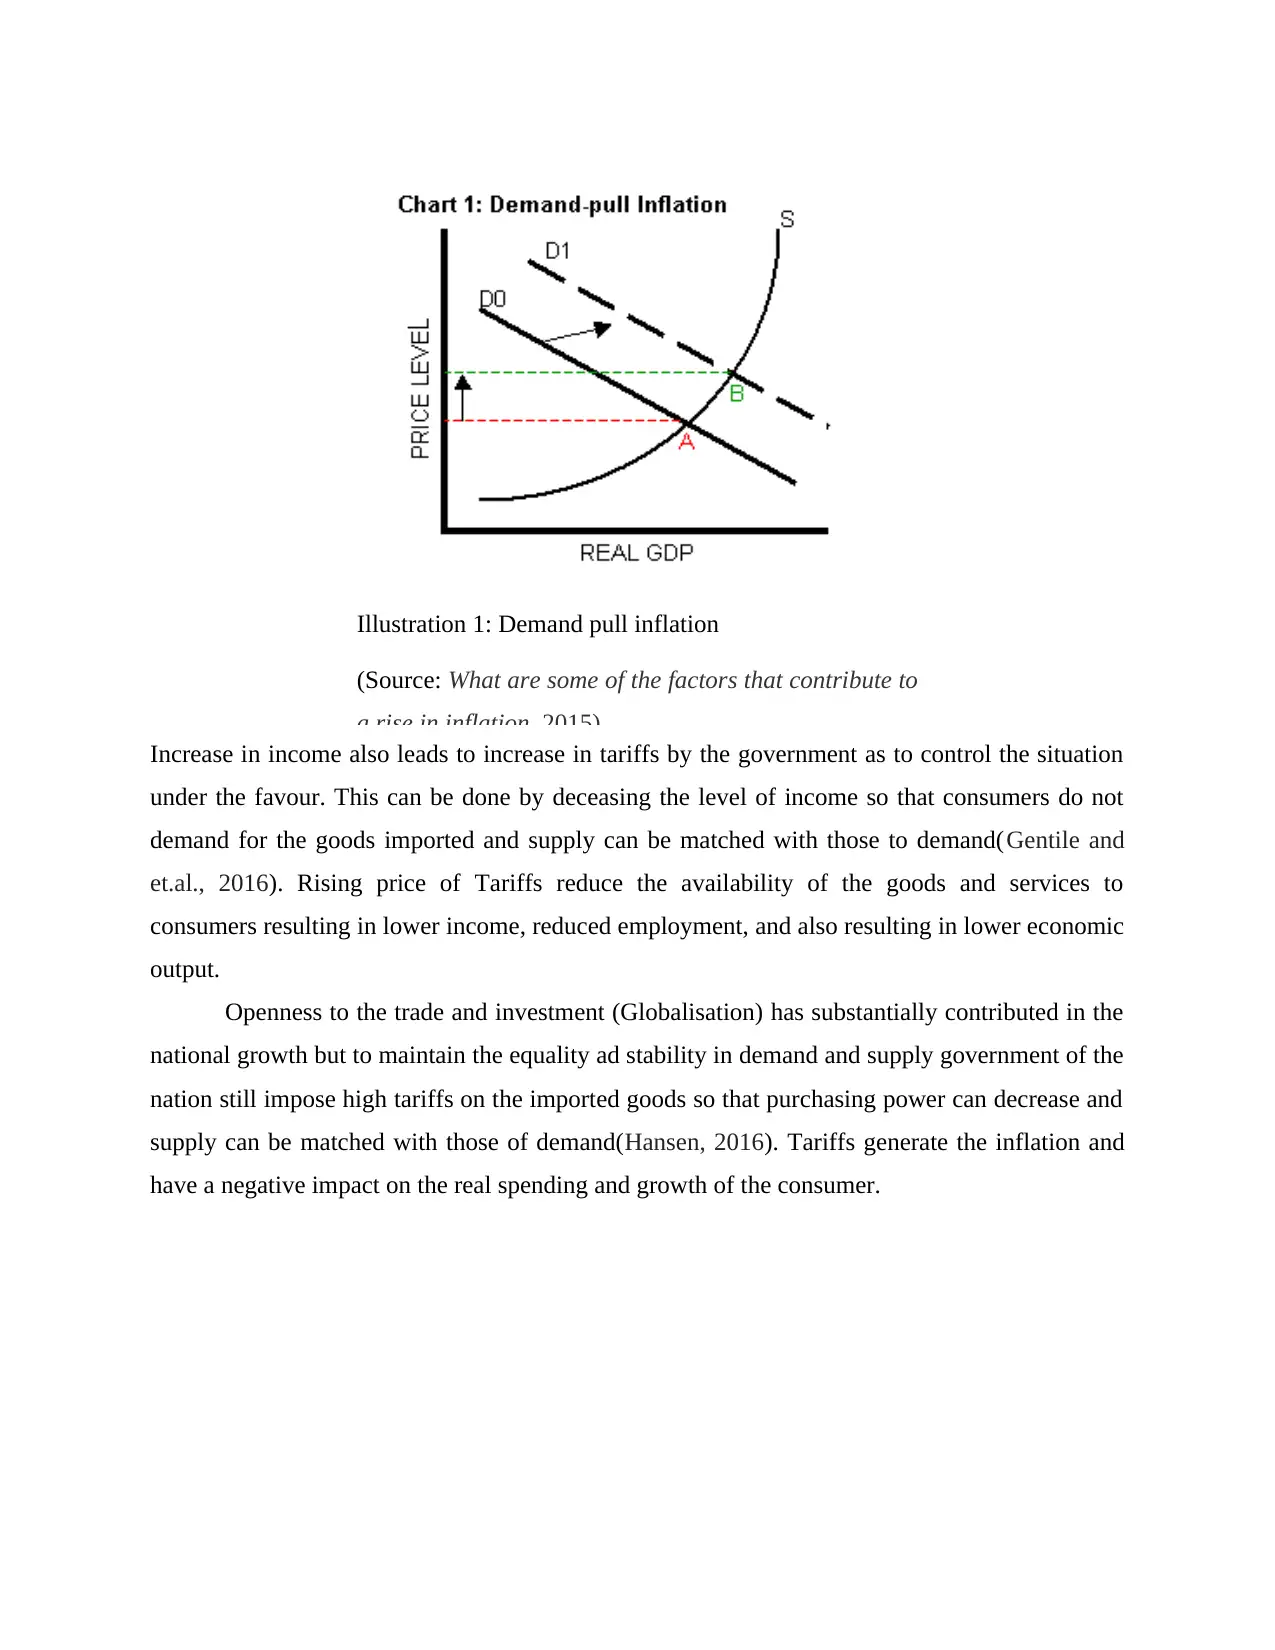
Increase in income also leads to increase in tariffs by the government as to control the situation
under the favour. This can be done by deceasing the level of income so that consumers do not
demand for the goods imported and supply can be matched with those to demand(Gentile and
et.al., 2016). Rising price of Tariffs reduce the availability of the goods and services to
consumers resulting in lower income, reduced employment, and also resulting in lower economic
output.
Openness to the trade and investment (Globalisation) has substantially contributed in the
national growth but to maintain the equality ad stability in demand and supply government of the
nation still impose high tariffs on the imported goods so that purchasing power can decrease and
supply can be matched with those of demand(Hansen, 2016). Tariffs generate the inflation and
have a negative impact on the real spending and growth of the consumer.
Illustration 1: Demand pull inflation
(Source: What are some of the factors that contribute to
a rise in inflation, 2015)
Paraphrase This Document
Need a fresh take? Get an instant paraphrase of this document with our AI Paraphraser
Aggregate demand and aggregate supply is completely affected with change in income and other
factors.
Supply and demand
Increase income of the consumer directly impacts on the demand of the consumer as their
purchasing power tends to increase which creates greater demand in the economy(Johnson,
2017). Supply is unable to meet the demand of the market which further leads in rise in inflation
rate and tariffs to make fall in the purchasing power of the consumers(Maduka and et.al., 2016).
Higher prices will result in lower demand and higher supply as higher price goods and services
were not be affordable by the consumers to consume and purchase the higher price goods that is
low purchasing power which ultimately helps in increasing the supply(Russell and Jackson,
2018). It means higher the price of the goods, higher the supply of the goods in the market.
Change in purchasing power can be result from price changes, income changes or any
currency fluctuations. Increase prices will make fall in the purchasing power and vice versa. The
Illustration 2: Impact of Tariffs on Income
(Source:The Theory of Tariffs and Quotas,2016)
income effect of the consumers results in spending more or less and does not indicate that they
will buy higher or low value goods( Bartholomew and et.al., 2018). There is a concept which is
called marginal propensity to consume this concept says about the consumers spent based on
their income. This is basically based on balancing the spending and savings of the customers.
Marginal propensity to consume generally included in larger theory of macroeconomics
which is also known as Keynesian economics(Smith and Winterhalder, 2017). The spending
proportion of their income is increase with the increase in their total income which have direct
impact on the inflation rate and tariff as a whole ultimately affect the supply of the goods and
services and higher price brings increase in supply as it lowers down the purchasing power of the
customers.
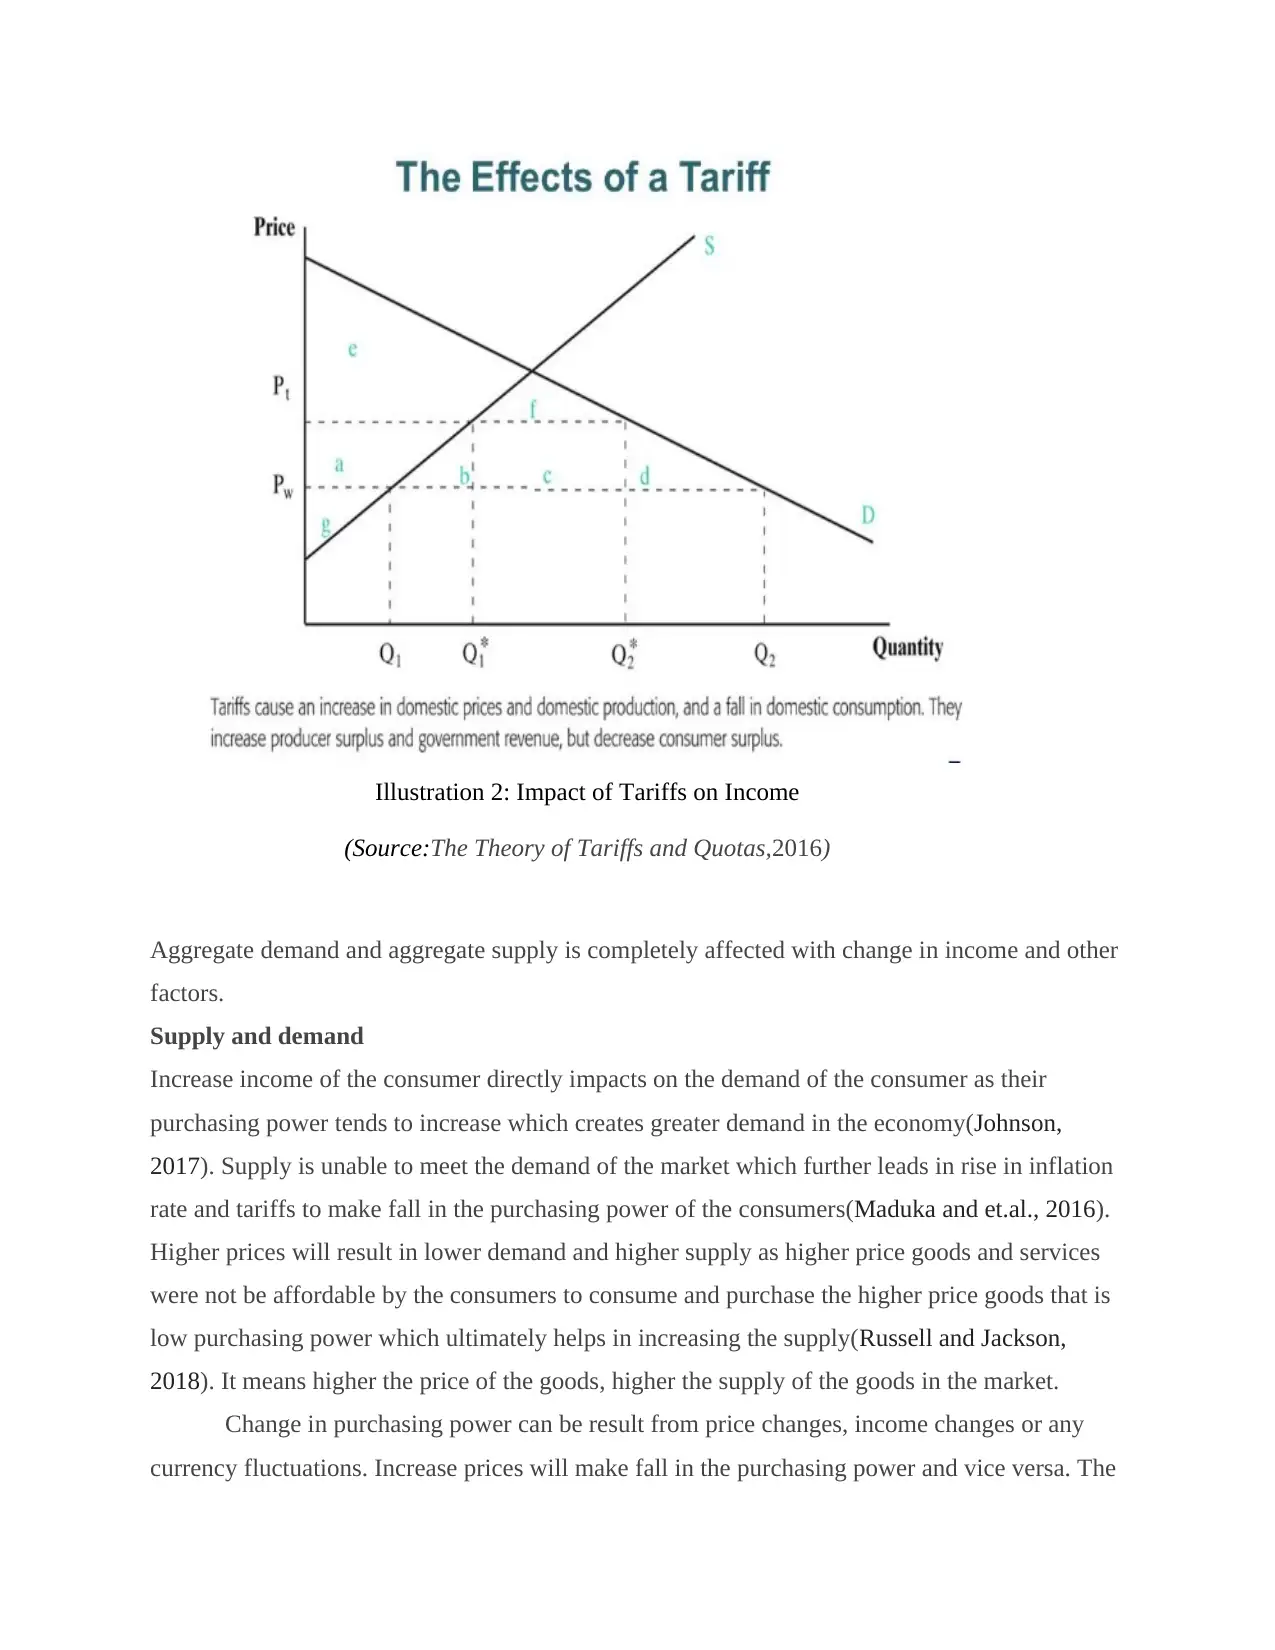
Phillips curve is basically an economic concept which states that inflation and unemployment
have stable and inverse relationship(Tan, Lee and Tan, 2016). This theory focuses on the concept
which says that the inflation in economy will lead to more jobs and lesser unemployment. This
inflation is somewhere beneficial for the people who is unemployed and needs job for the
satisfaction of their needs and wants.
The concept behind the Phillips curve stated that change in the unemployment have
predictable effect on price inflation. The inverse relationship between the unemployment and
inflation is clearly depicted downwards sloping concave curve(.Tsetsos and et.al., 2016). Where
inflation on Y axis and unemployment on x axis. Increasing inflation will depict the decreased
unemployment and vice versa.
will buy higher or low value goods( Bartholomew and et.al., 2018). There is a concept which is
called marginal propensity to consume this concept says about the consumers spent based on
their income. This is basically based on balancing the spending and savings of the customers.
Marginal propensity to consume generally included in larger theory of macroeconomics
which is also known as Keynesian economics(Smith and Winterhalder, 2017). The spending
proportion of their income is increase with the increase in their total income which have direct
impact on the inflation rate and tariff as a whole ultimately affect the supply of the goods and
services and higher price brings increase in supply as it lowers down the purchasing power of the
customers.
Phillips curve is basically an economic concept which states that inflation and unemployment
have stable and inverse relationship(Tan, Lee and Tan, 2016). This theory focuses on the concept
which says that the inflation in economy will lead to more jobs and lesser unemployment. This
inflation is somewhere beneficial for the people who is unemployed and needs job for the
satisfaction of their needs and wants.
The concept behind the Phillips curve stated that change in the unemployment have
predictable effect on price inflation. The inverse relationship between the unemployment and
inflation is clearly depicted downwards sloping concave curve(.Tsetsos and et.al., 2016). Where
inflation on Y axis and unemployment on x axis. Increasing inflation will depict the decreased
unemployment and vice versa.
⊘ This is a preview!⊘
Do you want full access?
Subscribe today to unlock all pages.
Trusted by 1+ million students worldwide
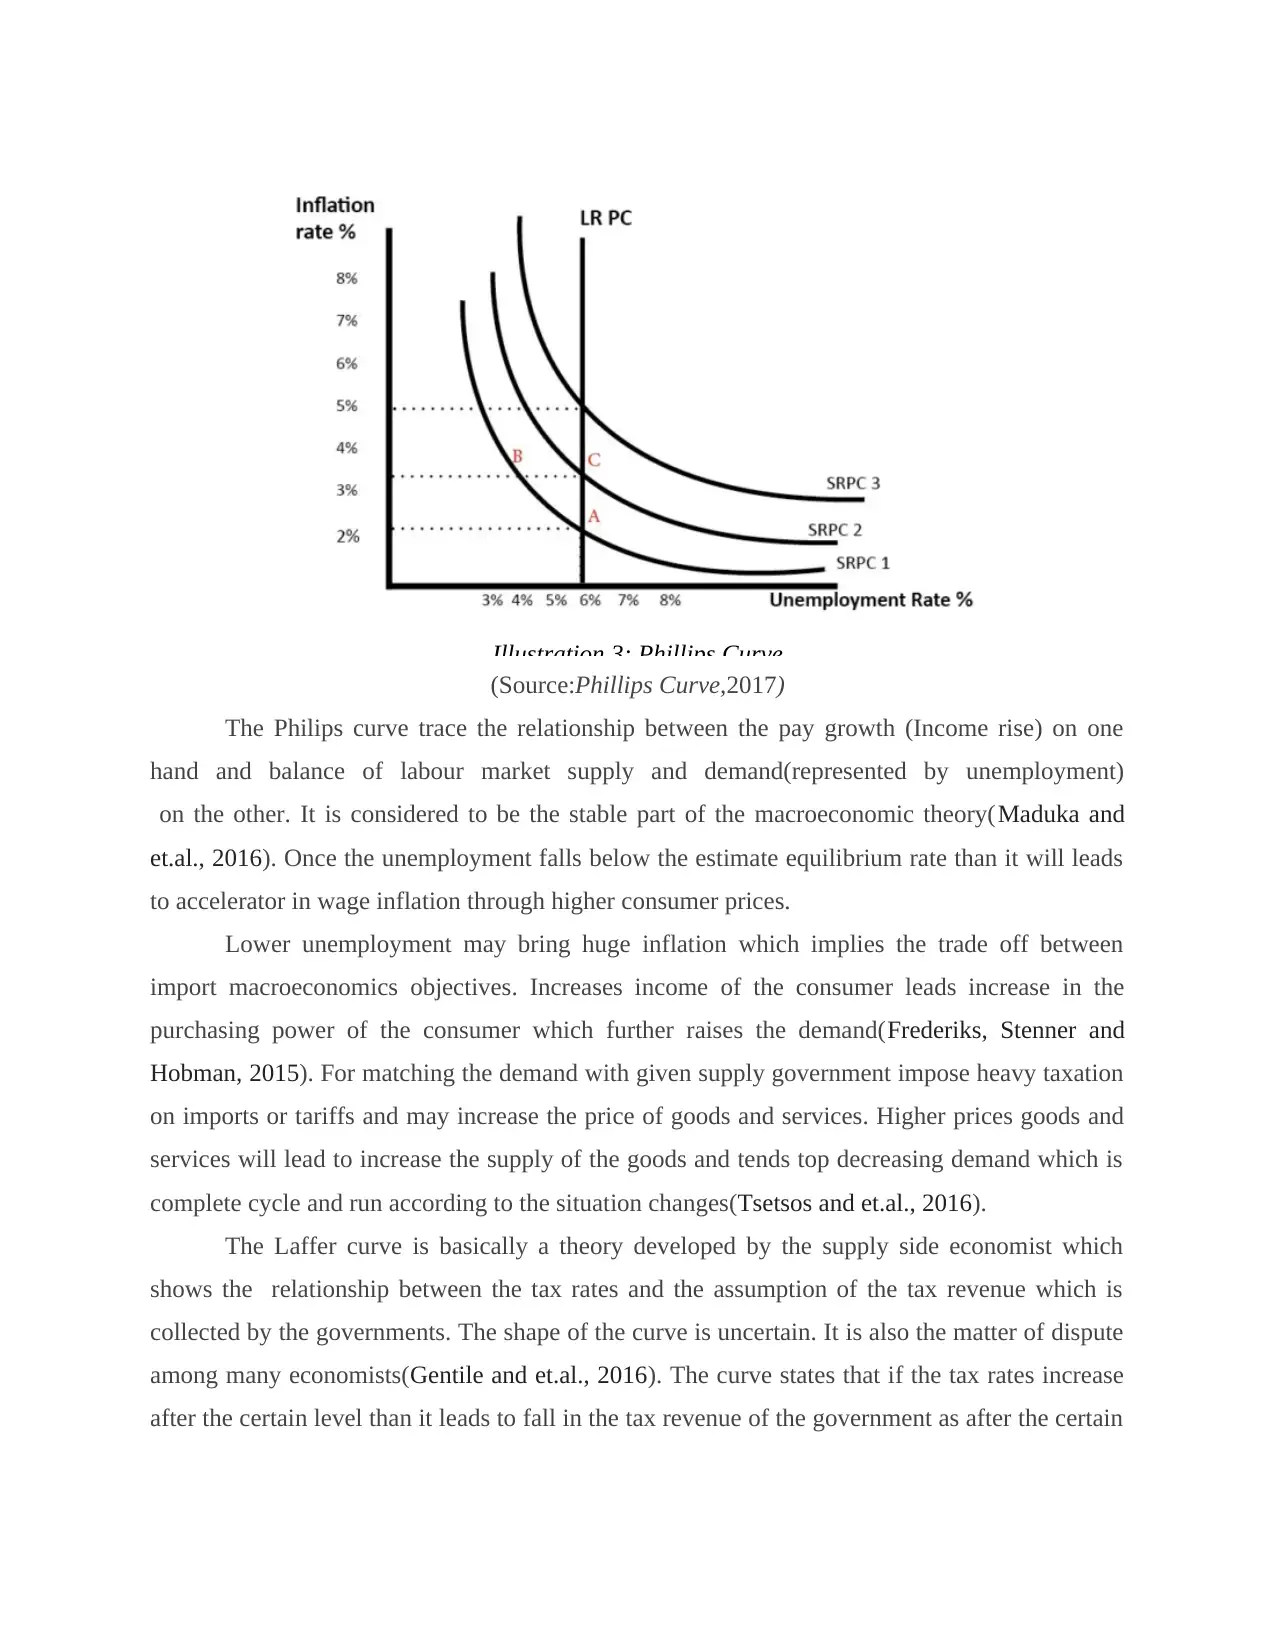
(Source:Phillips Curve,2017)
The Philips curve trace the relationship between the pay growth (Income rise) on one
hand and balance of labour market supply and demand(represented by unemployment)
on the other. It is considered to be the stable part of the macroeconomic theory(Maduka and
et.al., 2016). Once the unemployment falls below the estimate equilibrium rate than it will leads
to accelerator in wage inflation through higher consumer prices.
Lower unemployment may bring huge inflation which implies the trade off between
import macroeconomics objectives. Increases income of the consumer leads increase in the
purchasing power of the consumer which further raises the demand(Frederiks, Stenner and
Hobman, 2015). For matching the demand with given supply government impose heavy taxation
on imports or tariffs and may increase the price of goods and services. Higher prices goods and
services will lead to increase the supply of the goods and tends top decreasing demand which is
complete cycle and run according to the situation changes(Tsetsos and et.al., 2016).
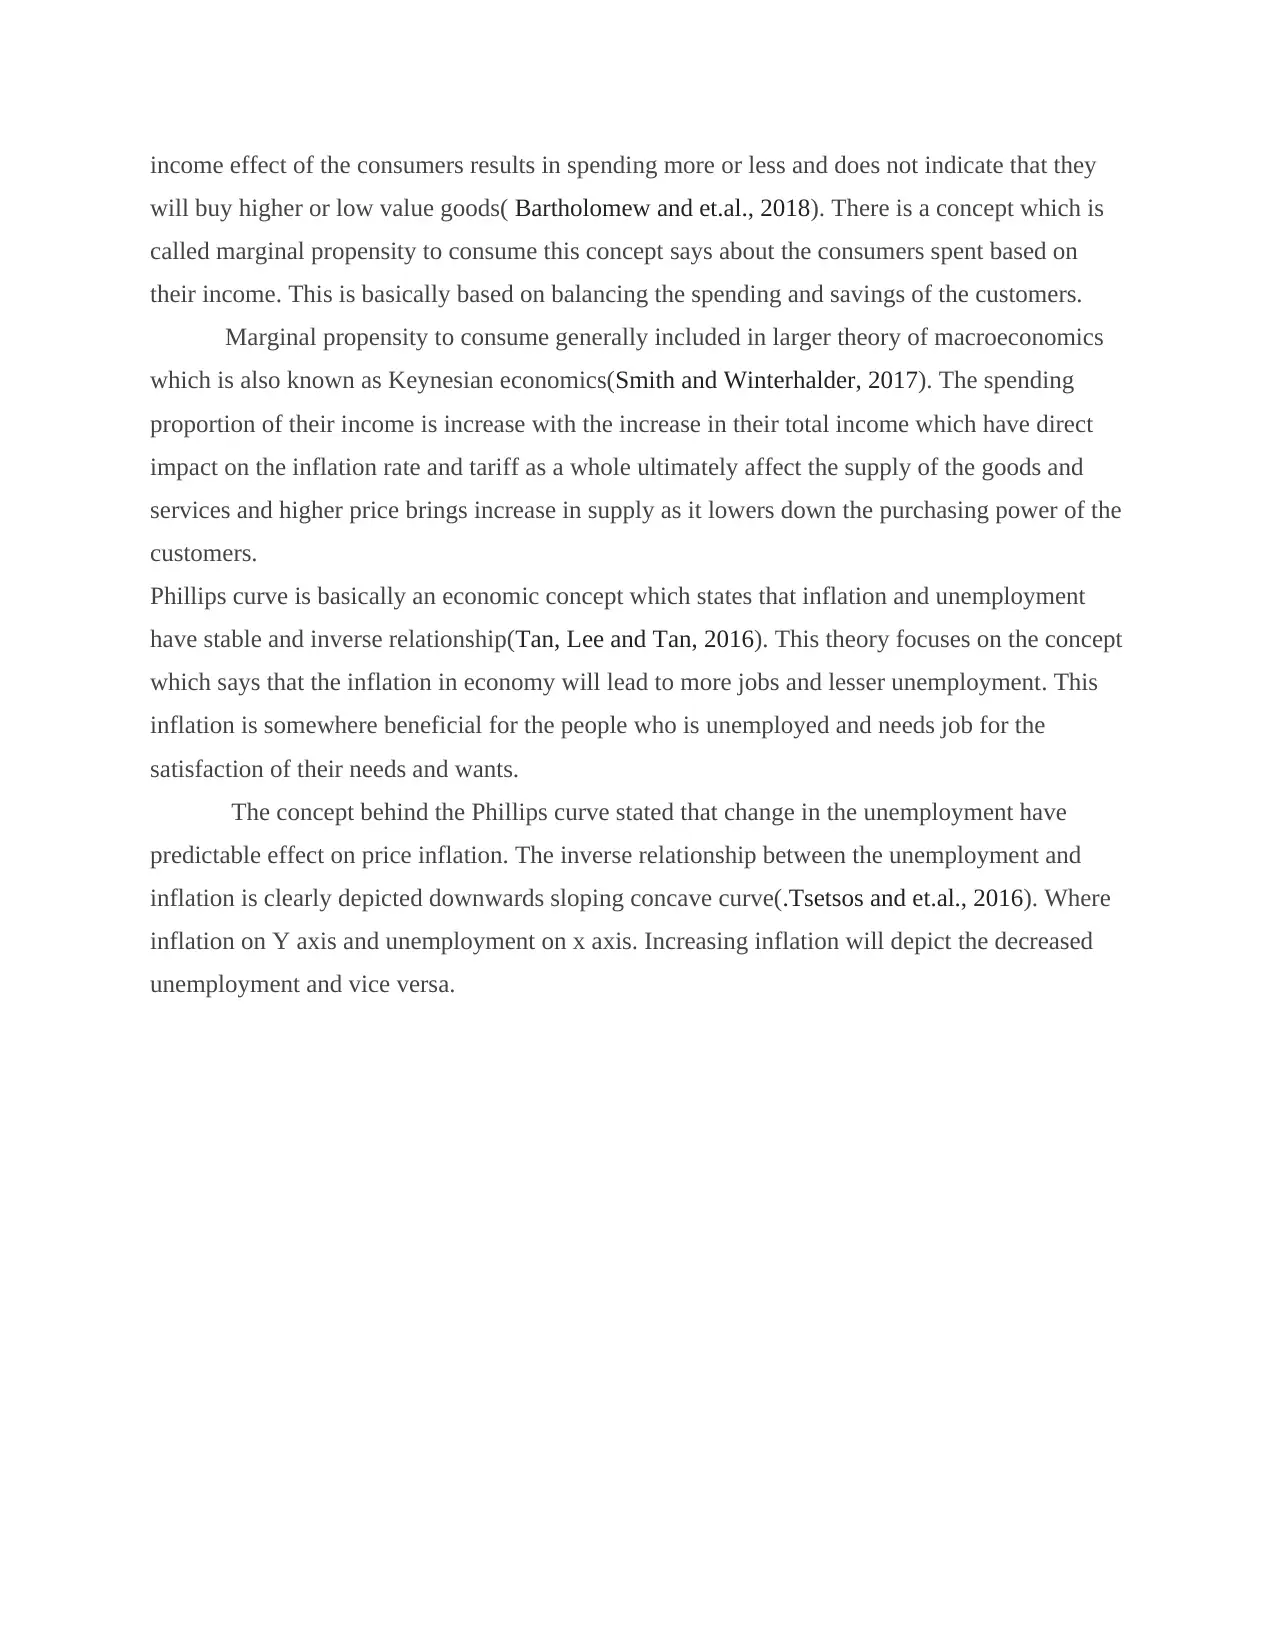
The Laffer curve is basically a theory developed by the supply side economist which
shows the relationship between the tax rates and the assumption of the tax revenue which is
collected by the governments. The shape of the curve is uncertain. It is also the matter of dispute
among many economists(Gentile and et.al., 2016). The curve states that if the tax rates increase
after the certain level than it leads to fall in the tax revenue of the government as after the certain
Illustration 3: Phillips Curve
The Philips curve trace the relationship between the pay growth (Income rise) on one
hand and balance of labour market supply and demand(represented by unemployment)
on the other. It is considered to be the stable part of the macroeconomic theory(Maduka and
et.al., 2016). Once the unemployment falls below the estimate equilibrium rate than it will leads
to accelerator in wage inflation through higher consumer prices.
Lower unemployment may bring huge inflation which implies the trade off between
import macroeconomics objectives. Increases income of the consumer leads increase in the
purchasing power of the consumer which further raises the demand(Frederiks, Stenner and
Hobman, 2015). For matching the demand with given supply government impose heavy taxation
on imports or tariffs and may increase the price of goods and services. Higher prices goods and
services will lead to increase the supply of the goods and tends top decreasing demand which is
complete cycle and run according to the situation changes(Tsetsos and et.al., 2016).
The Laffer curve is basically a theory developed by the supply side economist which
shows the relationship between the tax rates and the assumption of the tax revenue which is
collected by the governments. The shape of the curve is uncertain. It is also the matter of dispute
among many economists(Gentile and et.al., 2016). The curve states that if the tax rates increase
after the certain level than it leads to fall in the tax revenue of the government as after the certain
Illustration 3: Phillips Curve
Paraphrase This Document
Need a fresh take? Get an instant paraphrase of this document with our AI Paraphraser
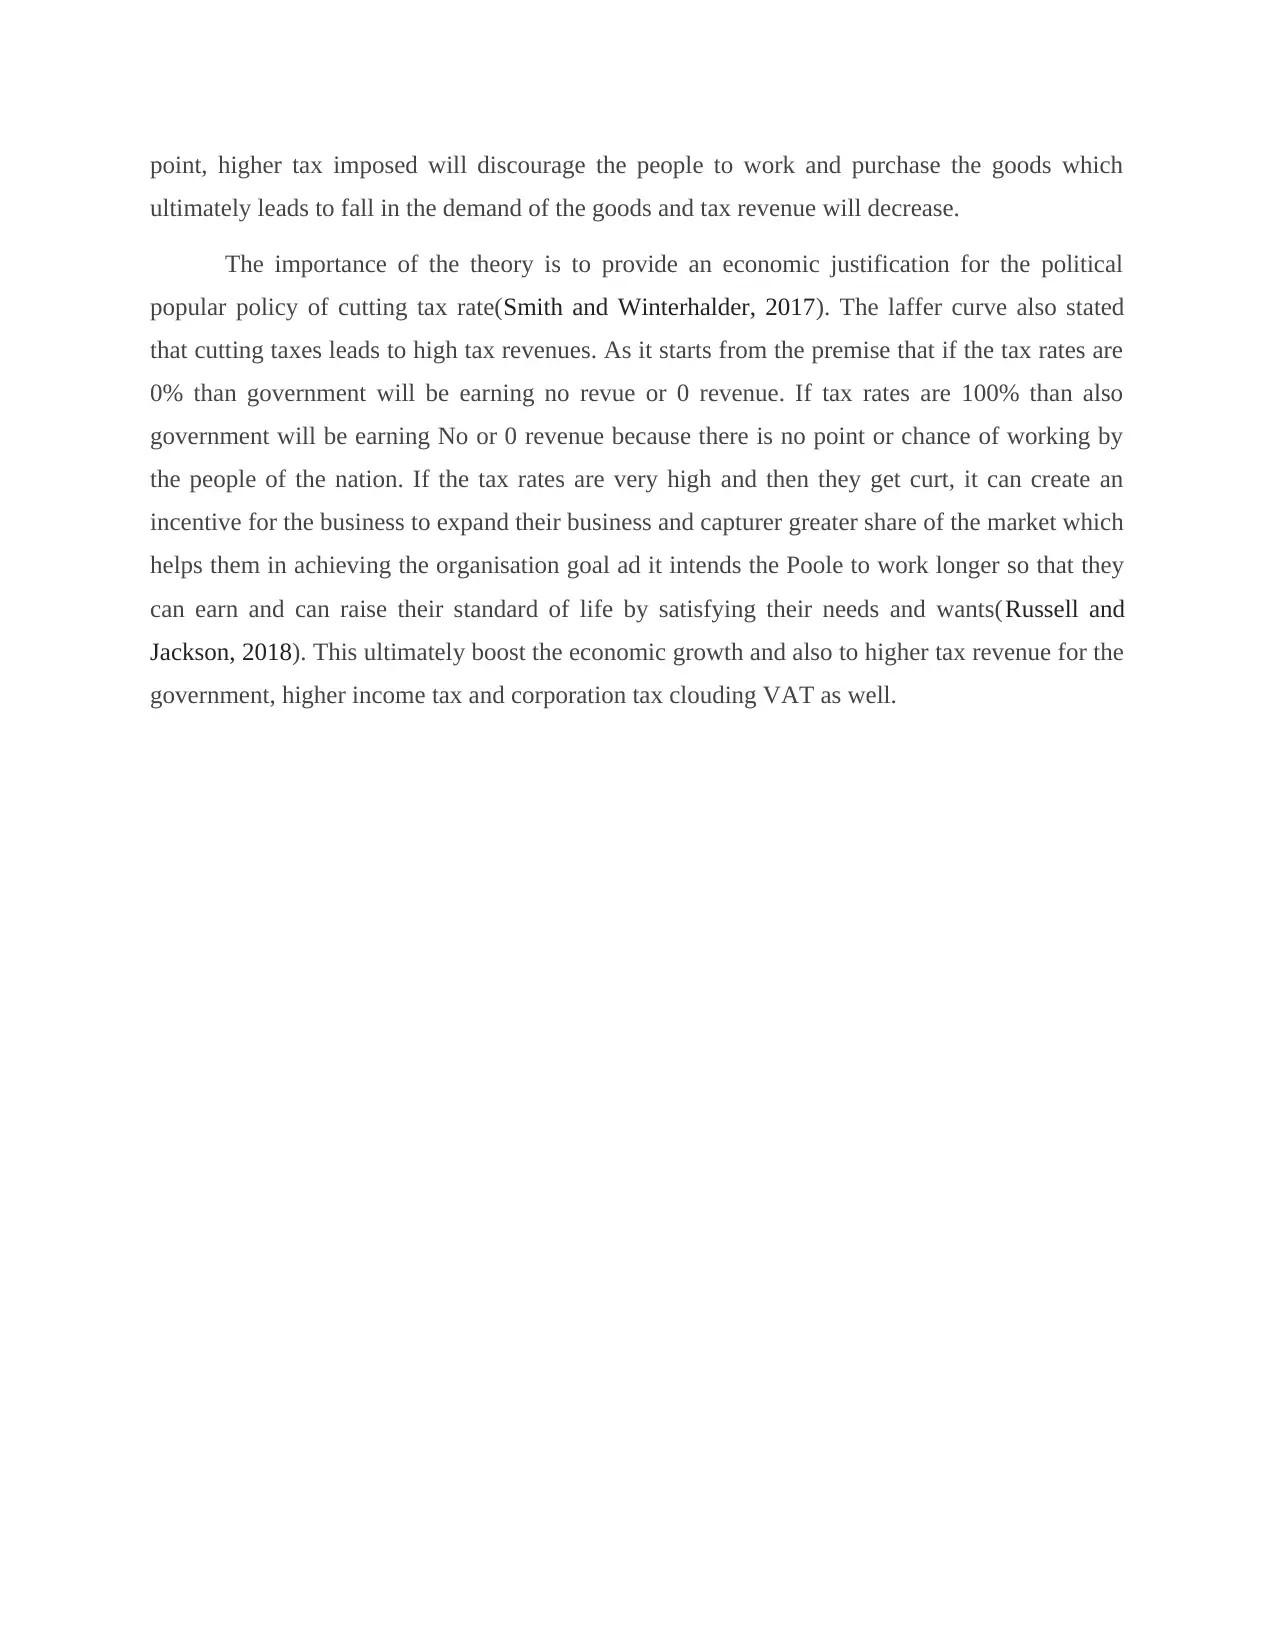
point, higher tax imposed will discourage the people to work and purchase the goods which
ultimately leads to fall in the demand of the goods and tax revenue will decrease.
The importance of the theory is to provide an economic justification for the political
popular policy of cutting tax rate(Smith and Winterhalder, 2017). The laffer curve also stated
that cutting taxes leads to high tax revenues. As it starts from the premise that if the tax rates are
0% than government will be earning no revue or 0 revenue. If tax rates are 100% than also
government will be earning No or 0 revenue because there is no point or chance of working by
the people of the nation. If the tax rates are very high and then they get curt, it can create an
incentive for the business to expand their business and capturer greater share of the market which
helps them in achieving the organisation goal ad it intends the Poole to work longer so that they
can earn and can raise their standard of life by satisfying their needs and wants(Russell and
Jackson, 2018). This ultimately boost the economic growth and also to higher tax revenue for the
government, higher income tax and corporation tax clouding VAT as well.
(Source:The Laffer Curve,2019)
The impact of the different predictions for income development, inflation rate development and
tariff rate development on the potential demand of Schmeckt Gut with a multiple
regression analysis using data
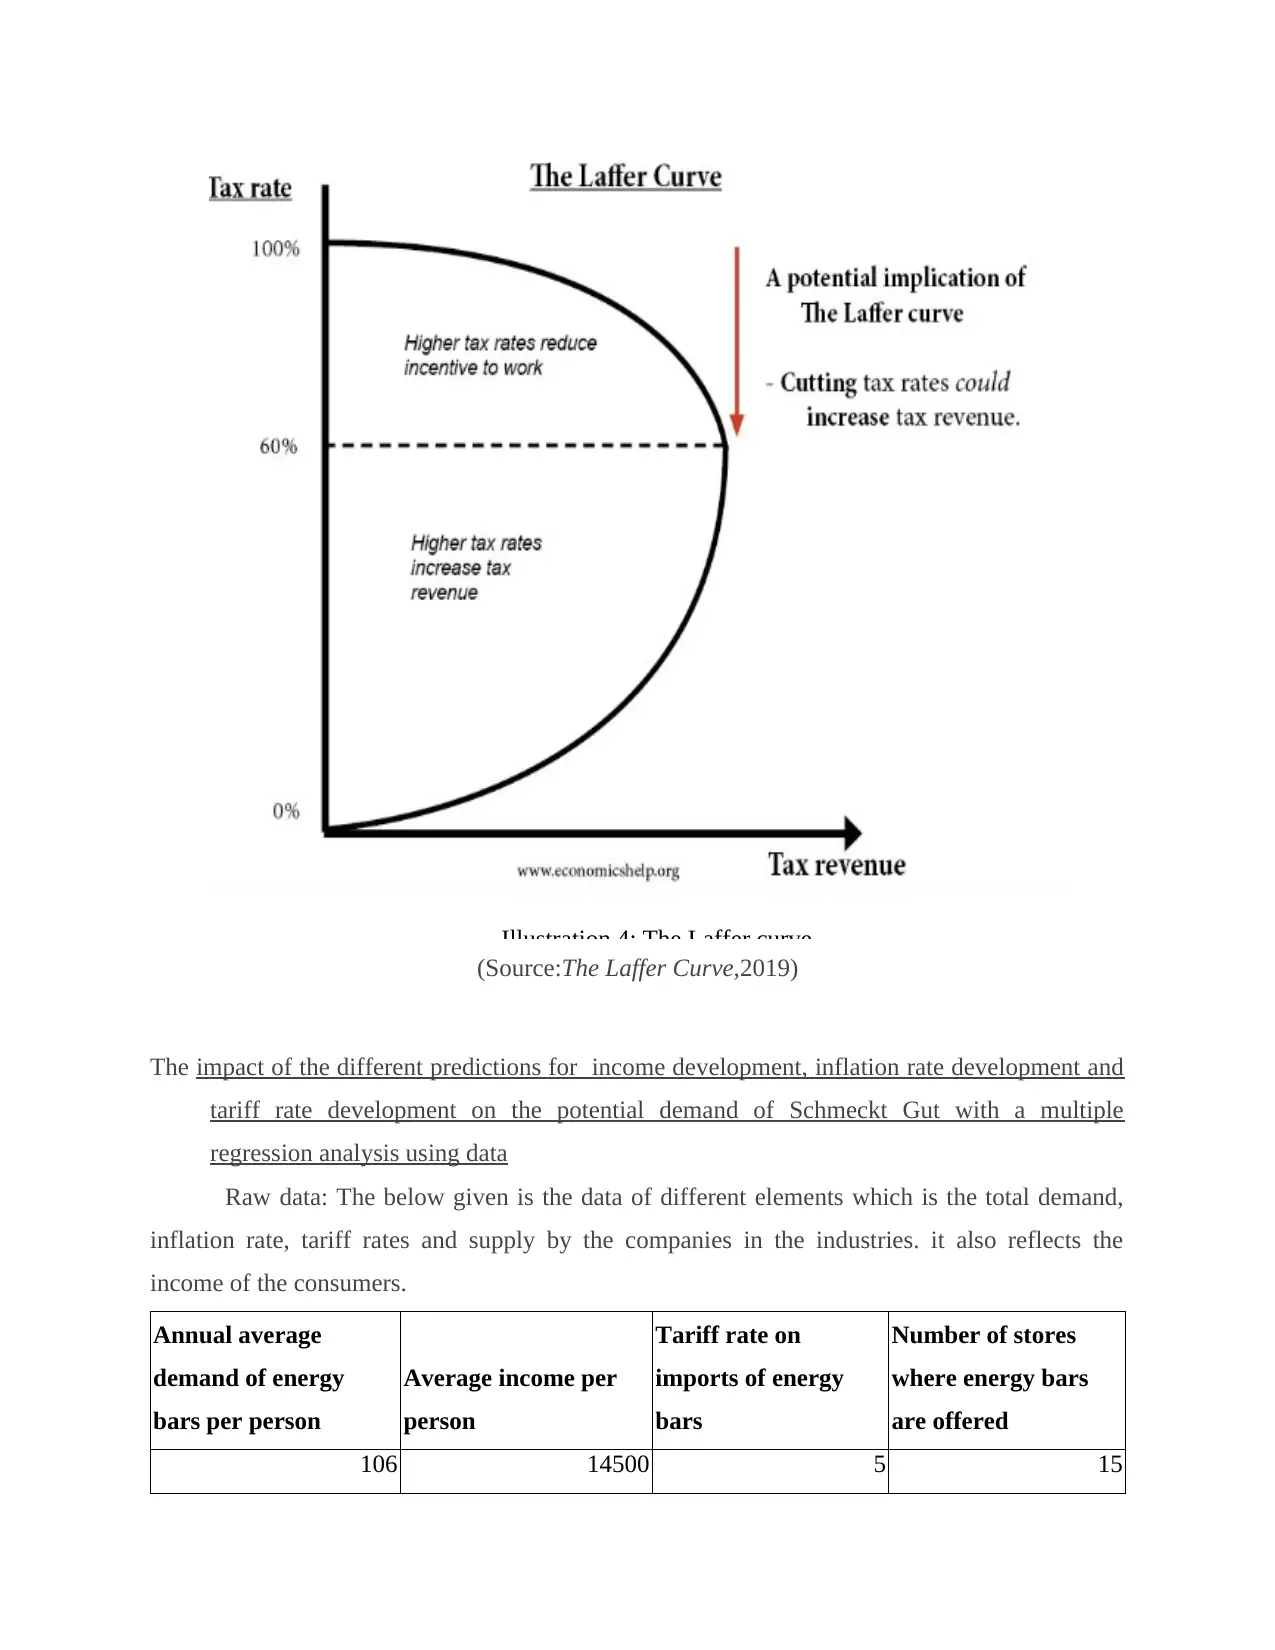
Raw data: The below given is the data of different elements which is the total demand,
inflation rate, tariff rates and supply by the companies in the industries. it also reflects the
income of the consumers.
Annual average
demand of energy
bars per person
Average income per
person
Tariff rate on
imports of energy
bars
Number of stores
where energy bars
are offered
106 14500 5 15
Illustration 4: The Laffer curve
The impact of the different predictions for income development, inflation rate development and
tariff rate development on the potential demand of Schmeckt Gut with a multiple
regression analysis using data
Raw data: The below given is the data of different elements which is the total demand,
inflation rate, tariff rates and supply by the companies in the industries. it also reflects the
income of the consumers.
Annual average
demand of energy
bars per person
Average income per
person
Tariff rate on
imports of energy
bars
Number of stores
where energy bars
are offered
106 14500 5 15
Illustration 4: The Laffer curve
⊘ This is a preview!⊘
Do you want full access?
Subscribe today to unlock all pages.
Trusted by 1+ million students worldwide
1 out of 20
Related Documents


Your All-in-One AI-Powered Toolkit for Academic Success.
+13062052269
info@desklib.com
Available 24*7 on WhatsApp / Email
![[object Object]](/_next/static/media/star-bottom.7253800d.svg)
Unlock your academic potential
Copyright © 2020–2026 A2Z Services. All Rights Reserved. Developed and managed by ZUCOL.