Economic Principles Assignment: Application of Economic Principles
VerifiedAdded on 2022/11/14
|16
|2824
|409
Report
AI Summary
This report analyzes several economic principles through the lens of real-world scenarios. Task 1 examines the impact of a bounty scheme on cane toad populations, applying supply and demand analysis. Task 2 explores the economic incentives and consequences of the international drug trade, particularly focusing on the impact of NAFTA on the Mexican corn market and its potential link to the production of illegal crops like marijuana and poppy plants. The analysis includes the application of supply and demand models, the impact of cartels, and the relationship between corn prices and the value of marijuana seized. Task 3 investigates the effects of political ties on economic welfare, using a labor market model to illustrate the consequences of discrimination. Finally, Task 4 assesses the impact of carbon taxes on carbon emissions, using data from Sweden to analyze fuel consumption patterns and applying supply and demand analysis. The report concludes with policy recommendations to mitigate unintended consequences and enhance economic welfare.
Running head: ECONOMIC PRINCIPLES
Economic Principles
Name of the Student
Name of the University
Course ID
Economic Principles
Name of the Student
Name of the University
Course ID
Paraphrase This Document
Need a fresh take? Get an instant paraphrase of this document with our AI Paraphraser
1ECONOMIC PRINCIPLES
Table of Contents
Task 1: A bounty on the toad.....................................................................................................2
Answer a.................................................................................................................................2
Answer b................................................................................................................................2
Task 2: Economic incentives and international drug trade........................................................2
Answer a.................................................................................................................................2
Answer b................................................................................................................................4
Answer c.....................................................................................................................................5
Answer d....................................................................................................................................6
Answer e.................................................................................................................................7
Answer f.................................................................................................................................7
Task 3: Political ties and economic welfare...............................................................................8
Answer a.................................................................................................................................8
Answer b................................................................................................................................9
Task 4: Can carbon taxes curtail carbon emission...................................................................10
Answer b..............................................................................................................................12
Answer c...............................................................................................................................12
References................................................................................................................................14
2ECONOMIC PRINCIPLES
Task 1: A bounty on the toad
Answer a
The bounty scheme offering a fixed dollar amount for each cane toad killed is likely
to increase the numbers of cane toads killed. With the expectation of obtaining the bonus or
bounty people will be more interested to kill cane toad (McKenzie and Lee 2016).
Answer b
The bounty is expected to lower the cane toad population. The bounty given to kill the
cane toads will assist pastoralists and farmers to recover some portion cost for killing toads.
The bounty works as an incentive to conduct destructive work than would otherwise occur to
kill cane toads (Cowen and Tabarrok 2018). The bounty therefore should necessarily reduce
the population of cane toads. There are however arguments against such bounty scheme. This
kind of policy is easily vulnerable to fraud, exploitation and misinterpretation.
Task 2: Economic incentives and international drug trade
Answer a
⊘ This is a preview!⊘
Do you want full access?
Subscribe today to unlock all pages.
Trusted by 1+ million students worldwide
3ECONOMIC PRINCIPLES
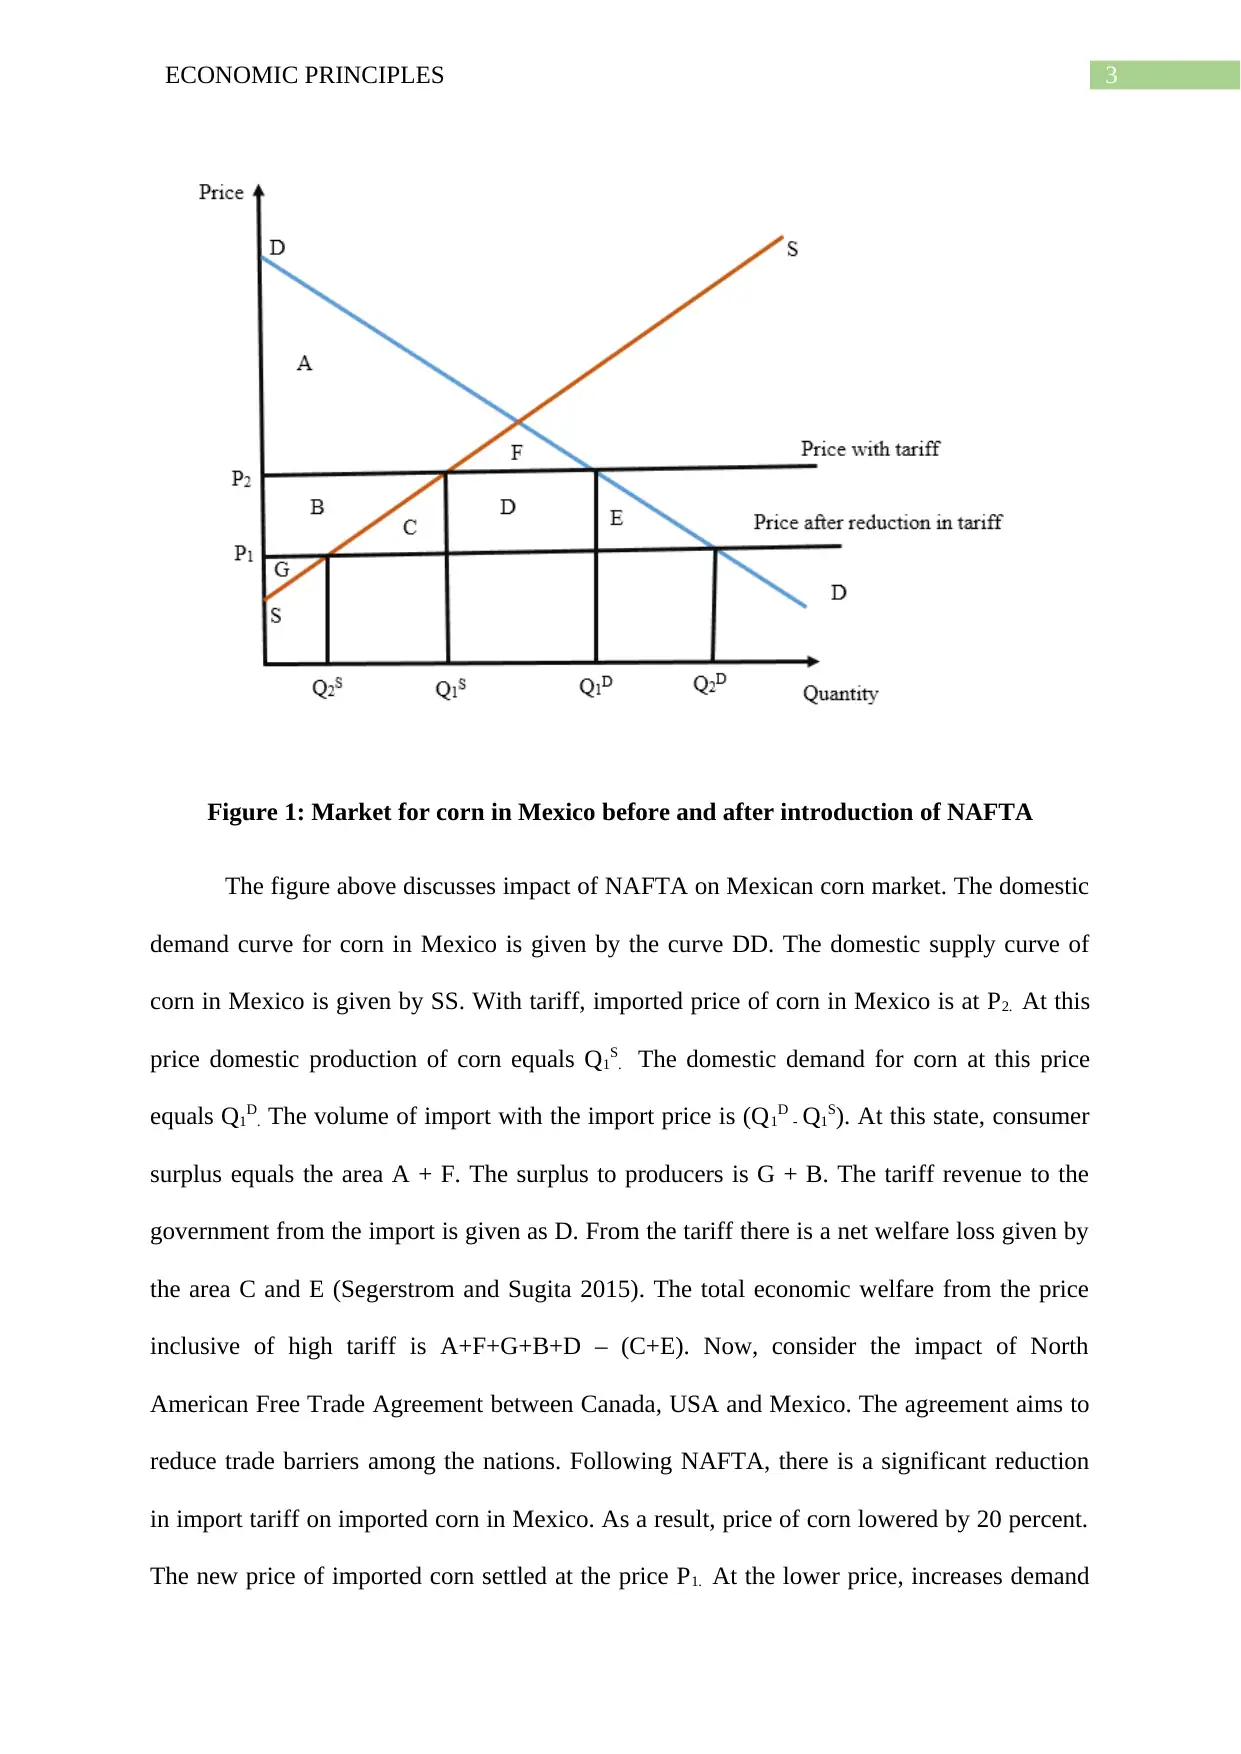
Figure 1: Market for corn in Mexico before and after introduction of NAFTA
The figure above discusses impact of NAFTA on Mexican corn market. The domestic
demand curve for corn in Mexico is given by the curve DD. The domestic supply curve of
corn in Mexico is given by SS. With tariff, imported price of corn in Mexico is at P2. At this
price domestic production of corn equals Q1S. The domestic demand for corn at this price
equals Q1D. The volume of import with the import price is (Q1D - Q1S). At this state, consumer
surplus equals the area A + F. The surplus to producers is G + B. The tariff revenue to the
government from the import is given as D. From the tariff there is a net welfare loss given by
the area C and E (Segerstrom and Sugita 2015). The total economic welfare from the price
inclusive of high tariff is A+F+G+B+D – (C+E). Now, consider the impact of North
American Free Trade Agreement between Canada, USA and Mexico. The agreement aims to
reduce trade barriers among the nations. Following NAFTA, there is a significant reduction
in import tariff on imported corn in Mexico. As a result, price of corn lowered by 20 percent.
The new price of imported corn settled at the price P1. At the lower price, increases demand
Paraphrase This Document
Need a fresh take? Get an instant paraphrase of this document with our AI Paraphraser
4ECONOMIC PRINCIPLES
for corn to Q2D. At the reduced price, supply of Corn in Mexico reduces to Q2S. The volume
of import increases to (Q2D – Q2S). The lower price increases surplus to consumer and
consumer surplus is given by the area A+B+C+D+E+F. The producer surplus decreases to
area G only (Devine et al. 2018). The total economic welfare is given by the area
A+B+C+D+E+F+G. The reduction in tariff thus increases economic welfare by eliminating
the deadweight loss resulted from tariff.
Answer b
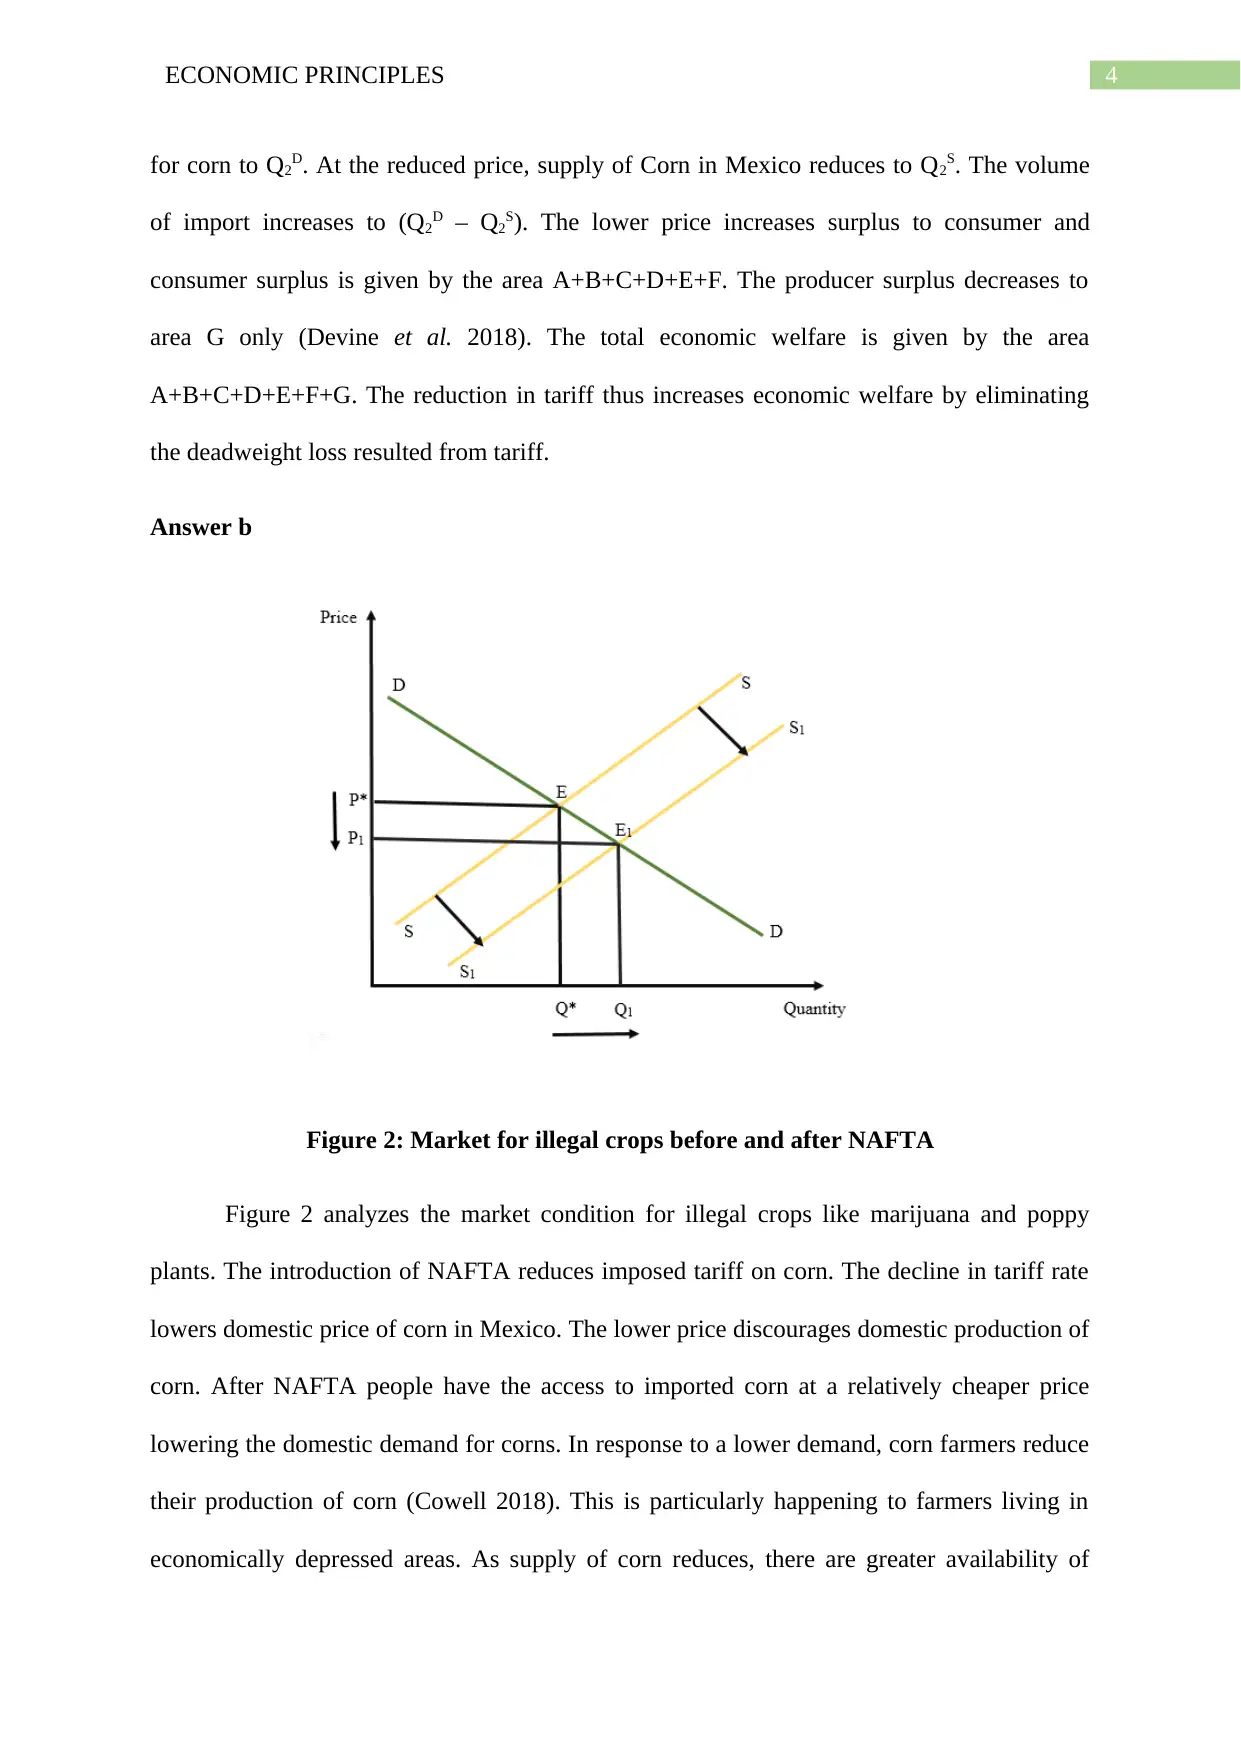
Figure 2: Market for illegal crops before and after NAFTA
Figure 2 analyzes the market condition for illegal crops like marijuana and poppy
plants. The introduction of NAFTA reduces imposed tariff on corn. The decline in tariff rate
lowers domestic price of corn in Mexico. The lower price discourages domestic production of
corn. After NAFTA people have the access to imported corn at a relatively cheaper price
lowering the domestic demand for corns. In response to a lower demand, corn farmers reduce
their production of corn (Cowell 2018). This is particularly happening to farmers living in
economically depressed areas. As supply of corn reduces, there are greater availability of
for corn to Q2D. At the reduced price, supply of Corn in Mexico reduces to Q2S. The volume
of import increases to (Q2D – Q2S). The lower price increases surplus to consumer and
consumer surplus is given by the area A+B+C+D+E+F. The producer surplus decreases to
area G only (Devine et al. 2018). The total economic welfare is given by the area
A+B+C+D+E+F+G. The reduction in tariff thus increases economic welfare by eliminating
the deadweight loss resulted from tariff.
Answer b
Figure 2: Market for illegal crops before and after NAFTA
Figure 2 analyzes the market condition for illegal crops like marijuana and poppy
plants. The introduction of NAFTA reduces imposed tariff on corn. The decline in tariff rate
lowers domestic price of corn in Mexico. The lower price discourages domestic production of
corn. After NAFTA people have the access to imported corn at a relatively cheaper price
lowering the domestic demand for corns. In response to a lower demand, corn farmers reduce
their production of corn (Cowell 2018). This is particularly happening to farmers living in
economically depressed areas. As supply of corn reduces, there are greater availability of
5ECONOMIC PRINCIPLES
lands for production of other crops. Since these farmers are able to use their land to grow
marijuana and poppy plants production of these crops increases. This is shown in the supply-
demand analysis of market for illegal drugs in the above figure. The initial demand and
supply of crops to produce illegal drug are given as DD and SS respectively. Equilibrium in
the market occurs at E determining equilibrium price and quantity of crops as P* and Q*
respectively. Now, increase in availability of land to produce illegal crops increases
production of illegal crops shifting the supply curve to the right to S1S1 (Pouw 2017).
Equilibrium in the market for illegal crops now shift downward to E1. The increased supply
lowers equilibrium price to P1 while increases equilibrium production to Q1.
Answer c
0.1 0.2 0.3 0.4 0.5 0.6 0.7
0.00
1.00
2.00
3.00
4.00
5.00
6.00
7.00
8.00
9.00
10.00
f(x) = − 4.68746220008003 x + 7.50389527992856
R² = 0.0763875135174312
Scatter plot
Corn Price
Value of Marijuana Seized
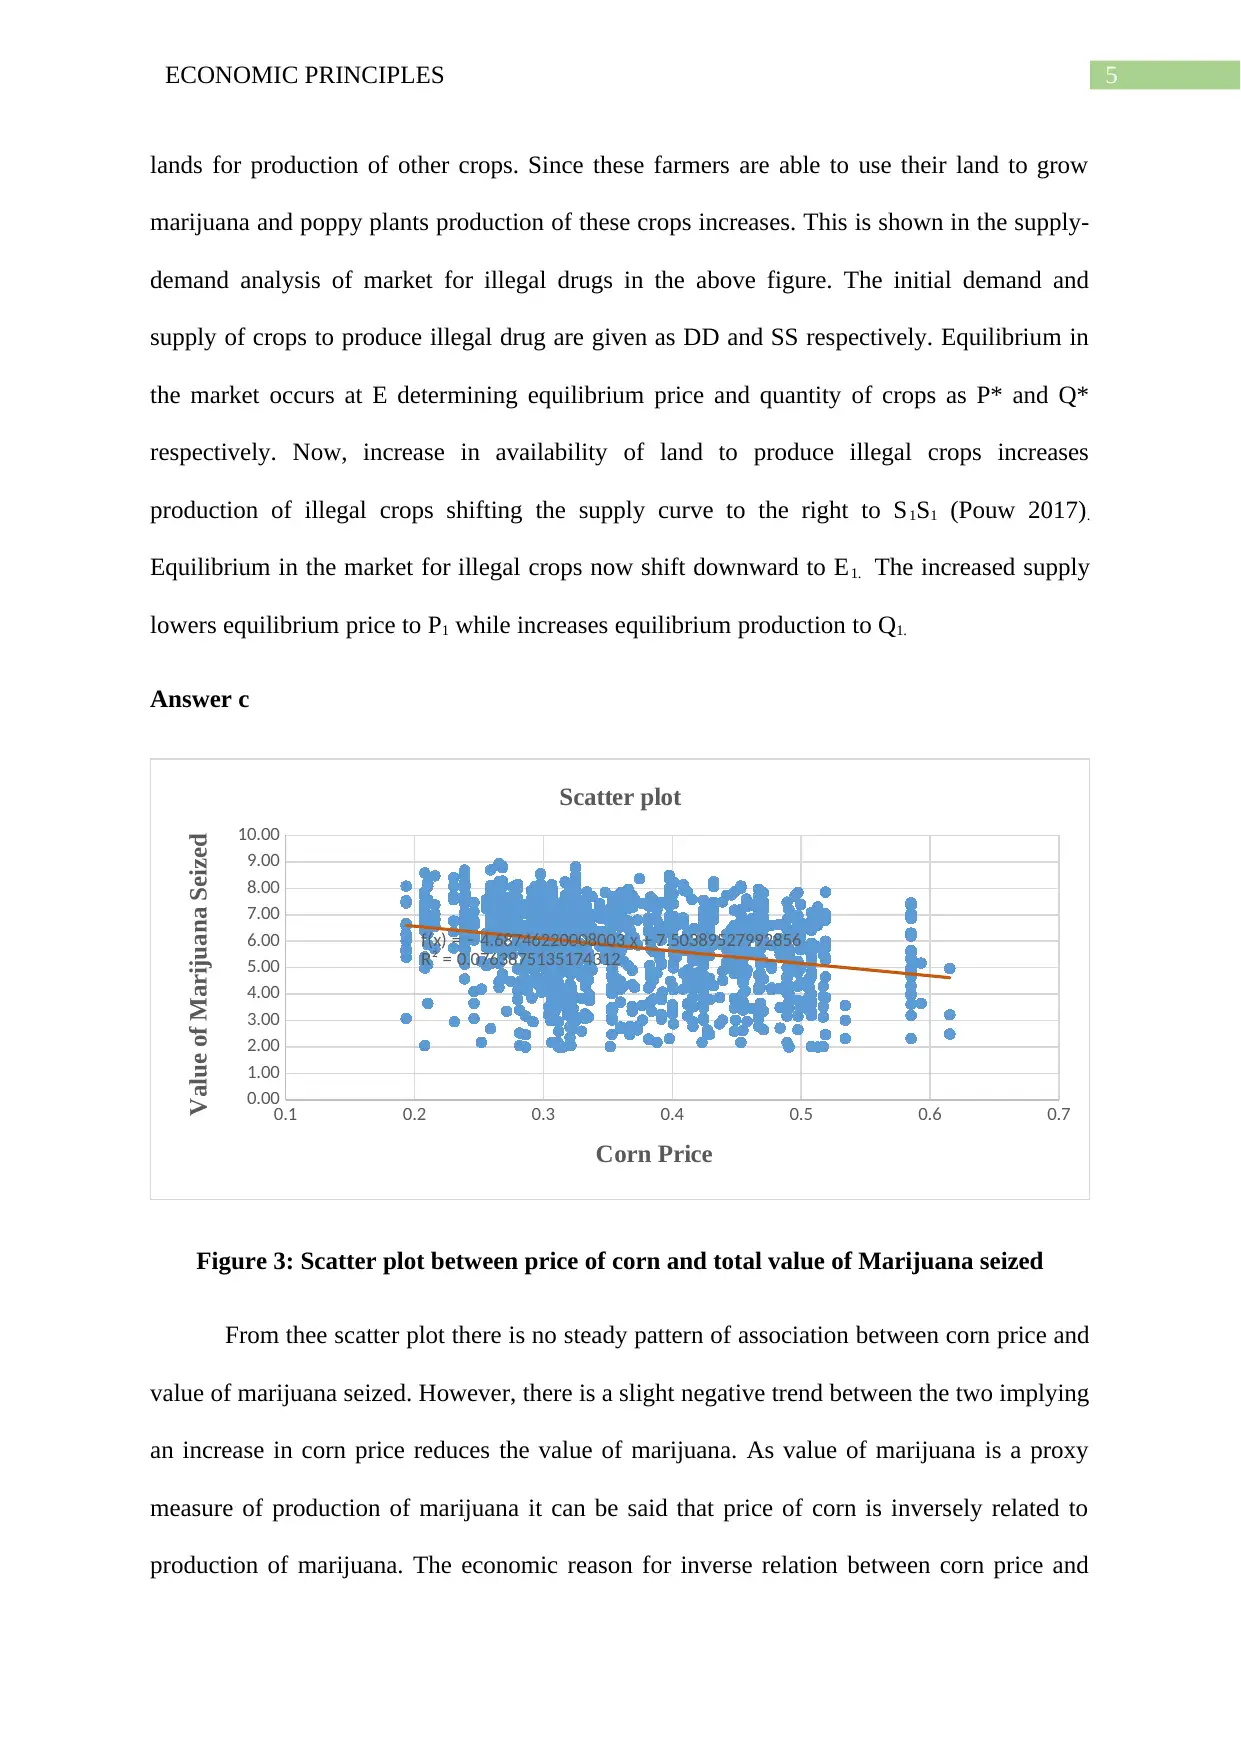
Figure 3: Scatter plot between price of corn and total value of Marijuana seized
From thee scatter plot there is no steady pattern of association between corn price and
value of marijuana seized. However, there is a slight negative trend between the two implying
an increase in corn price reduces the value of marijuana. As value of marijuana is a proxy
measure of production of marijuana it can be said that price of corn is inversely related to
production of marijuana. The economic reason for inverse relation between corn price and
lands for production of other crops. Since these farmers are able to use their land to grow
marijuana and poppy plants production of these crops increases. This is shown in the supply-
demand analysis of market for illegal drugs in the above figure. The initial demand and
supply of crops to produce illegal drug are given as DD and SS respectively. Equilibrium in
the market occurs at E determining equilibrium price and quantity of crops as P* and Q*
respectively. Now, increase in availability of land to produce illegal crops increases
production of illegal crops shifting the supply curve to the right to S1S1 (Pouw 2017).
Equilibrium in the market for illegal crops now shift downward to E1. The increased supply
lowers equilibrium price to P1 while increases equilibrium production to Q1.
Answer c
0.1 0.2 0.3 0.4 0.5 0.6 0.7
0.00
1.00
2.00
3.00
4.00
5.00
6.00
7.00
8.00
9.00
10.00
f(x) = − 4.68746220008003 x + 7.50389527992856
R² = 0.0763875135174312
Scatter plot
Corn Price
Value of Marijuana Seized
Figure 3: Scatter plot between price of corn and total value of Marijuana seized
From thee scatter plot there is no steady pattern of association between corn price and
value of marijuana seized. However, there is a slight negative trend between the two implying
an increase in corn price reduces the value of marijuana. As value of marijuana is a proxy
measure of production of marijuana it can be said that price of corn is inversely related to
production of marijuana. The economic reason for inverse relation between corn price and
⊘ This is a preview!⊘
Do you want full access?
Subscribe today to unlock all pages.
Trusted by 1+ million students worldwide
6ECONOMIC PRINCIPLES
marijuana production can be explained from relation between substitute goods in supply. A
given plot of land can be either for corn production or for marijuana production. Now, if corn
supply decreases more lands are available for marijuana production (Dube, García-Ponce and
Thom 2016). This increases production of marijuana.
Answer d
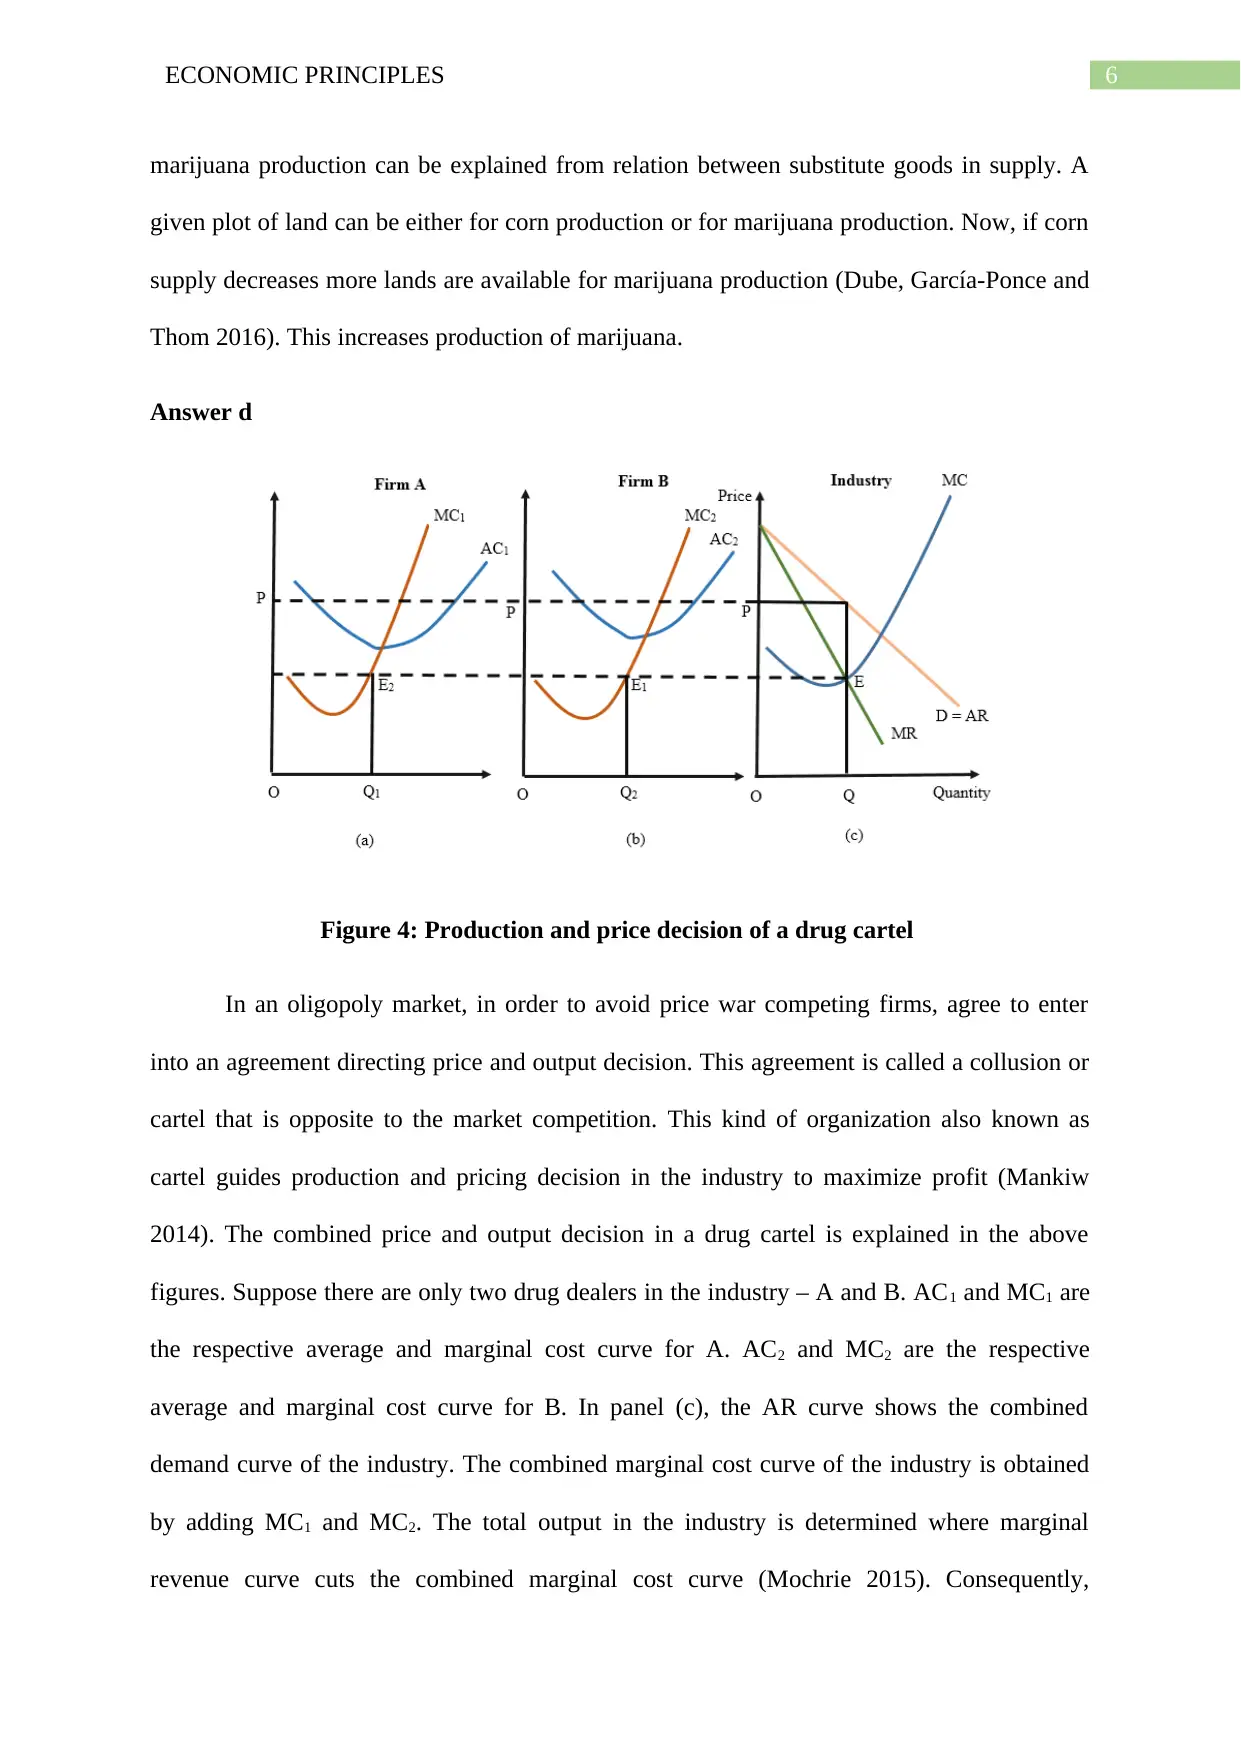
Figure 4: Production and price decision of a drug cartel
In an oligopoly market, in order to avoid price war competing firms, agree to enter
into an agreement directing price and output decision. This agreement is called a collusion or
cartel that is opposite to the market competition. This kind of organization also known as
cartel guides production and pricing decision in the industry to maximize profit (Mankiw
2014). The combined price and output decision in a drug cartel is explained in the above
figures. Suppose there are only two drug dealers in the industry – A and B. AC1 and MC1 are
the respective average and marginal cost curve for A. AC2 and MC2 are the respective
average and marginal cost curve for B. In panel (c), the AR curve shows the combined
demand curve of the industry. The combined marginal cost curve of the industry is obtained
by adding MC1 and MC2. The total output in the industry is determined where marginal
revenue curve cuts the combined marginal cost curve (Mochrie 2015). Consequently,
marijuana production can be explained from relation between substitute goods in supply. A
given plot of land can be either for corn production or for marijuana production. Now, if corn
supply decreases more lands are available for marijuana production (Dube, García-Ponce and
Thom 2016). This increases production of marijuana.
Answer d
Figure 4: Production and price decision of a drug cartel
In an oligopoly market, in order to avoid price war competing firms, agree to enter
into an agreement directing price and output decision. This agreement is called a collusion or
cartel that is opposite to the market competition. This kind of organization also known as
cartel guides production and pricing decision in the industry to maximize profit (Mankiw
2014). The combined price and output decision in a drug cartel is explained in the above
figures. Suppose there are only two drug dealers in the industry – A and B. AC1 and MC1 are
the respective average and marginal cost curve for A. AC2 and MC2 are the respective
average and marginal cost curve for B. In panel (c), the AR curve shows the combined
demand curve of the industry. The combined marginal cost curve of the industry is obtained
by adding MC1 and MC2. The total output in the industry is determined where marginal
revenue curve cuts the combined marginal cost curve (Mochrie 2015). Consequently,
Paraphrase This Document
Need a fresh take? Get an instant paraphrase of this document with our AI Paraphraser
7ECONOMIC PRINCIPLES
equilibrium in drug cartel is determined at the point E. Equilibrium price in the industry is OP
and equilibrium quantity of drugs in the industry is OQ. The equilibrium output of individual
drug dealers is determined from respective marginal cost curves. Lower the marginal cost
higher is the output. For the above case, the equilibrium quantity for A and B are OQ1 and
OQ2 respectively.
Answer e
A significant feature of drug cartel in Mexico is the cartel related violence. These
cartels either purchase drugs directly from the small holder or employ workers to produce
drugs on their own land. Cartels similar to other criminal organization engage in violent
activities in order to defend the claims to particular operation base. Now, production and
trade of illegal drugs and drug-cartel related violence are related to price of corn. If corn
price decreases following free trade agreement between USA, Canada and Mexico then this
discourages farmers to produce corns. Because of a decline in production of corn, there will
be an increase in production of illegal crops used to produce drugs (Gutiérrez-Romero and
Oviedo 2017). As production of drugs increases, there is a higher tendency of forming drug
cartel and therefore, increases in drug cartel related violence.
Answer f
i.
The analysis of impact of a lower tariff shows that a decline in corn price due to
elimination of tariff increases overall economic welfare (Parkin and Bade 2013). This is the
intended consequence of free trade.
ii.
8ECONOMIC PRINCIPLES
Allowing free trade of corn is associated with the unintended consequence of growth
of illegal drug market.
iii.
In order realize the benefits of free trade, government should focus on preventing the
spread of illegal drug market. Two recommended policies for doing this are discussed below
a)
On the supply side, government should enforce strict laws to reduce production of illegal
crops used for producing drugs. Strict penalties and punishment should be introduced to
restrict illegal drug production. Efficient monitoring is needed to catch those involved in
illegal drug production and trade.
b)
On the demand side, focus should be given on increasing awareness among people so that use
of drugs can be reduced. One policy to discourage consumption of illegal drugs is mass
media campaigns. Mass media campaigns are aimed at changing the norms related to drug
use, increasing awareness regarding adverse consequences of excessive consumption of
drugs, increasing skills of resisting drugs and others. Media avenues for increasing awareness
regarding use of drugs include newspaper, billboards, radio, television, music videos and
other interactive media.
Task 3: Political ties and economic welfare
Answer a
The given article illustrates impact of political ties on economic welfare. Because of
supporting petition against the President more than one million people faced a discrimination
and experienced a relatively lower wage and employment (Hsieh et al. 2011). The demand
⊘ This is a preview!⊘
Do you want full access?
Subscribe today to unlock all pages.
Trusted by 1+ million students worldwide
9ECONOMIC PRINCIPLES
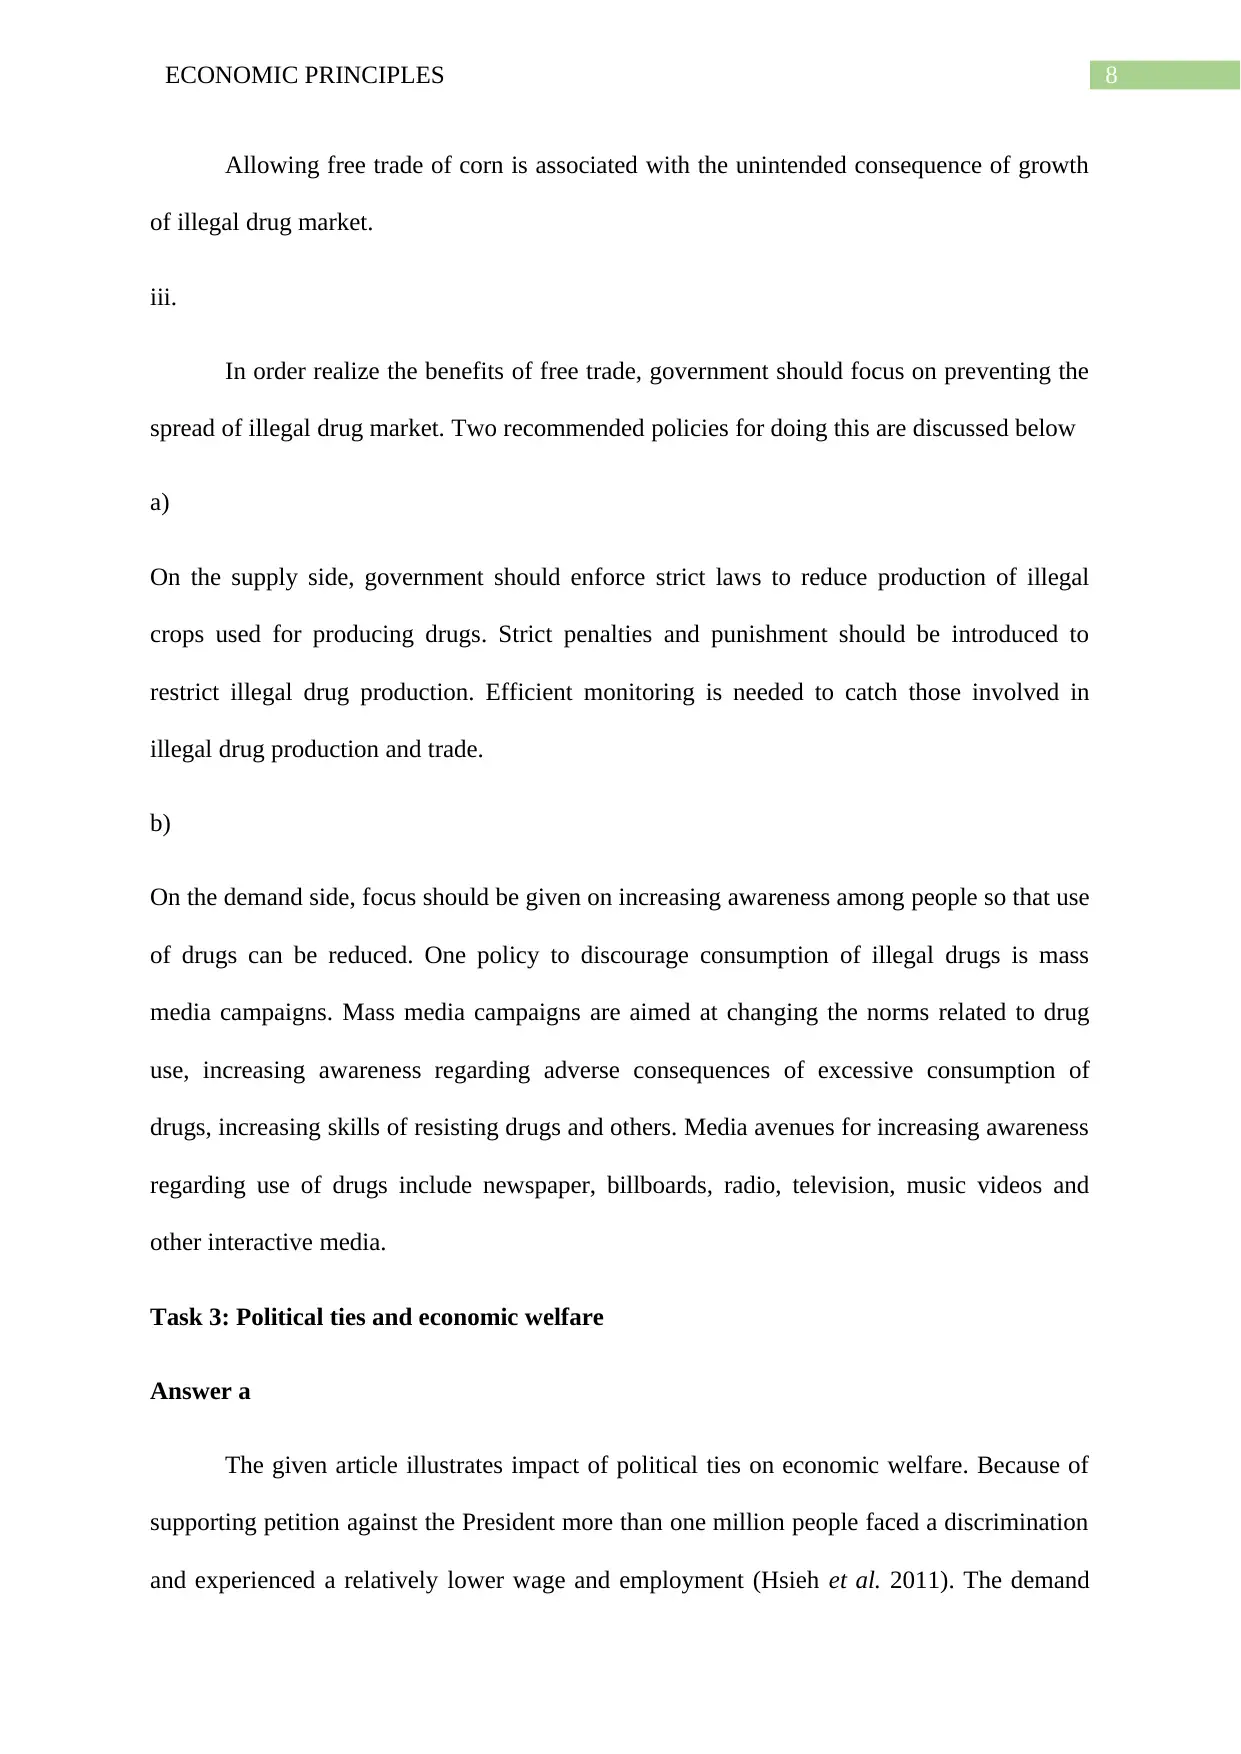
and supply dynamics in the labor market for those who voted against the president can be
used to understand the scenario.
Figure 5: Supply and Demand analysis of the labor market
In the above figure LD shows the labor demand and LS shows the labor supply. Those
who signed petition to remove the President experienced a decline in employment because of
political ties. This shifts the labor demand curve inward to LD1 shifting equilibrium from E to
E1. The group of workers who voted against the President therefore experienced a lower wage
at W1.
Answer b
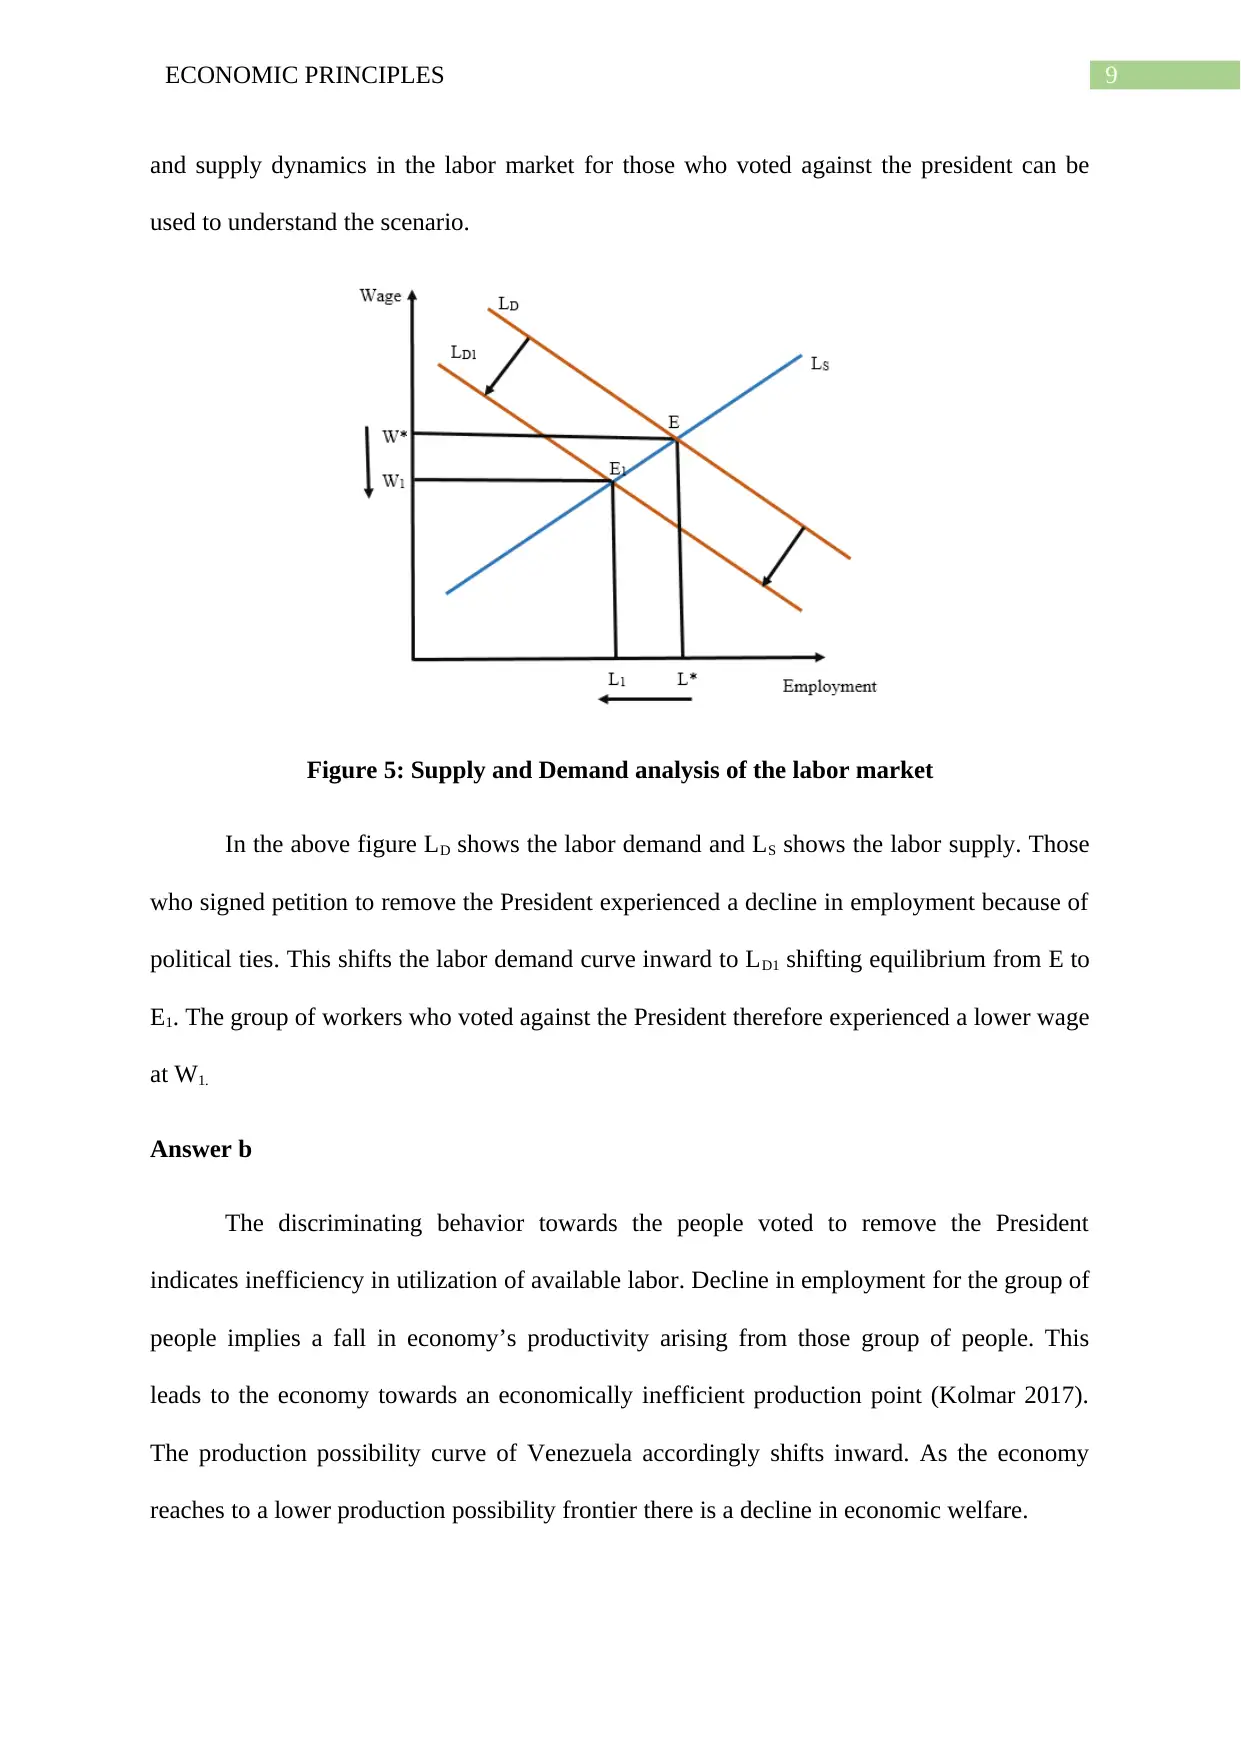
The discriminating behavior towards the people voted to remove the President
indicates inefficiency in utilization of available labor. Decline in employment for the group of
people implies a fall in economy’s productivity arising from those group of people. This
leads to the economy towards an economically inefficient production point (Kolmar 2017).
The production possibility curve of Venezuela accordingly shifts inward. As the economy
reaches to a lower production possibility frontier there is a decline in economic welfare.
and supply dynamics in the labor market for those who voted against the president can be
used to understand the scenario.
Figure 5: Supply and Demand analysis of the labor market
In the above figure LD shows the labor demand and LS shows the labor supply. Those
who signed petition to remove the President experienced a decline in employment because of
political ties. This shifts the labor demand curve inward to LD1 shifting equilibrium from E to
E1. The group of workers who voted against the President therefore experienced a lower wage
at W1.
Answer b
The discriminating behavior towards the people voted to remove the President
indicates inefficiency in utilization of available labor. Decline in employment for the group of
people implies a fall in economy’s productivity arising from those group of people. This
leads to the economy towards an economically inefficient production point (Kolmar 2017).
The production possibility curve of Venezuela accordingly shifts inward. As the economy
reaches to a lower production possibility frontier there is a decline in economic welfare.
Paraphrase This Document
Need a fresh take? Get an instant paraphrase of this document with our AI Paraphraser
10ECONOMIC PRINCIPLES
Figure 5: Production possibilities and economic welfare in Venezuela
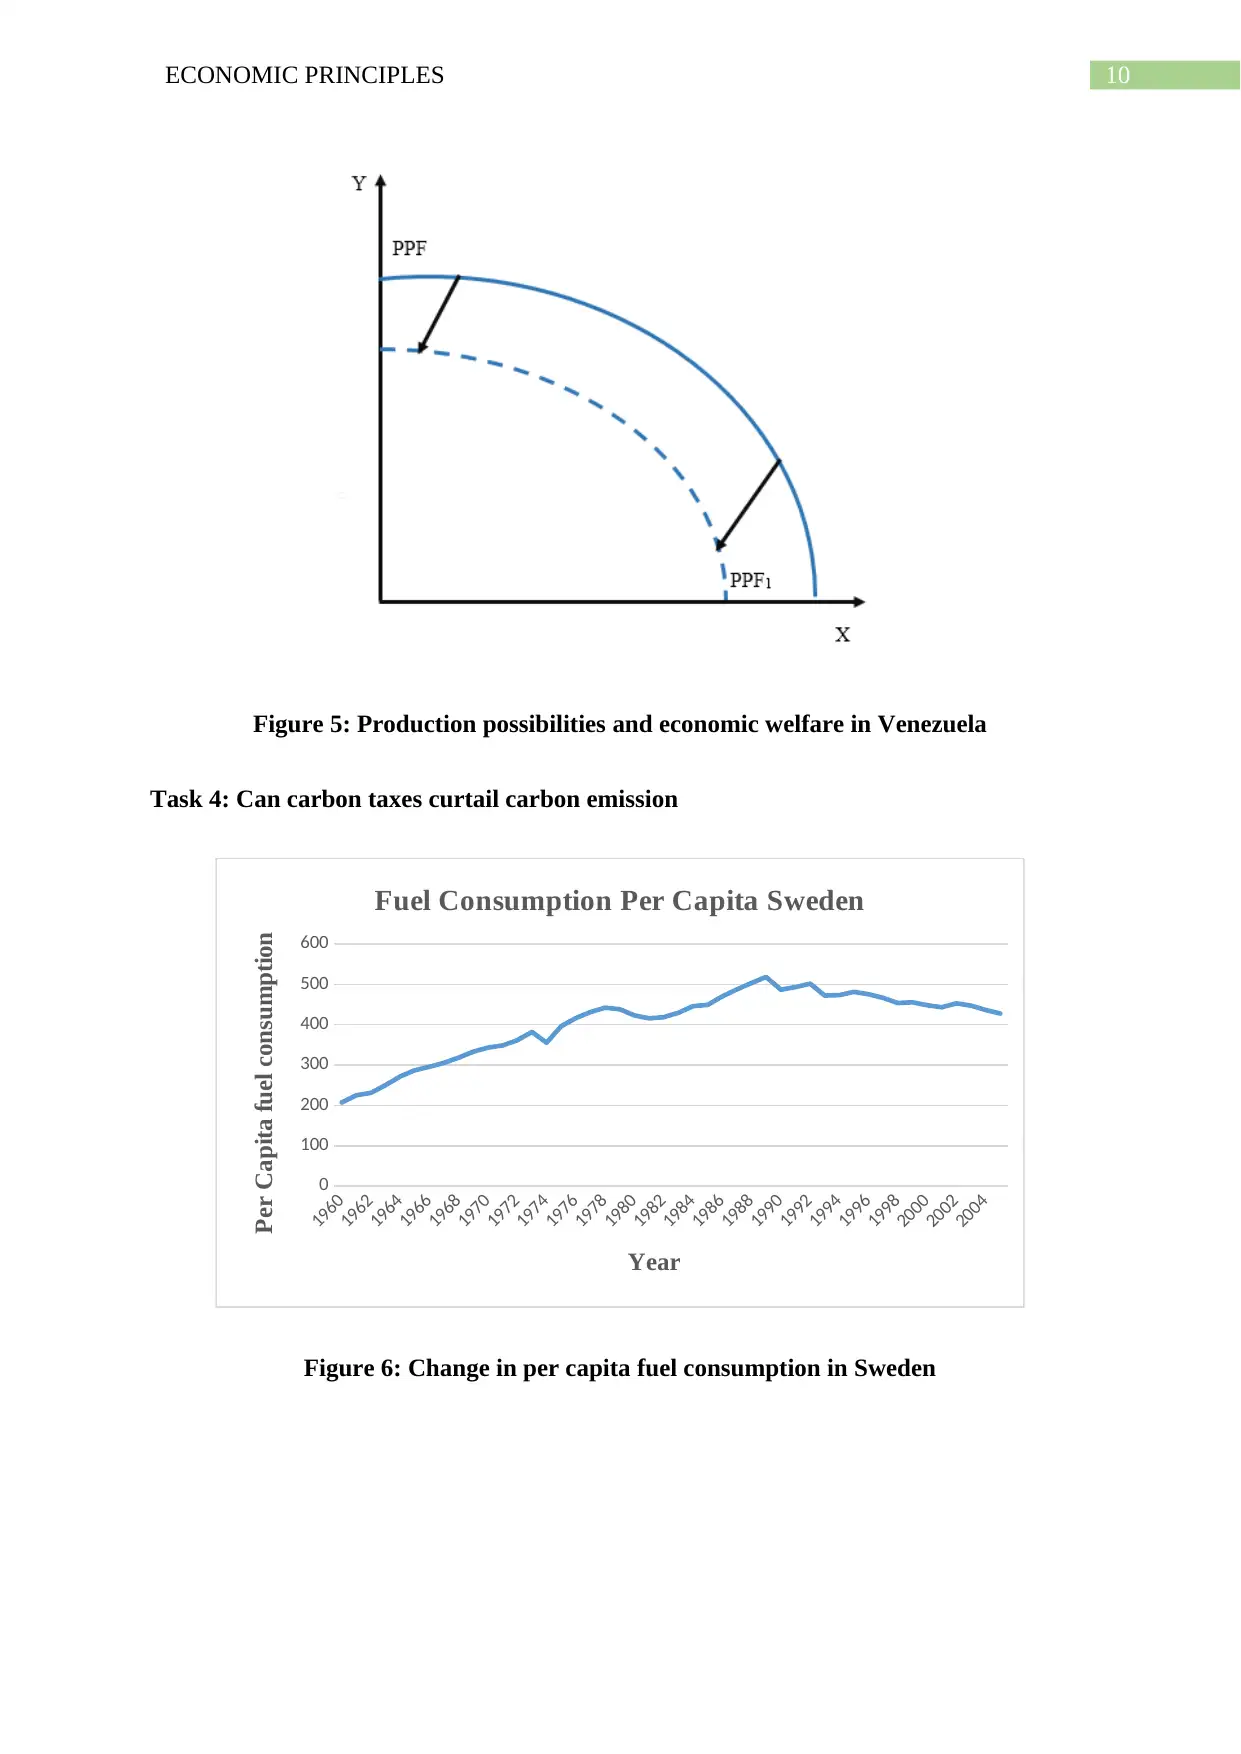
Task 4: Can carbon taxes curtail carbon emission
1960
1962
1964
1966
1968
1970
1972
1974
1976
1978
1980
1982
1984
1986
1988
1990
1992
1994
1996
1998
2000
2002
2004
0
100
200
300
400
500
600
Fuel Consumption Per Capita Sweden
Year
Per Capita fuel consumption
Figure 6: Change in per capita fuel consumption in Sweden
Figure 5: Production possibilities and economic welfare in Venezuela
Task 4: Can carbon taxes curtail carbon emission
1960
1962
1964
1966
1968
1970
1972
1974
1976
1978
1980
1982
1984
1986
1988
1990
1992
1994
1996
1998
2000
2002
2004
0
100
200
300
400
500
600
Fuel Consumption Per Capita Sweden
Year
Per Capita fuel consumption
Figure 6: Change in per capita fuel consumption in Sweden
11ECONOMIC PRINCIPLES
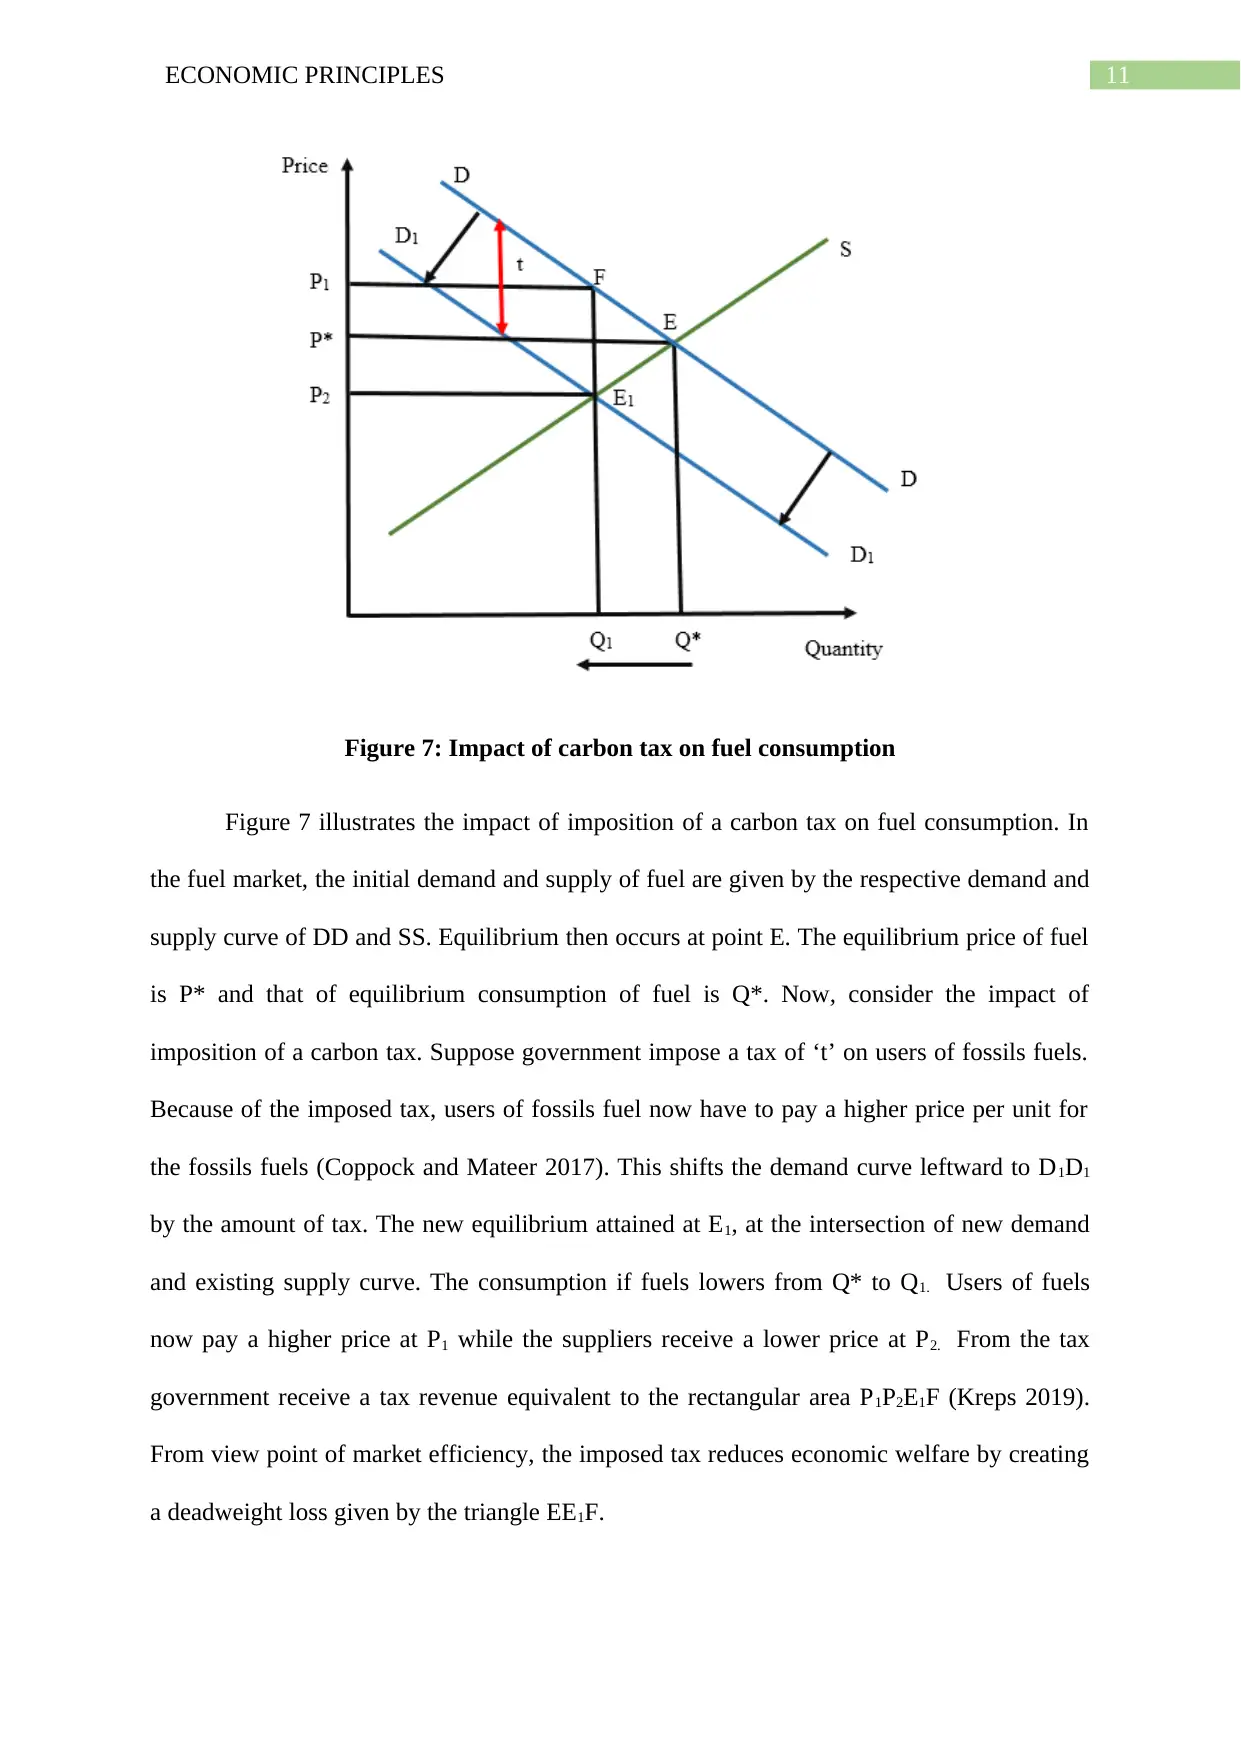
Figure 7: Impact of carbon tax on fuel consumption
Figure 7 illustrates the impact of imposition of a carbon tax on fuel consumption. In
the fuel market, the initial demand and supply of fuel are given by the respective demand and
supply curve of DD and SS. Equilibrium then occurs at point E. The equilibrium price of fuel
is P* and that of equilibrium consumption of fuel is Q*. Now, consider the impact of
imposition of a carbon tax. Suppose government impose a tax of ‘t’ on users of fossils fuels.
Because of the imposed tax, users of fossils fuel now have to pay a higher price per unit for
the fossils fuels (Coppock and Mateer 2017). This shifts the demand curve leftward to D1D1
by the amount of tax. The new equilibrium attained at E1, at the intersection of new demand
and existing supply curve. The consumption if fuels lowers from Q* to Q1. Users of fuels
now pay a higher price at P1 while the suppliers receive a lower price at P2. From the tax
government receive a tax revenue equivalent to the rectangular area P1P2E1F (Kreps 2019).
From view point of market efficiency, the imposed tax reduces economic welfare by creating
a deadweight loss given by the triangle EE1F.
⊘ This is a preview!⊘
Do you want full access?
Subscribe today to unlock all pages.
Trusted by 1+ million students worldwide
1 out of 16
Related Documents


Your All-in-One AI-Powered Toolkit for Academic Success.
+13062052269
info@desklib.com
Available 24*7 on WhatsApp / Email
![[object Object]](/_next/static/media/star-bottom.7253800d.svg)
Unlock your academic potential
Copyright © 2020–2026 A2Z Services. All Rights Reserved. Developed and managed by ZUCOL.