Southern Cross University: Economic and Quantitative Analysis Report

Verified

Added on  2022/08/14

|11
|1590
|19
Report
AI Summary
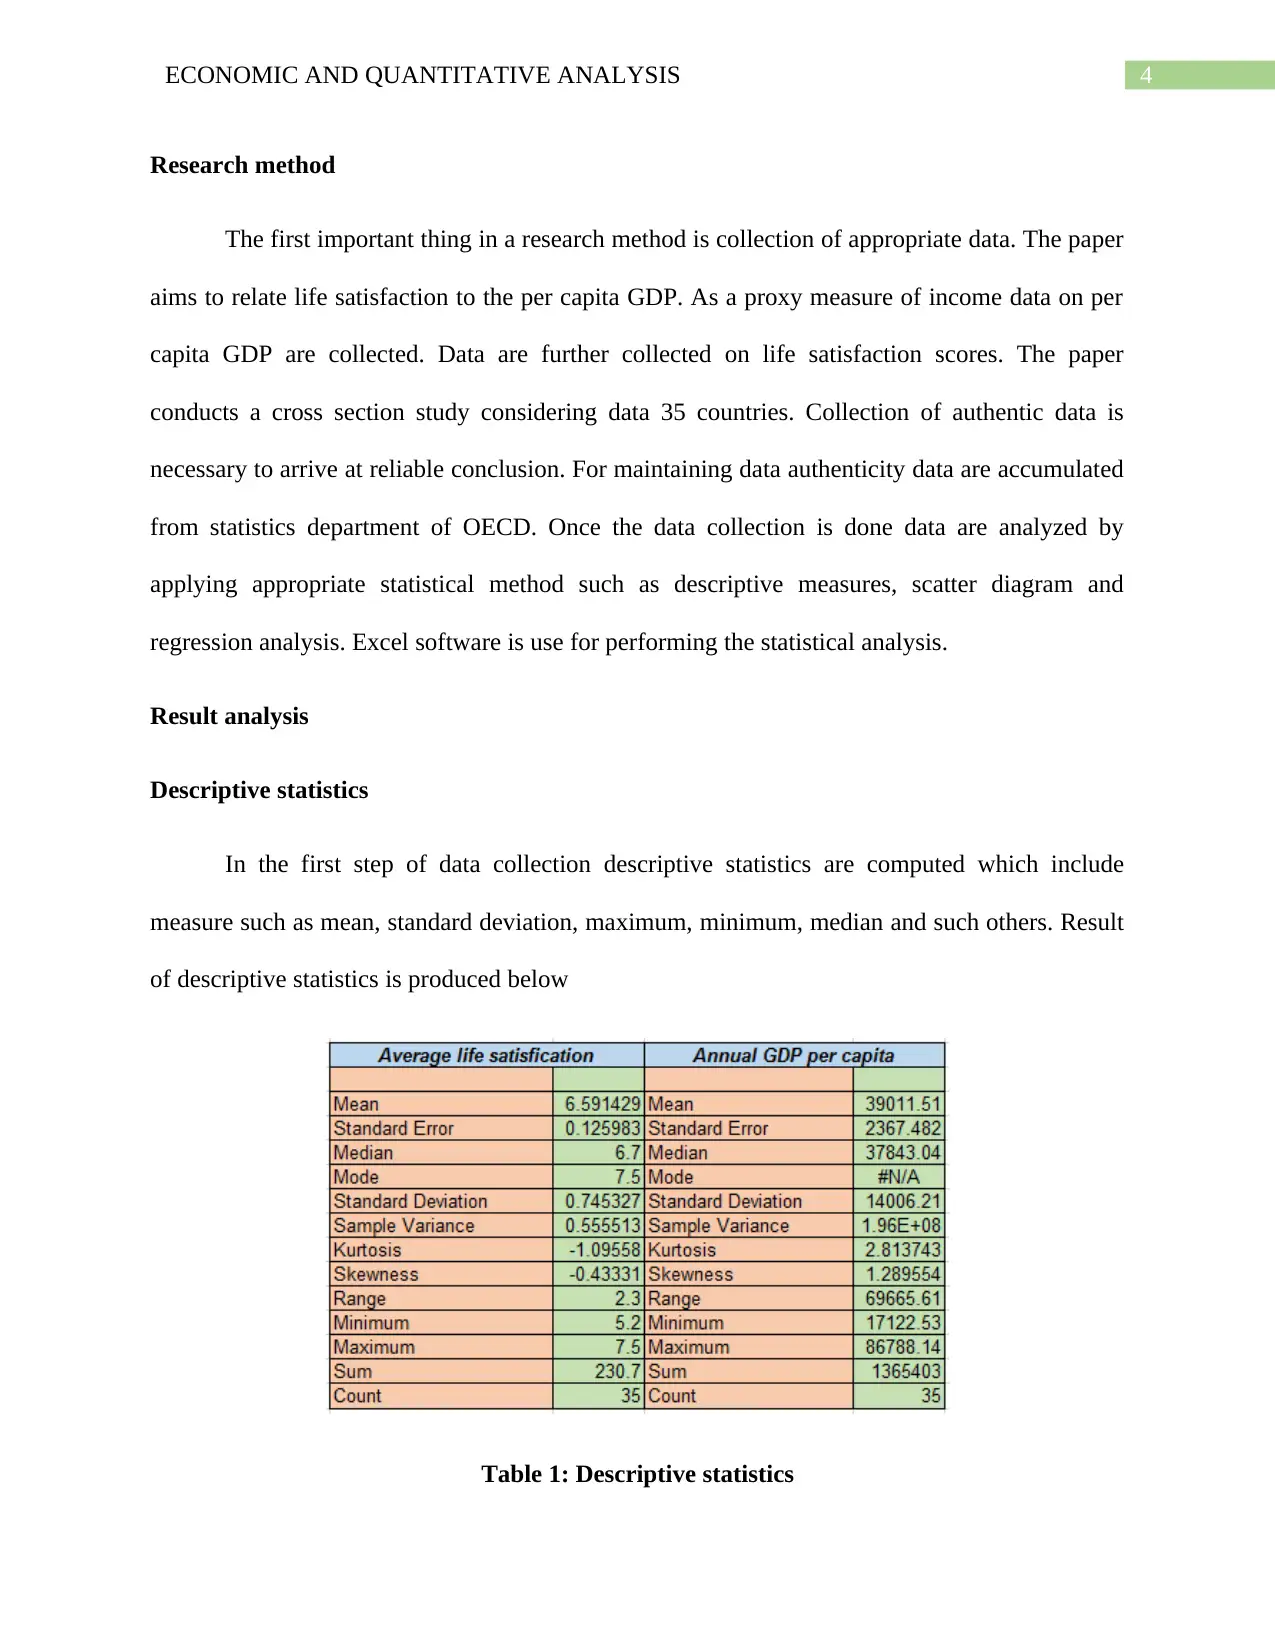
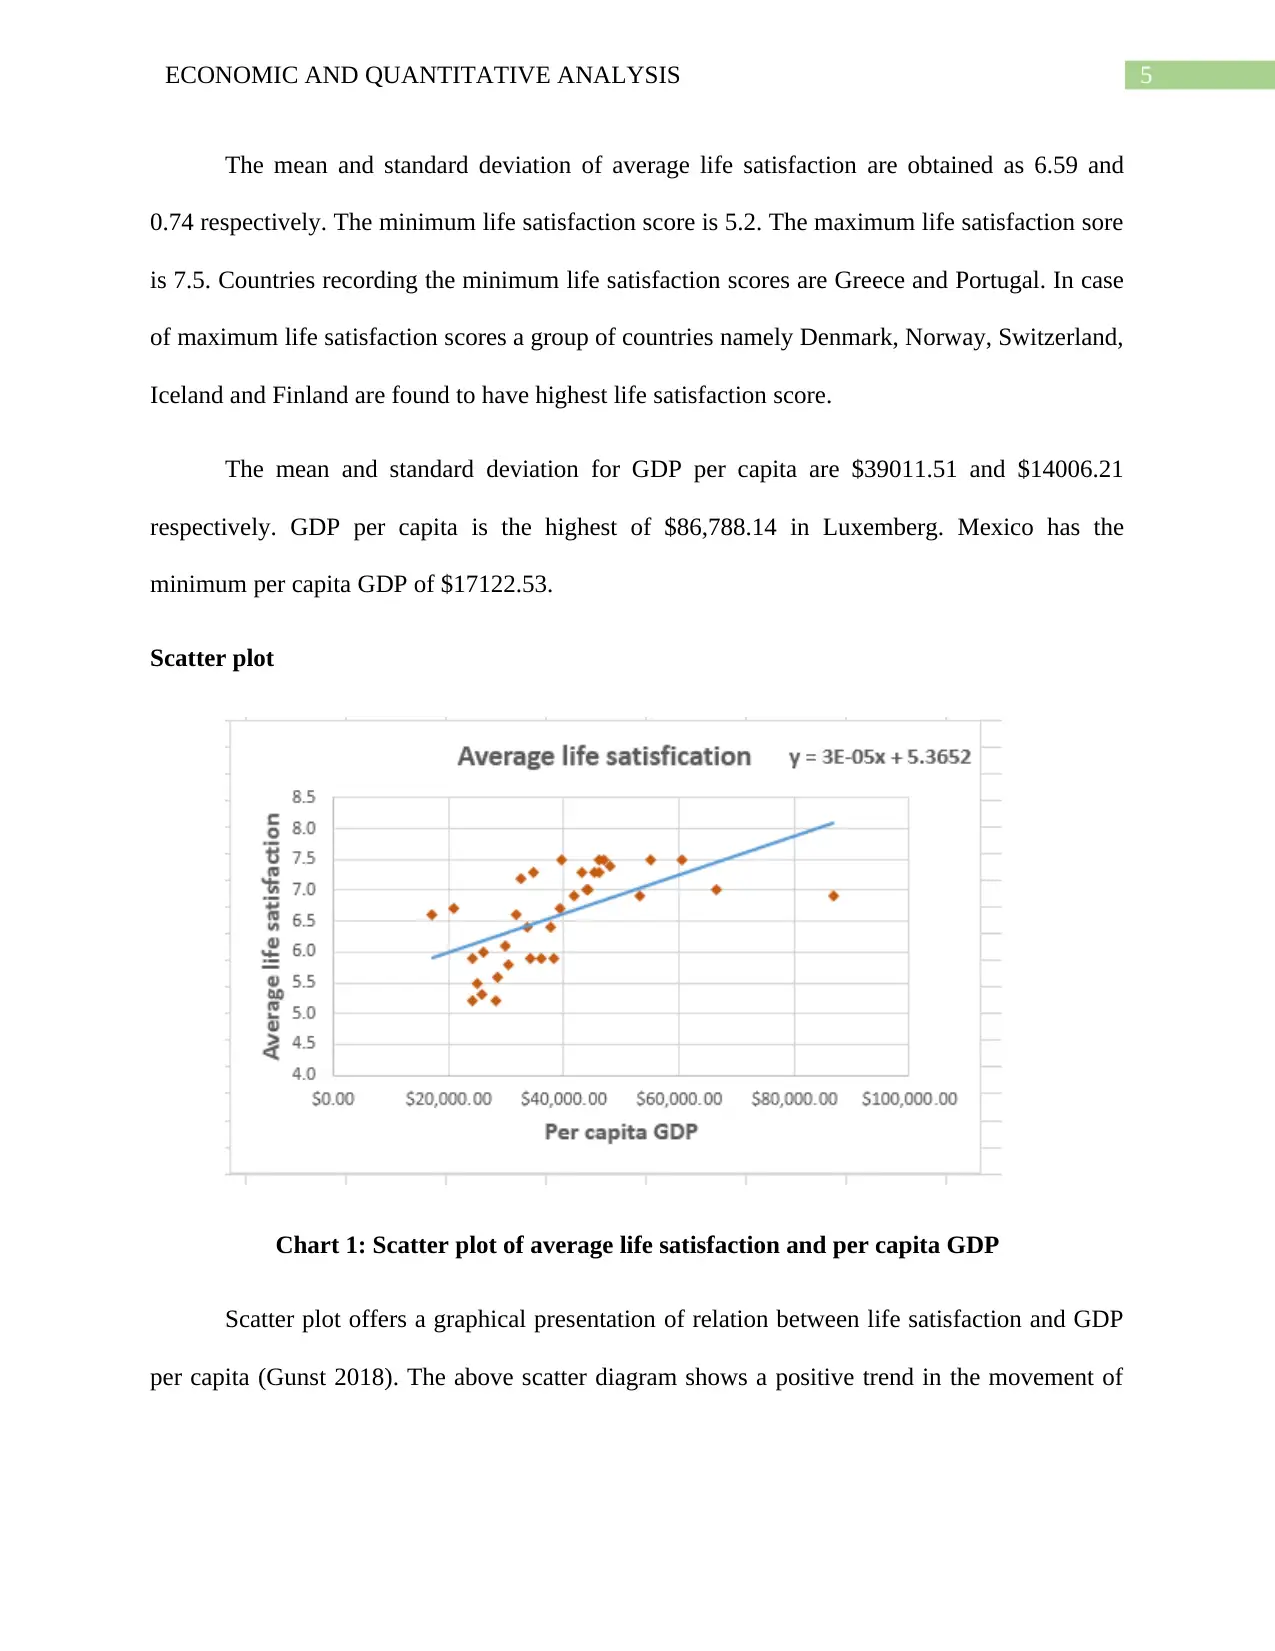
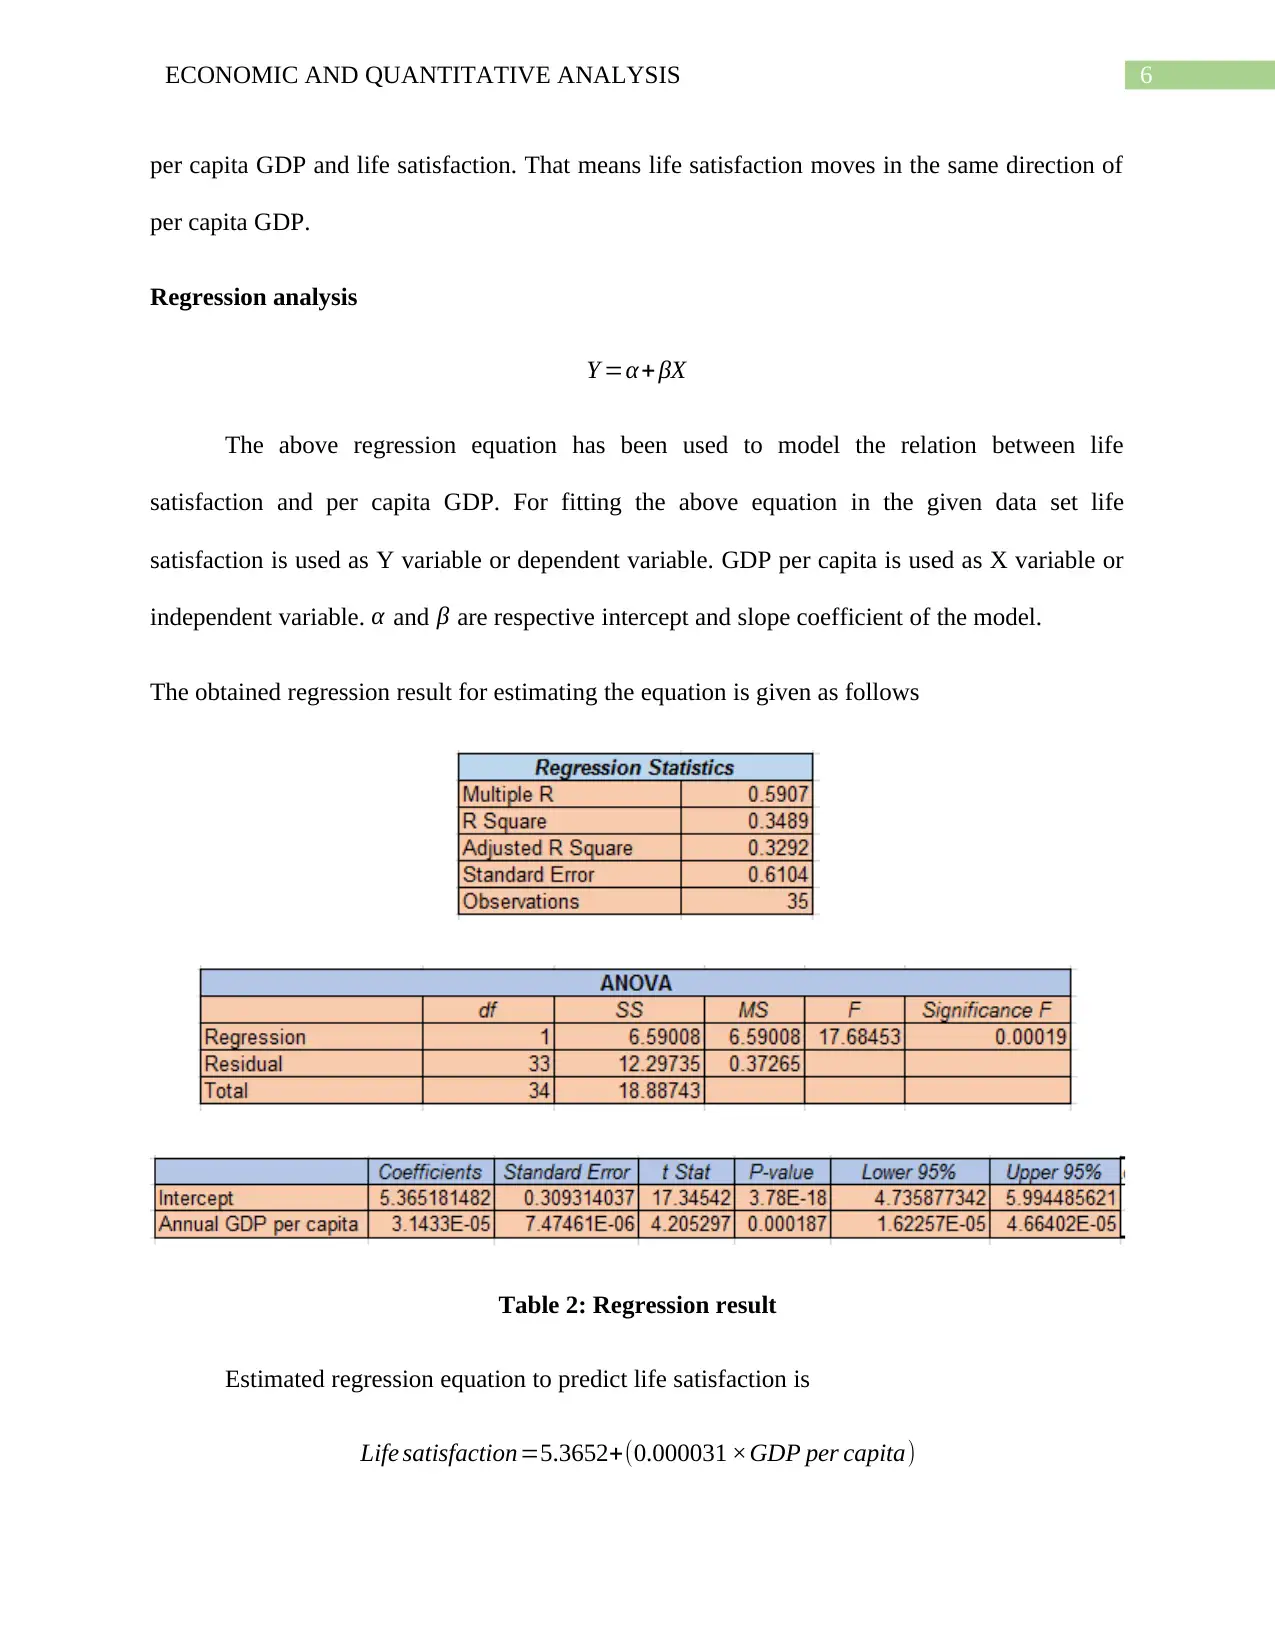
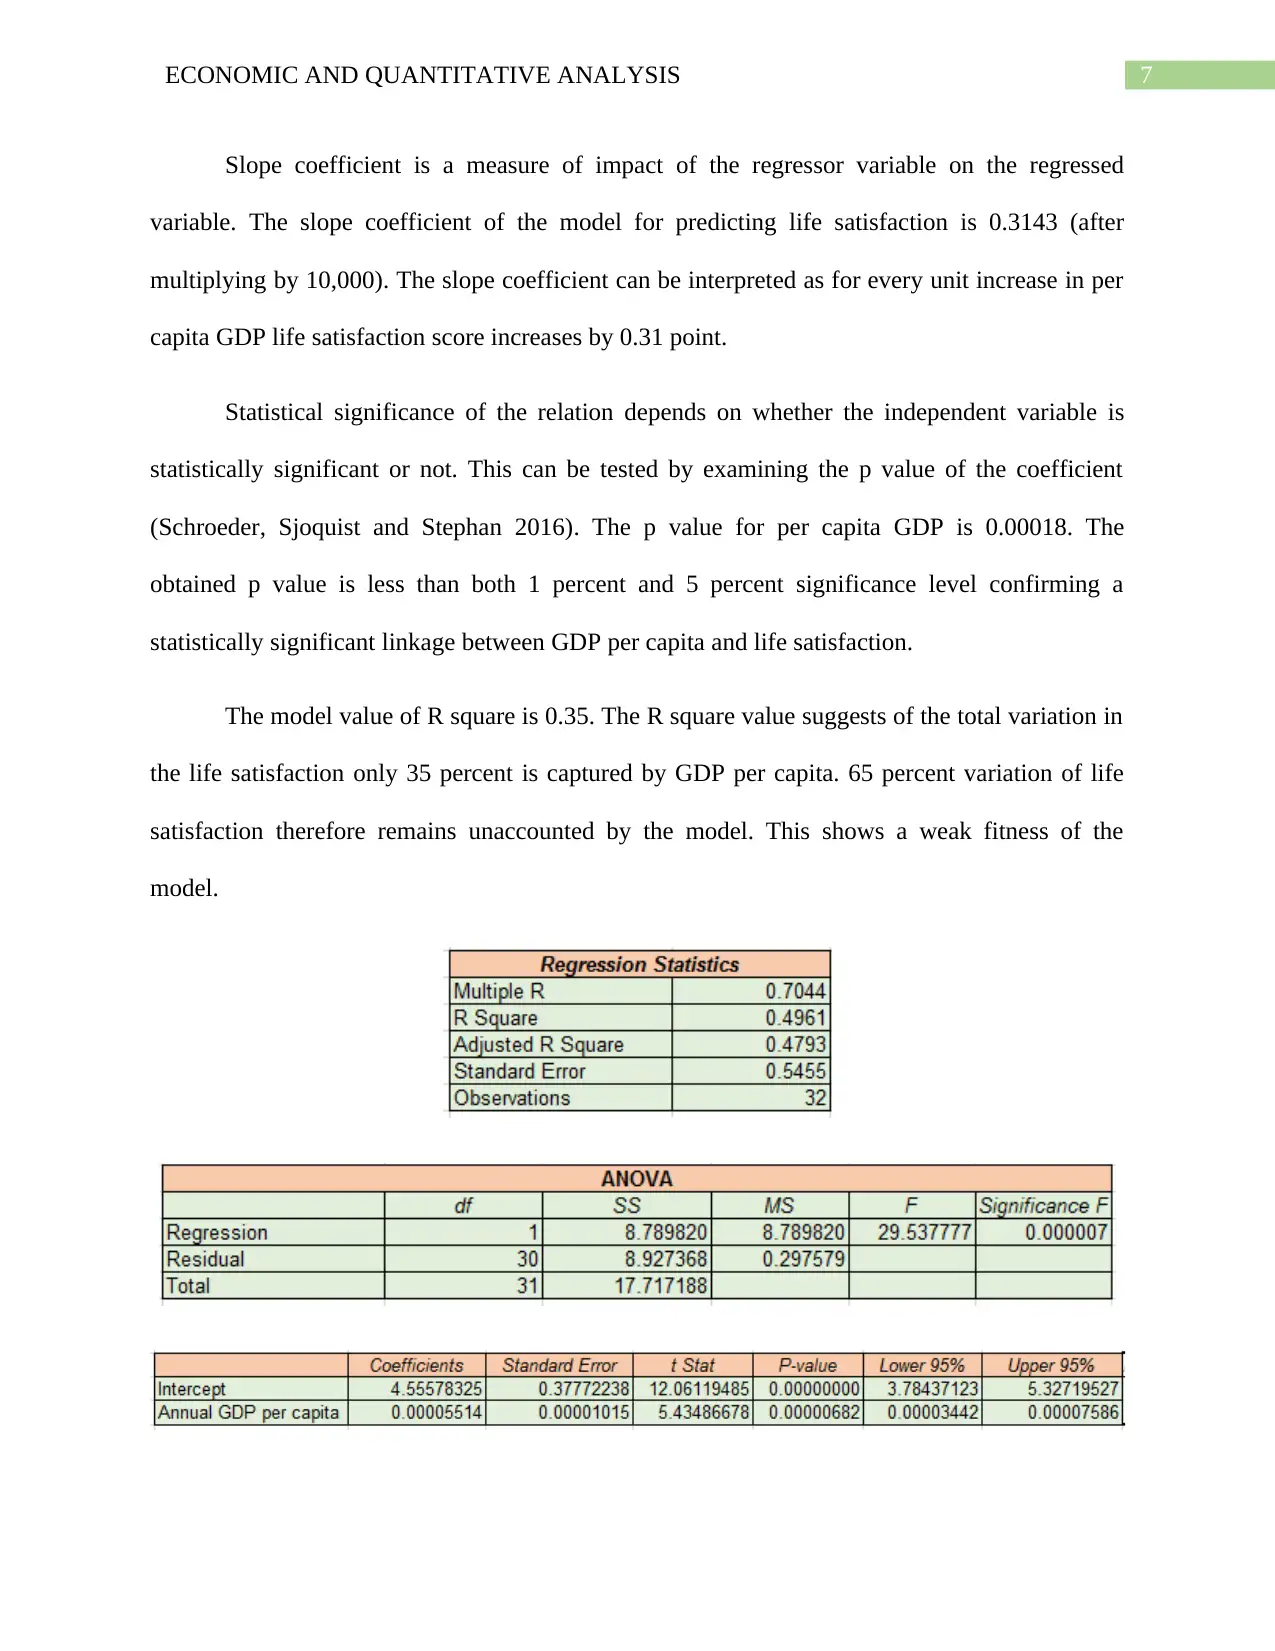
This report examines the statistical association between average life satisfaction and GDP per capita, employing a linear regression model. The study begins with a literature review on the relationship between life satisfaction and GDP, highlighting the interest of economists in this issue. The methodology involves collecting data from the OECD statistics department and conducting a cross-sectional study of 35 countries. The results section provides a descriptive analysis of the variables, including mean, standard deviation, and extreme values, alongside a scatter plot illustrating the relationship. Regression analysis is performed to estimate the impact of GDP per capita on life satisfaction. The report also discusses the results, limitations, and provides recommendations to improve life satisfaction based on the findings. The report concludes that life satisfaction is positively correlated with income, emphasizing the importance of policies that boost GDP and support income.
Document Page
Running head: ECONOMIC AND QUANTITATIVE ANALYSIS
Economic and Quantitative Analysis
Name of the Student
Name of the University
Author note
tabler-icon-diamond-filled.svg

Secure Best Marks with AI Grader

Need help grading? Try our AI Grader for instant feedback on your assignments.
Document Page
1ECONOMIC AND QUANTITATIVE ANALYSIS
Table of Contents
Purpose............................................................................................................................................2
Research background.......................................................................................................................2
Research method..............................................................................................................................3
Result analysis.................................................................................................................................3
Descriptive statistics....................................................................................................................3
Scatter plot...................................................................................................................................4
Regression analysis......................................................................................................................5
Discussion of the result....................................................................................................................7
Recommendation.............................................................................................................................8
List of References............................................................................................................................9
Document Page
2ECONOMIC AND QUANTITATIVE ANALYSIS
Purpose
The report intends to study how life satisfaction is connected with income of people. For
investing this connection the paper aims to estimate a statistical relation using a linear regression.
Research background
It is long since that researchers are attempting to examine the link between income and
satisfaction. Objective of these researches is to connect subjective well-being measured by life
satisfaction with economic factors such as GDP and particularly to explain changes in happiness
with changes in economic variables. Since, study of life satisfaction has implication for
economic policy development the area has attracted significant researches. One of the pioneering
study in this topic is that developed by Easterlin considering income and happiness data for US
residents for the period from 1974 to 2004 (Opfinger 2016). Finding of the paper known as
Eaterlin’s paradox concluded life satisfaction remains indifferent with changes in income. Some
other studies later on supported findings of Easterlin. A different study based on panel data of
five household reached to the conclusion that wealth level and consumption spending of
household are related to income positively. A research based on 15 EU countries reached to the
similar conclusion of Easterlin (Keller 2019). Authors of the paper conclude that growth in GDP
per se is not positively linked with the happiness rather individual considers expectation and
relative condition with the neighboring nations as determinant to life satisfaction. Another group
of scientist considering the same data however arrived at a different conclusion and argued
happiness of a country is affected by GDP (Boo, Yen and Lim 2017). Different contradictory
findings about the direction of relation of life satisfaction and income encourage more
economists to study the exact relation.
Document Page
3ECONOMIC AND QUANTITATIVE ANALYSIS
tabler-icon-diamond-filled.svg

Secure Best Marks with AI Grader

Need help grading? Try our AI Grader for instant feedback on your assignments.
Document Page
4ECONOMIC AND QUANTITATIVE ANALYSIS
Research method
The first important thing in a research method is collection of appropriate data. The paper
aims to relate life satisfaction to the per capita GDP. As a proxy measure of income data on per
capita GDP are collected. Data are further collected on life satisfaction scores. The paper
conducts a cross section study considering data 35 countries. Collection of authentic data is
necessary to arrive at reliable conclusion. For maintaining data authenticity data are accumulated
from statistics department of OECD. Once the data collection is done data are analyzed by
applying appropriate statistical method such as descriptive measures, scatter diagram and
regression analysis. Excel software is use for performing the statistical analysis.
Result analysis
Descriptive statistics
In the first step of data collection descriptive statistics are computed which include
measure such as mean, standard deviation, maximum, minimum, median and such others. Result
of descriptive statistics is produced below
Table 1: Descriptive statistics
Document Page
5ECONOMIC AND QUANTITATIVE ANALYSIS
The mean and standard deviation of average life satisfaction are obtained as 6.59 and
0.74 respectively. The minimum life satisfaction score is 5.2. The maximum life satisfaction sore
is 7.5. Countries recording the minimum life satisfaction scores are Greece and Portugal. In case
of maximum life satisfaction scores a group of countries namely Denmark, Norway, Switzerland,
Iceland and Finland are found to have highest life satisfaction score.
The mean and standard deviation for GDP per capita are $39011.51 and $14006.21
respectively. GDP per capita is the highest of $86,788.14 in Luxemberg. Mexico has the
minimum per capita GDP of $17122.53.
Scatter plot
Chart 1: Scatter plot of average life satisfaction and per capita GDP
Scatter plot offers a graphical presentation of relation between life satisfaction and GDP
per capita (Gunst 2018). The above scatter diagram shows a positive trend in the movement of
Document Page
6ECONOMIC AND QUANTITATIVE ANALYSIS
per capita GDP and life satisfaction. That means life satisfaction moves in the same direction of
per capita GDP.
Regression analysis
Y =α+ βX
The above regression equation has been used to model the relation between life
satisfaction and per capita GDP. For fitting the above equation in the given data set life
satisfaction is used as Y variable or dependent variable. GDP per capita is used as X variable or
independent variable. α and β are respective intercept and slope coefficient of the model.
The obtained regression result for estimating the equation is given as follows
Table 2: Regression result
Estimated regression equation to predict life satisfaction is
Life satisfaction=5.3652+(0.000031 ×GDP per capita)
tabler-icon-diamond-filled.svg

Paraphrase This Document

Need a fresh take? Get an instant paraphrase of this document with our AI Paraphraser
Document Page
7ECONOMIC AND QUANTITATIVE ANALYSIS
Slope coefficient is a measure of impact of the regressor variable on the regressed
variable. The slope coefficient of the model for predicting life satisfaction is 0.3143 (after
multiplying by 10,000). The slope coefficient can be interpreted as for every unit increase in per
capita GDP life satisfaction score increases by 0.31 point.
Statistical significance of the relation depends on whether the independent variable is
statistically significant or not. This can be tested by examining the p value of the coefficient
(Schroeder, Sjoquist and Stephan 2016). The p value for per capita GDP is 0.00018. The
obtained p value is less than both 1 percent and 5 percent significance level confirming a
statistically significant linkage between GDP per capita and life satisfaction.
The model value of R square is 0.35. The R square value suggests of the total variation in
the life satisfaction only 35 percent is captured by GDP per capita. 65 percent variation of life
satisfaction therefore remains unaccounted by the model. This shows a weak fitness of the
model.
Document Page
8ECONOMIC AND QUANTITATIVE ANALYSIS
Table 3: Regression after dropping the outlier
New regression equation without the outlier is
Life satisfaction=4.5558+(0.000055 ×GDP per capita)
Removing outliers from the model has a positive impact on the model both in terms of
value of slope coefficient and fitness of the model. Slope coefficient for the new model is
0.5514. The increased value of slope coefficient indicates a greater influence of income on life
satisfaction (Darlington and Hayes 2016). The R square value in the new model increases to 0.50
indicating a better fitness of the model.
Discussion of the result
Analysis of the paper indicates that life satisfaction varies positively with income. Based
on the finding it can be asserted that one can expected to be more satisfied or happier in the life
when income increases.
The paper has used appropriate statistical techniques to examine the relation of life
satisfaction with per capita GDP. Since the paper finds a statically valid relation using simple
regression model a positive relation can be supported from the derived result (Kumar 2019). The
sample consists of only 35 countries. Limited sample size makes the study limited to some
extent. Another limitation is inclusion of only one variable namely income in explaining
variation in life satisfaction.
Result of the paper in line with previous cross sectional studies suggesting positive
impact of GDP on life satisfaction (Beja 2018). This though contradicts findings of previous
Document Page
9ECONOMIC AND QUANTITATIVE ANALYSIS
literatures indicating insignificant relation of life satisfaction with income it has clear implication
for policy making to improve life satisfaction.
Recommendation
The section provides recommendation to improve life satisfaction considering finding of
the paper. First, since there is a positive significant association between life satisfaction and GDP
per capita policy should be taken to boost GDP. Polices supporting GDP include productive
investment to improve infrastructure, encourage research and development and others. Second,
direct income support program may also prove helpful to increase life satisfaction. Third, life
satisfaction also depends on condition of health, education, environment and other qualitative
aspects. These conditions should also be improved to enhance life satisfaction.
tabler-icon-diamond-filled.svg

Secure Best Marks with AI Grader

Need help grading? Try our AI Grader for instant feedback on your assignments.
Document Page
10ECONOMIC AND QUANTITATIVE ANALYSIS
List of References
Beja Jr, E.L., 2018. Testing the easterlin paradox: Results and policy implications. Journal of
Behavioral Economics for Policy, 2(2), pp.79-83.
Boo, M.C., Yen, S.H. and Lim, H.E., 2017. A note on happiness and life satisfaction in
Malaysia. Malaysian Journal of Economic Studies, 53(2), pp.261-277.
Darlington, R.B. and Hayes, A.F., 2016. Regression analysis and linear models: Concepts,
applications, and implementation. Guilford Publications.
Gunst, R.F., 2018. Regression analysis and its application: a data-oriented approach.
Routledge.
Keller, T., 2019. Caught in the monkey trap: Elaborating the hypothesis for why income
aspiration decreases life satisfaction. Journal of Happiness Studies, 20(3), pp.829-840.
Kumar, R., 2019. Research methodology: A step-by-step guide for beginners. Sage Publications
Limited.
Opfinger, M., 2016. The Easterlin paradox worldwide. Applied Economics Letters, 23(2), pp.85-
88.
Schroeder, L.D., Sjoquist, D.L. and Stephan, P.E., 2016. Understanding regression analysis: An
introductory guide (Vol. 57). Sage Publications.
chevron_up_icon
1 out of 11
circle_padding
hide_on_mobile
zoom_out_icon
logo.png

Your All-in-One AI-Powered Toolkit for Academic Success.

Available 24*7 on WhatsApp / Email

[object Object]