Economic Analysis of Japan: GDP, Unemployment, and Price Levels
VerifiedAdded on 2023/01/12
|15
|3073
|20
Report
AI Summary
This report provides a comprehensive economic analysis of Japan, focusing on key macroeconomic indicators and government policies. It begins with an introduction to the Japanese economy, detailing its major sectors (agriculture, industry, and services), key products and services, major export markets, and prominent companies. The report then delves into production output performance, defining and analyzing real GDP, real GDP growth rate, and real GDP per capita from 2008 to 2018, supported by graphical representations and explanations of economic trends. It also examines the government's measures to stimulate production output, particularly in response to the 2008-2009 recession and for long-term economic growth. Furthermore, the report investigates unemployment in Japan, discussing the unemployment rate, different types of unemployment (frictional, structural, and cyclical), and the government's efforts to combat it. It also analyzes price level dynamics, explaining inflation, its causes (demand-pull and cost-push), and the government's strategies to achieve price stability. The report uses data and graphs from Tradingeconomics.com to illustrate the trends in these economic indicators, providing a detailed overview of Japan's economic landscape and policy responses.
Running head: ECONOMICS
Economics
Name of the Student
Name of the University
Student ID
Economics
Name of the Student
Name of the University
Student ID
Paraphrase This Document
Need a fresh take? Get an instant paraphrase of this document with our AI Paraphraser
1ECONOMICS
Table of Contents
Introduction................................................................................................................................2
Production output performance..................................................................................................3
Real GDP...............................................................................................................................3
Real GDP growth rate............................................................................................................4
Real GDP per capita...............................................................................................................5
Government measure to achieve production output performance.........................................6
Unemployment...........................................................................................................................6
Unemployment rate and type of unemployment....................................................................6
Types of Unemployment in Japan..........................................................................................7
Trend in unemployment rate..................................................................................................8
Government measure to overcome employment....................................................................8
Price level analysis.....................................................................................................................9
Inflation..................................................................................................................................9
Causes of inflation..................................................................................................................9
Trend in inflation rate...........................................................................................................10
Government measure to achieve stable price.......................................................................11
Conclusion................................................................................................................................12
References................................................................................................................................13
2ECONOMICS
Introduction
Economy of Japan is characterized as a highly developed economy following the
principles of market economy. In terms of nominal GDP Japan is the third largest economy of
the world. Three major sectors of the economy are agriculture, industry and service.
Agricultural sector accounts nearly 1.4 percent of total GDP of Japan. The main reason
behind a relatively lower contribution of agriculture in aggregate output is limited availability
of arable land. Rice is the main cereal crops produced in the nation. Japan is considered as
one of the biggest importers of agricultural product in the world. Japan has a highly
diversifying industrial and manufacturing sector with industry accounting 24 percent share of
GDP. Important subsectors in the industrial sector include automobile manufacturing,
consumer electronics, optical fibers, semiconductor manufacturing, copy and facsimile
machines and optical media. The most important sector of the economy is service sector
accounting 75 percent of economic activity of the nation. Major services industries of Japan
include banking, real estate, insurance, retail, transportation, tourism and telecommunication
(Allen, 2013). Besides domestic production, Japan export goods in which it enjoys a
comparative advantage in goods such as engineering-oriented product and research and
development led products to different countries of the world. The top five export markets of
Japan are China, United State, South Korea, Taiwan and Hong Kong. The highly developed
technology and associated economic development has attracted many companies to operate in
Japan. Top five companies of Japan are Toyota Motor, Mitsubishi UFJ Financial, Sumitomo
Mitsui Financial, Nippon Telegraph & Tel and Honda Motor.
⊘ This is a preview!⊘
Do you want full access?
Subscribe today to unlock all pages.
Trusted by 1+ million students worldwide
3ECONOMICS
Production output performance
Real GDP
Gross Domestic Product of a nation indicates value of produced goods and services in
a nation in monetary terms. GDP is computed by estimating aggregate value of the output
either using current year prices or using fixed base year price. If GDP is computed using
respective market price of current year then it is called nominal GDP. Computed GDP using
market price of a fixed base year is termed as real GDP (Heijdra, 2017). Real GDP by
estimating GDP in terms of a fixed base year price gives an inflation-adjusted measure of
output.
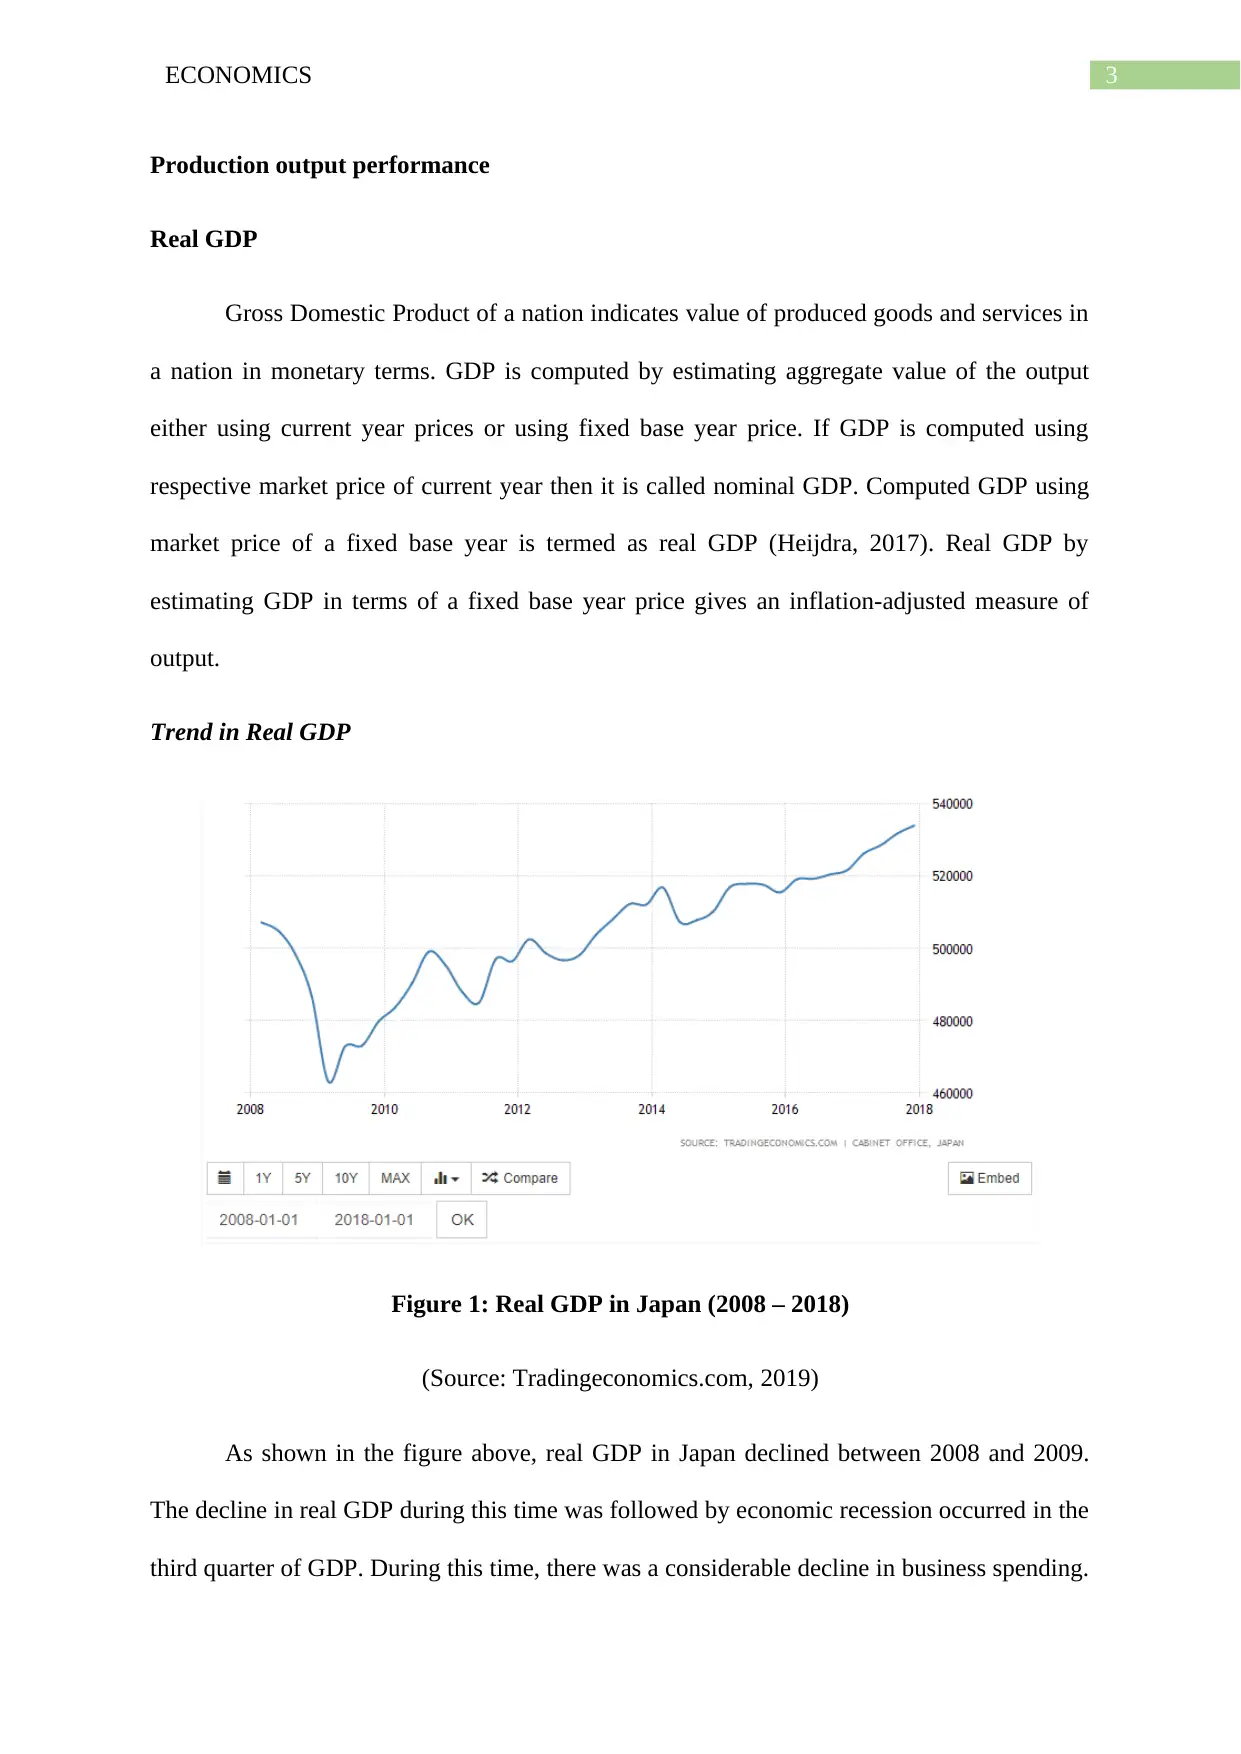
Trend in Real GDP
Figure 1: Real GDP in Japan (2008 – 2018)
(Source: Tradingeconomics.com, 2019)
As shown in the figure above, real GDP in Japan declined between 2008 and 2009.
The decline in real GDP during this time was followed by economic recession occurred in the
third quarter of GDP. During this time, there was a considerable decline in business spending.
Production output performance
Real GDP
Gross Domestic Product of a nation indicates value of produced goods and services in
a nation in monetary terms. GDP is computed by estimating aggregate value of the output
either using current year prices or using fixed base year price. If GDP is computed using
respective market price of current year then it is called nominal GDP. Computed GDP using
market price of a fixed base year is termed as real GDP (Heijdra, 2017). Real GDP by
estimating GDP in terms of a fixed base year price gives an inflation-adjusted measure of
output.
Trend in Real GDP
Figure 1: Real GDP in Japan (2008 – 2018)
(Source: Tradingeconomics.com, 2019)
As shown in the figure above, real GDP in Japan declined between 2008 and 2009.
The decline in real GDP during this time was followed by economic recession occurred in the
third quarter of GDP. During this time, there was a considerable decline in business spending.
Paraphrase This Document
Need a fresh take? Get an instant paraphrase of this document with our AI Paraphraser
4ECONOMICS
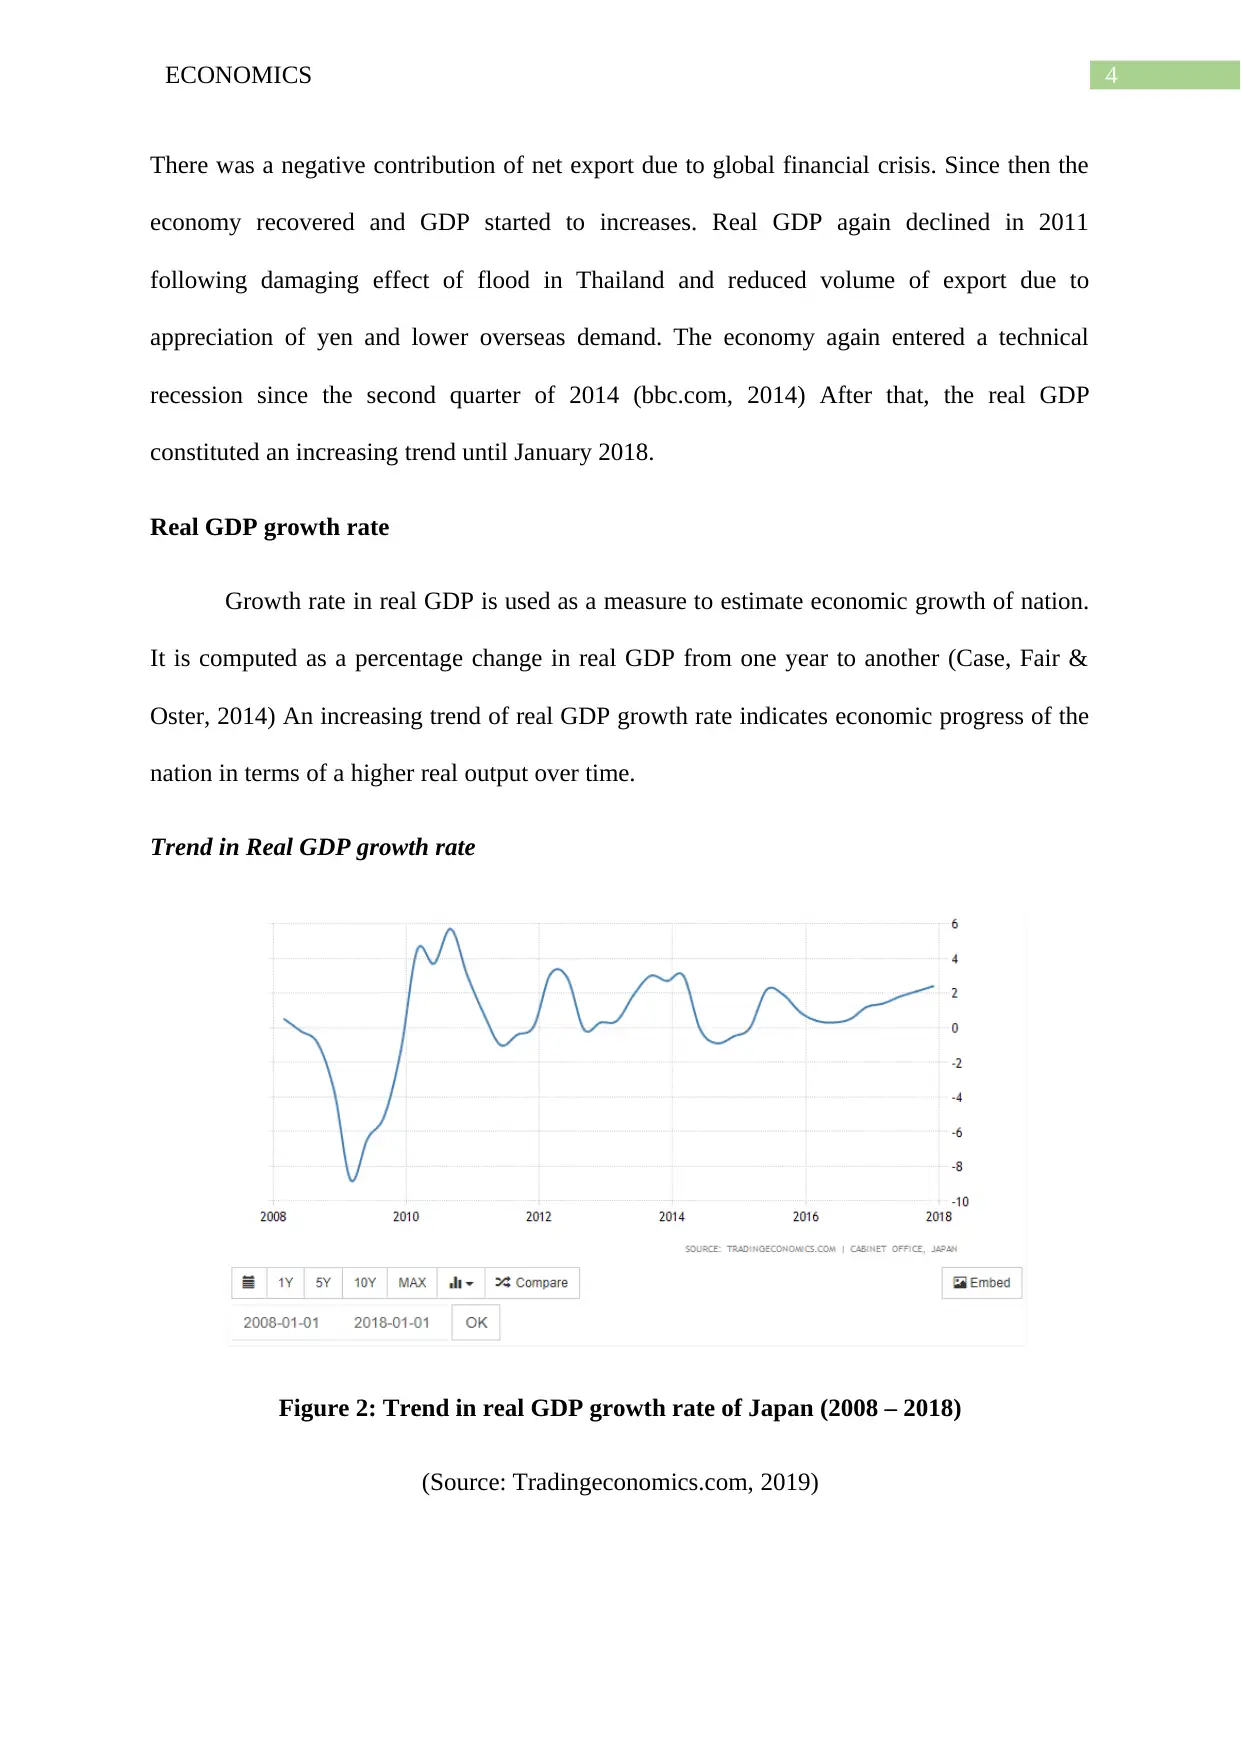
There was a negative contribution of net export due to global financial crisis. Since then the
economy recovered and GDP started to increases. Real GDP again declined in 2011
following damaging effect of flood in Thailand and reduced volume of export due to
appreciation of yen and lower overseas demand. The economy again entered a technical
recession since the second quarter of 2014 (bbc.com, 2014) After that, the real GDP
constituted an increasing trend until January 2018.
Real GDP growth rate
Growth rate in real GDP is used as a measure to estimate economic growth of nation.
It is computed as a percentage change in real GDP from one year to another (Case, Fair &
Oster, 2014) An increasing trend of real GDP growth rate indicates economic progress of the
nation in terms of a higher real output over time.
Trend in Real GDP growth rate
Figure 2: Trend in real GDP growth rate of Japan (2008 – 2018)
(Source: Tradingeconomics.com, 2019)
5ECONOMICS
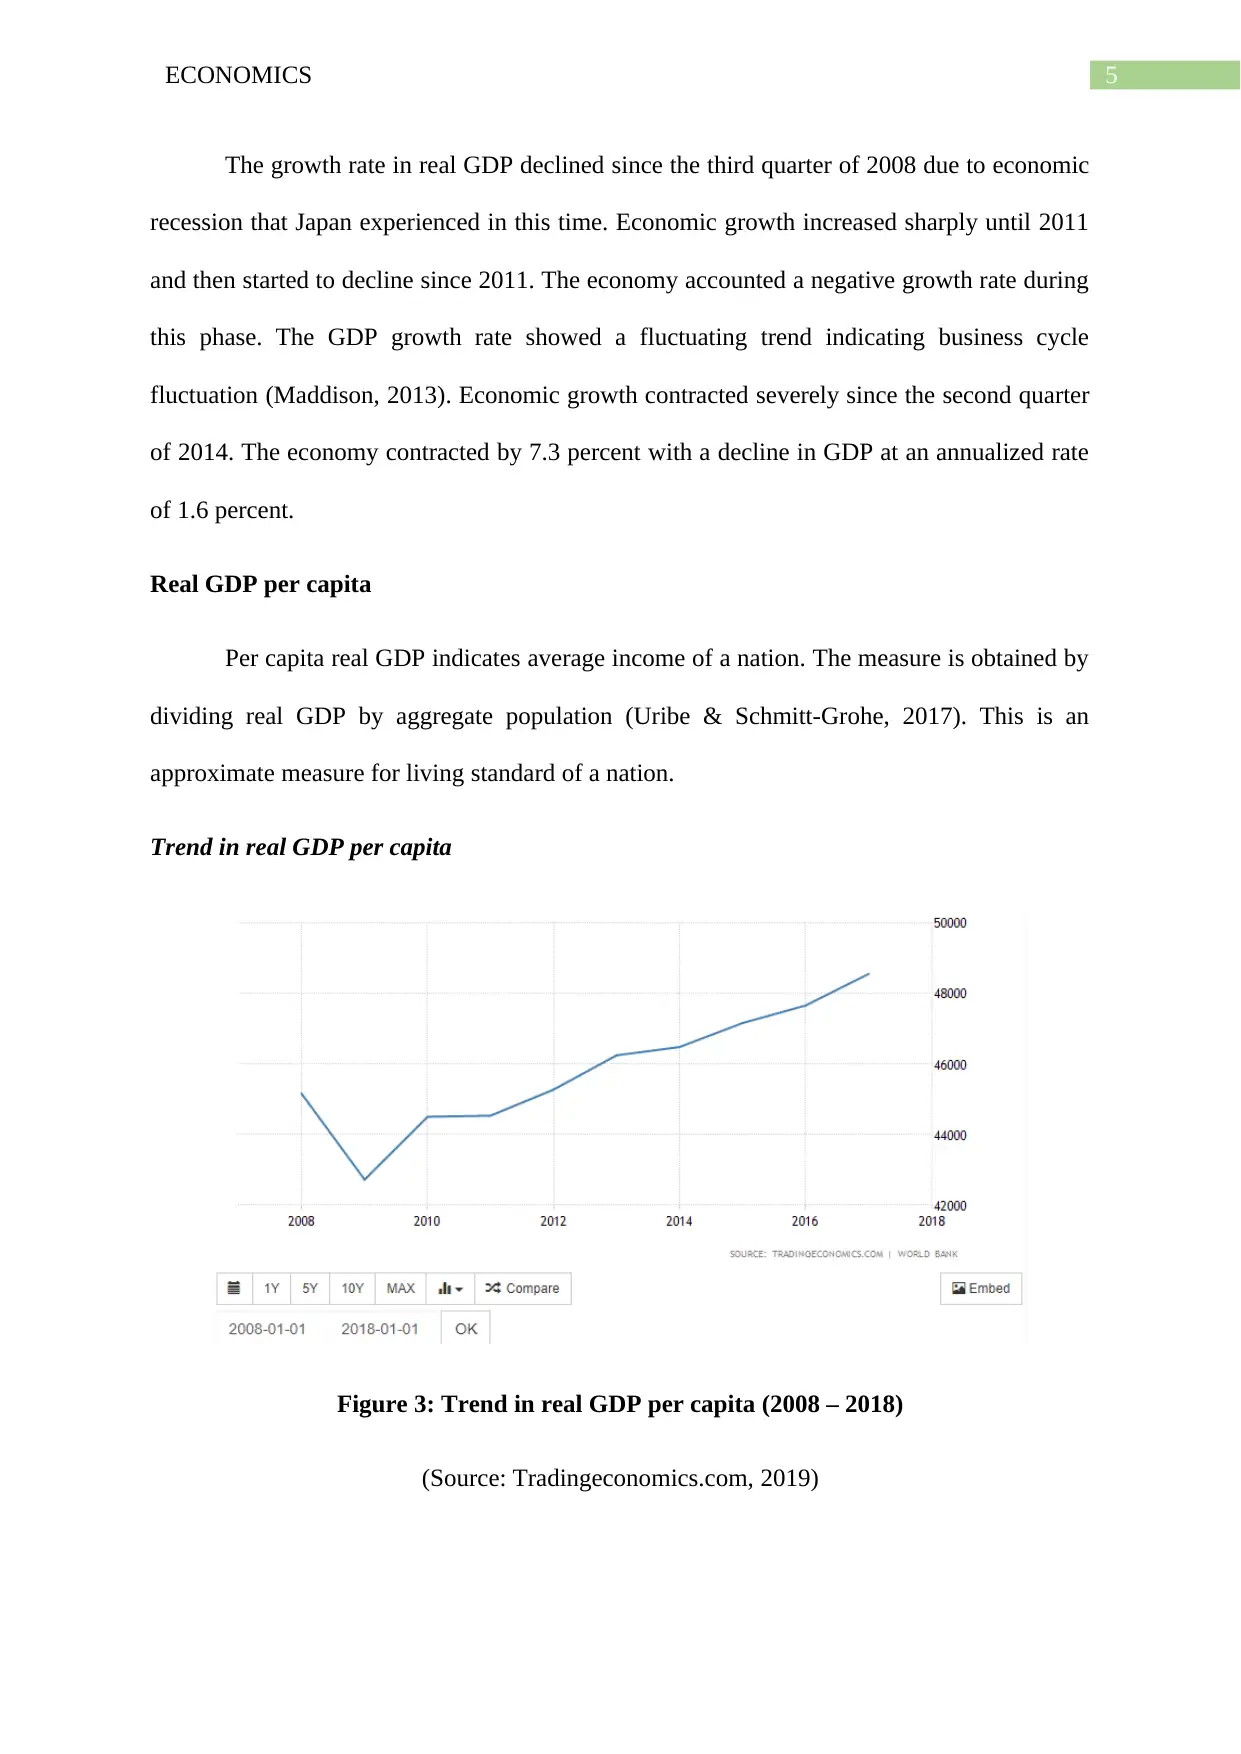
The growth rate in real GDP declined since the third quarter of 2008 due to economic
recession that Japan experienced in this time. Economic growth increased sharply until 2011
and then started to decline since 2011. The economy accounted a negative growth rate during
this phase. The GDP growth rate showed a fluctuating trend indicating business cycle
fluctuation (Maddison, 2013). Economic growth contracted severely since the second quarter
of 2014. The economy contracted by 7.3 percent with a decline in GDP at an annualized rate
of 1.6 percent.
Real GDP per capita
Per capita real GDP indicates average income of a nation. The measure is obtained by
dividing real GDP by aggregate population (Uribe & Schmitt-Grohe, 2017). This is an
approximate measure for living standard of a nation.
Trend in real GDP per capita
Figure 3: Trend in real GDP per capita (2008 – 2018)
(Source: Tradingeconomics.com, 2019)
⊘ This is a preview!⊘
Do you want full access?
Subscribe today to unlock all pages.
Trusted by 1+ million students worldwide
6ECONOMICS
The per capita real GDP in Japan showed a continuous upward rising trend except in
the year 2009. Per capita GDP of Japan has outperformed most major economies since 1990s
(Allen, 2013). The income inequality in Japan has not increased overtime with the economy
recording lowest income inequality.
Government measure to achieve production output performance
The government of Japan provides the economy timely support to maintain a steady
output performance. The economy of Japan experienced a severe recession since the third
quarter of 2018. The economy contracted by 15.2 percent in the first quarter of 2009
(Tradingeconomics.com, 2013). In order to recover week economic growth government of
Japan introduced stimulatory package of worth 7.2 trillion yen. The economic stimulus aimed
to help the household suffering from two consequent decades of economic stagnation.
Government announced the stimulus economic plan in April 2009 that consisted economic
stimulus of 15.4 trillion. The package include investment of 1.6 trillion yen in low-carbon
technology, 1.9 trillion yen for different employment program and 370 billion yen for car
subsidies. In order to ensure long-term economic growth government undertakes monetary,
fiscal and structural policy measures in association with Bank of Japan. Government has
successfully implemented different structural reforms for improving labor force participation
and work-style reform (mofa.go.jp, 2018). As far as fiscal policy is concerned government
has shifted its focus towards quality in terms of prioritizing expenditure. For example,
government has made significant investment in promoting science and technology and
infrastructural investment.
Unemployment
Unemployment rate and type of unemployment
Paraphrase This Document
Need a fresh take? Get an instant paraphrase of this document with our AI Paraphraser
7ECONOMICS
Rate of unemployment in an economy refers to percentage of unemployed labors in
total labor force. Labors are considered as unemployed if they are not engaged in any job
currently but are actively looking for a job (Heijdra, 2017). Depending on reasons for
unemployment, there are three major types of unemployment.
Frictional unemployment
Frictional unemployment indicates unemployment that is caused due to transition of
workers from one job to another. This kind of unemployment include people who voluntarily
leave their existing jobs to find a better one, people who are looking for jobs as they are
moved from one job to another and such other.
Structural unemployment
Structural unemployment is a type of unemployment occurs due to mismatch between
workers’ skill and skills that employers require (Uribe & Schmitt-Grohe, 2017) This type of
unemployment occurs due to industrial restructuring, changes in demographics or technical
innovation.
Cyclical unemployment
This type of unemployment is associated with business cycle fluctuation in the
economy. During economic contraction, aggregate demand falls causing contraction of
different sectors and raises unemployment. This kind of unemployment in temporary in
nature.
Types of Unemployment in Japan
The labor market of Japan experiences structural unemployment due to underlying
structural change in the economy. These structural changes include aging population of the
labor force, increase in proportion of non-regular laborers, industrial or occupational changes
8ECONOMICS
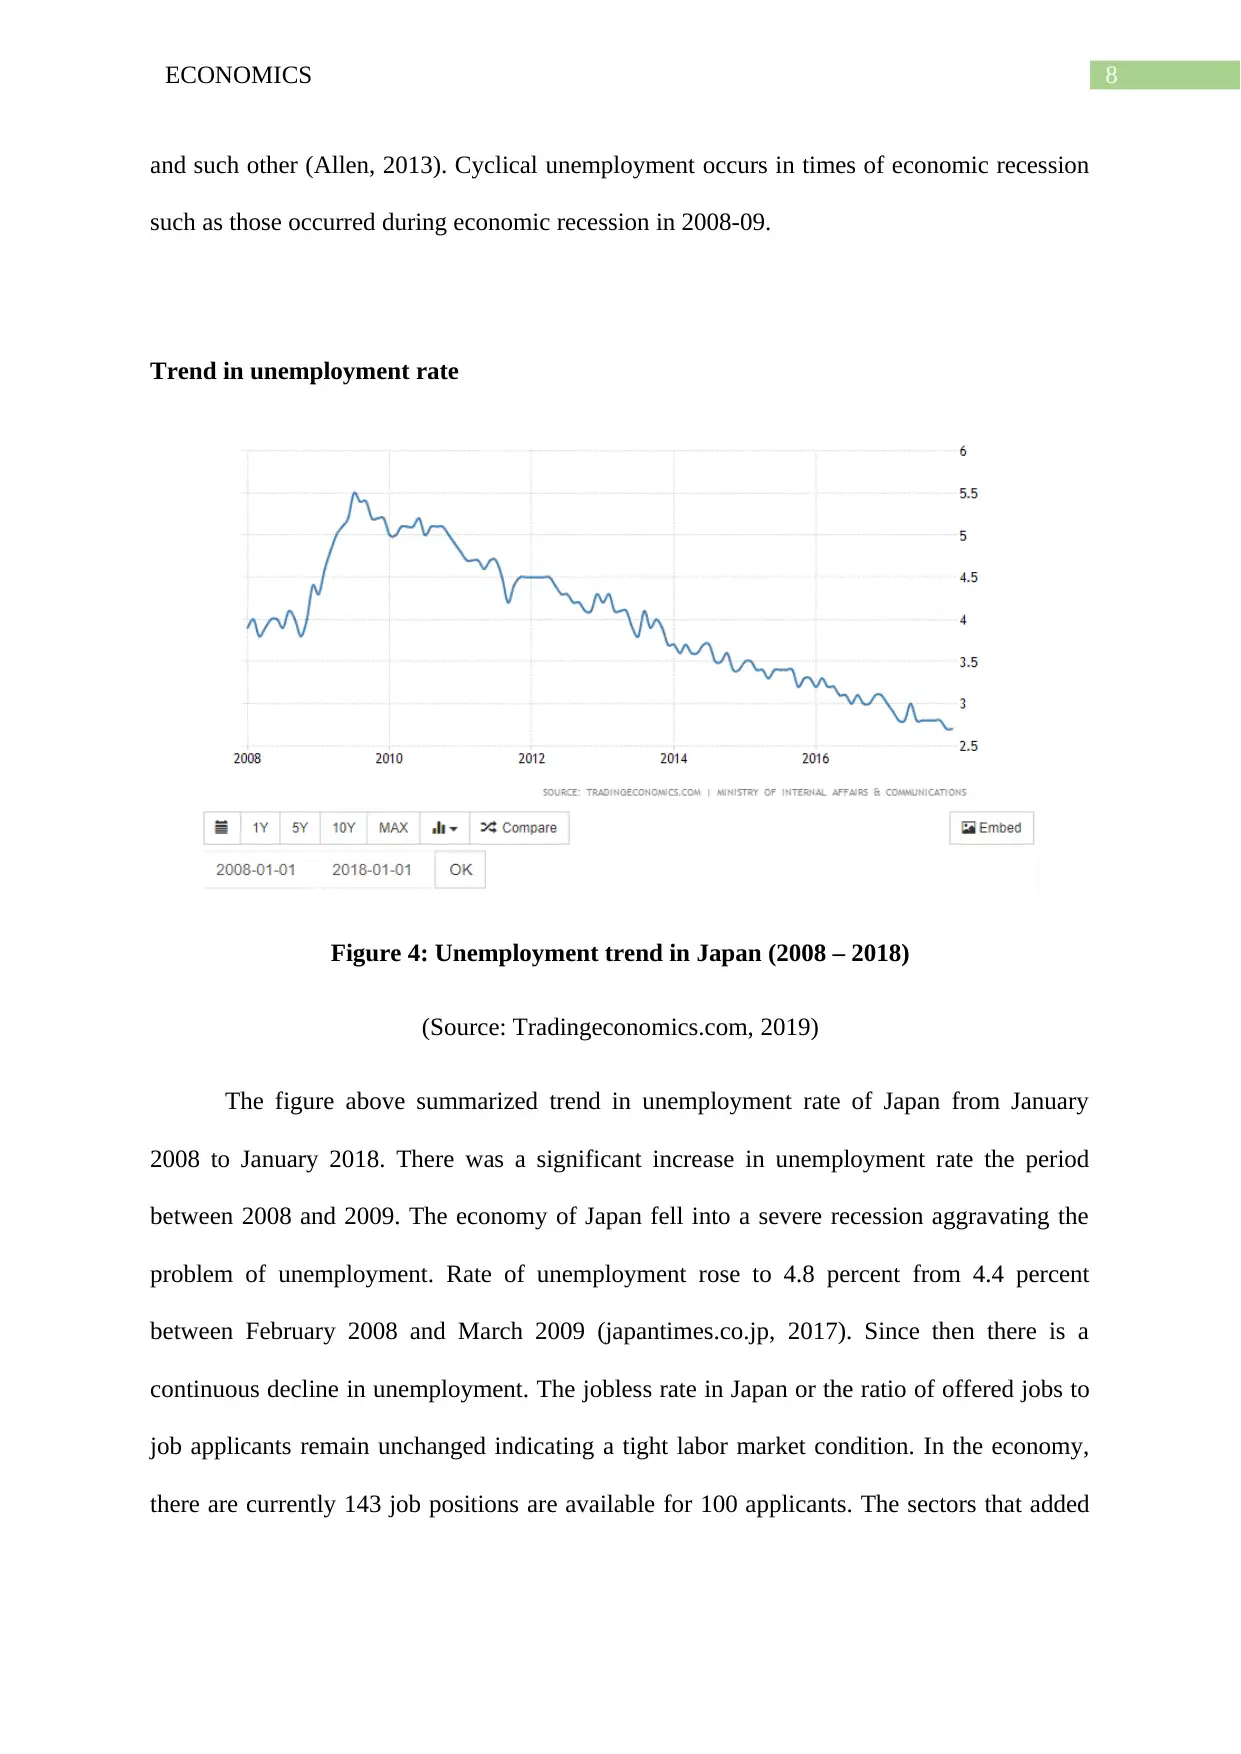
and such other (Allen, 2013). Cyclical unemployment occurs in times of economic recession
such as those occurred during economic recession in 2008-09.
Trend in unemployment rate
Figure 4: Unemployment trend in Japan (2008 – 2018)
(Source: Tradingeconomics.com, 2019)
The figure above summarized trend in unemployment rate of Japan from January
2008 to January 2018. There was a significant increase in unemployment rate the period
between 2008 and 2009. The economy of Japan fell into a severe recession aggravating the
problem of unemployment. Rate of unemployment rose to 4.8 percent from 4.4 percent
between February 2008 and March 2009 (japantimes.co.jp, 2017). Since then there is a
continuous decline in unemployment. The jobless rate in Japan or the ratio of offered jobs to
job applicants remain unchanged indicating a tight labor market condition. In the economy,
there are currently 143 job positions are available for 100 applicants. The sectors that added
⊘ This is a preview!⊘
Do you want full access?
Subscribe today to unlock all pages.
Trusted by 1+ million students worldwide
9ECONOMICS
more jobs to the economy include information and technology, construction, wholesale and
retail trade.
Government measure to overcome employment
In order to provide employment support to all people including youth, disabled, single
mothers, elderly and all those who are seeking for a job opportunity, it is important
implement different job placement program. The Public Employment Service Office in Japan
operates under central government and design job placement program, the Employment
Insurance System and other measures of unemployment in an effective manner. The
government of Japan has taken measures to promote participation of women (Francks, 2015).
These measures include grasping current promotion/recruitment circumstances for women,
setting objectives and designing voluntary action plan to help the agents achieving the
objectives. Government also extends support to companies in order to enable them to take
proactive measures to make it easier for women to work while raising their children. In 2014,
government increased investment in Labor Mobility Support Subsidy (g20.utoronto.ca.,
2014). The program targeted not only small and medium sized enterprises but also large
enterprises. Government has expanded monetary assistance to the company offering to
employees. In order to develop workers’ skill government makes significant investment in
school education, apprentices, vocational training and higher education.
Price level analysis
Inflation
Inflation refers to the economic term of a sustained increase in the overall price level
of goods and services in the economy over time. As price level increases, there is a decline in
value of money, lowering the purchasing power of currency.
Causes of inflation
Paraphrase This Document
Need a fresh take? Get an instant paraphrase of this document with our AI Paraphraser
10ECONOMICS
Aggregate price level in an economy increases either due to an expansion of demand
or contraction of supply. The former is called demand-pull inflation while the latter is termed
as cost-push inflation. The two typical causes of inflation are discussed below
Demand-pull inflation
In an economy, demand-pull inflation occurs when aggregate demand of goods or
services exceeds the aggregate supply. The process starts with an increase in consumers’
demand. Sellers fulfill such an increase in demand with increased supply (Agenor & Montiel,
2015). In the absence of additional supply, producers raise price causing demand-pull
inflation. This is one of the most common cause of inflation.
Cost-push inflation
An economy experiences cost-push inflation when cost of supplying goods increases
resulting in a decline in aggregate supply. Given the demand, a decline in supply pushes up
the prices. Increase in cost of factors such as labor, raw materials and capital lead to cost-
push inflation. As factor cost increases, cost of production increases causing supply to
decline. As supply falls short of demand, price increases.
Trend in inflation rate
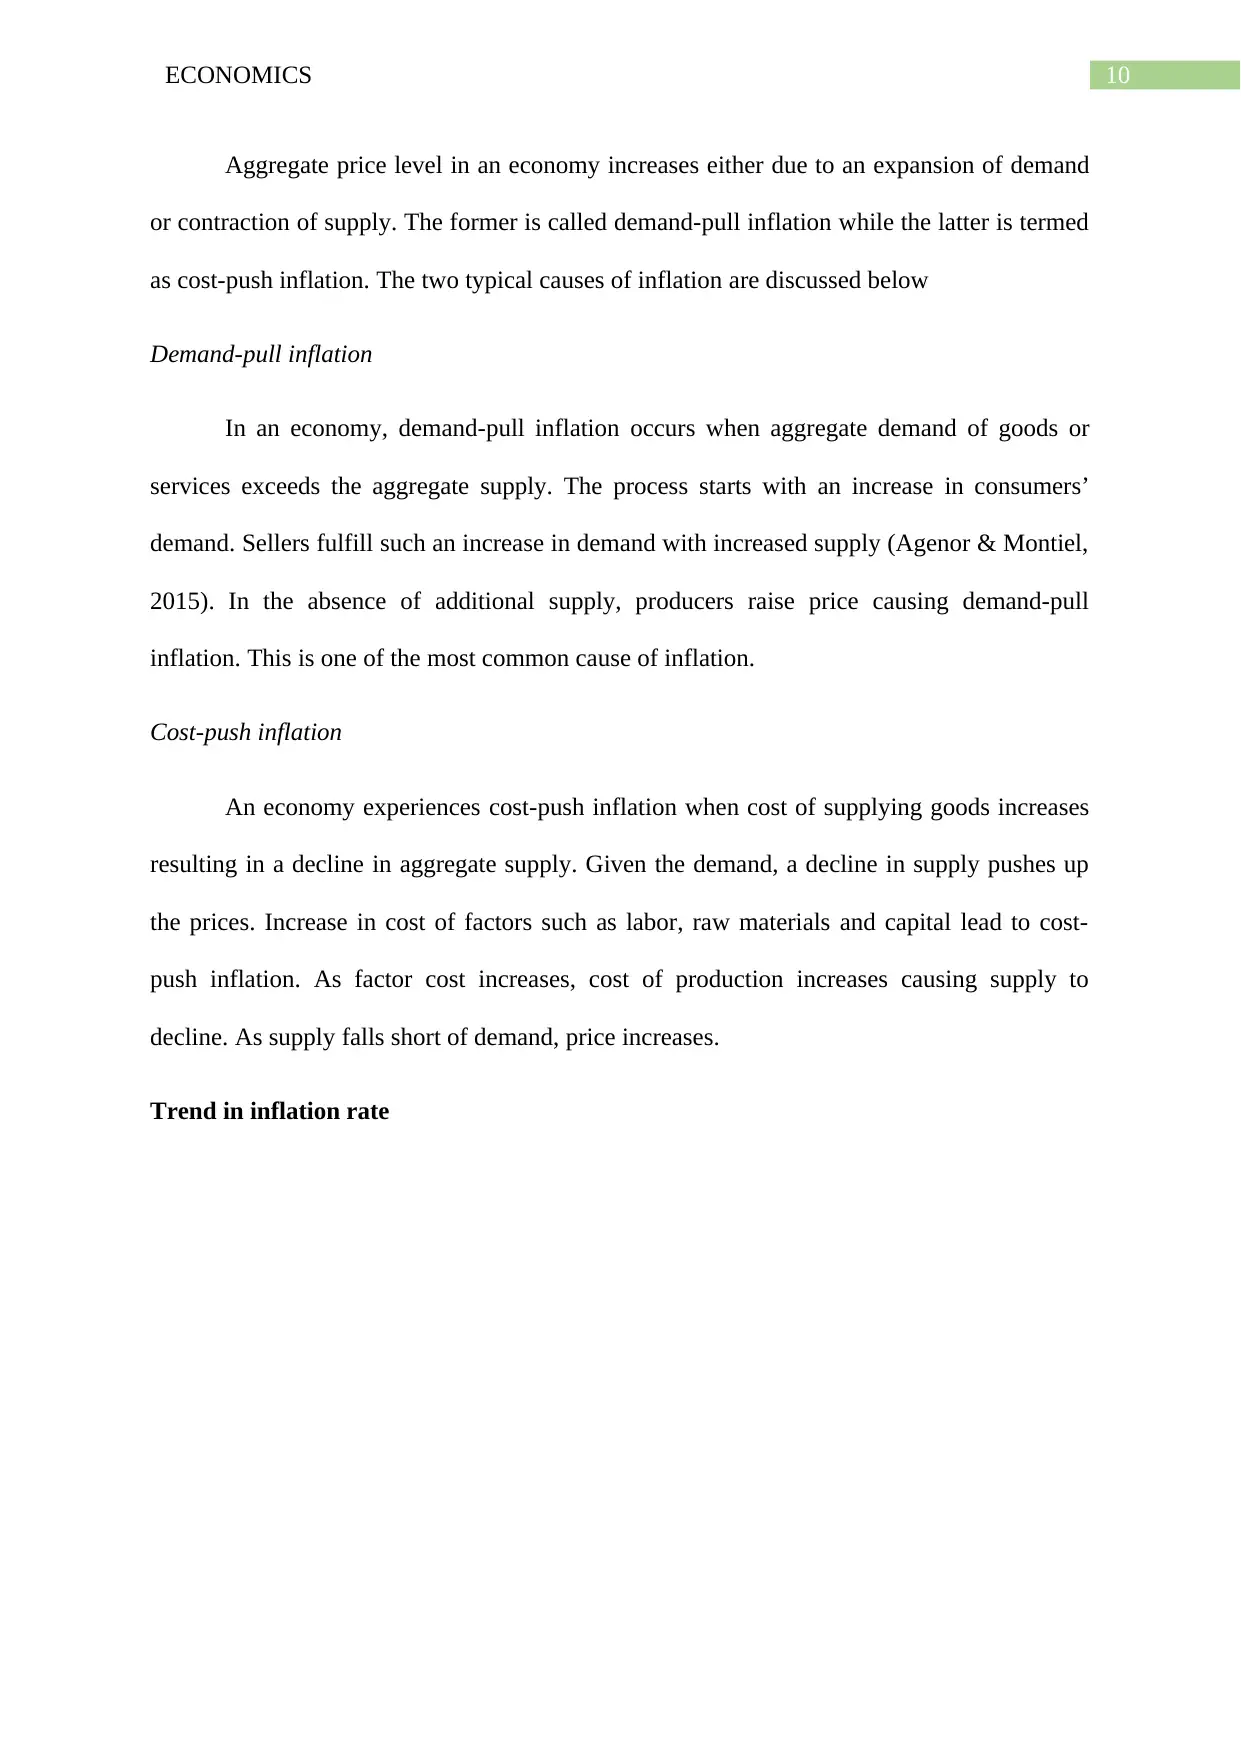
11ECONOMICS
Figure 5: Inflation trend in Japan (2008 – 2018)
(Source: Tradingeconomics.com, 2019)
The above figure summarizes trend of inflation rate in Japan in the last ten years. As
obtained from the above figure, there was a significant decline in price level between 2008
and 2009. The economy during this time experienced a negative inflation or deflation due to
the economy wide recession causing a contraction in business activity and decline in net
export. Following economic recovery price level gradually improved. Japan experienced a
chronic low inflation due to factors such as zero lower bound interest rate, attitude of people
towards price level, weak growth expectation, risk averse behavior of private banks and low
neutral interest rate (Boj.or.jp, 2014). After the technical recession of 2014, inflation rate
slowly moved towards the targeted rate. Price in the economy rises due to improvement in
output gap and increase in medium and long-term inflation expectation
Government measure to achieve stable price
The Bank of Japan Act indicates that monetary policy of central Bank should aim to
attain price stability in the economy. A stable price level in turn contribute to a sound
⊘ This is a preview!⊘
Do you want full access?
Subscribe today to unlock all pages.
Trusted by 1+ million students worldwide
1 out of 15
Related Documents


Your All-in-One AI-Powered Toolkit for Academic Success.
+13062052269
info@desklib.com
Available 24*7 on WhatsApp / Email
![[object Object]](/_next/static/media/star-bottom.7253800d.svg)
Unlock your academic potential
Copyright © 2020–2026 A2Z Services. All Rights Reserved. Developed and managed by ZUCOL.