BM533: Analysis of Demand, Supply, and Economic Theories Report
VerifiedAdded on 2022/12/07
|13
|3343
|222
Report
AI Summary
This report provides a comprehensive analysis of contemporary business economics, addressing key microeconomic concepts of demand and supply. Task 1 explains the law of demand, illustrating movements along the demand curve and shifts in the demand curve with diagrams. It also explains the law of supply, detailing movements along the supply curve and changes in the supply curve, supported by diagrams. Task 2 compares and contrasts emerging theories and models in 21st-century economics with those of the 20th century, linking both to modern business practices. The report emphasizes the importance of understanding these economic principles for business success, incorporating insights from innovation economics and the evolution of economic thought.
Contemporary Business
Economics
Economics
Paraphrase This Document
Need a fresh take? Get an instant paraphrase of this document with our AI Paraphraser
Table of Contents
TASK 1............................................................................................................................................3
1.1 Explain the law of Demand, movement along the same demand curve (with the aid of
diagram) and changes in demand curve (with the aid of diagram)..............................................3
1.2 Explain the law of Supply, movement along the same supply curve (with the aid of
diagram) and changes in supply curve (with the aid of diagram)................................................5
TASK 2............................................................................................................................................8
Compare and contrast emerging theories and models in 21st century contemporary economics
with those of the 20th century, and relate both of these to modern business practices...............8
REFERENCES..............................................................................................................................11
TASK 1
1.1 Explain the law of Demand, movement along the same demand curve (with the aid of
diagram) and changes in demand curve (with the aid of diagram).
Demand is a concept which is defined as the amount of service are good consumers are willing
to pay. The concept of demand depends upon needs and requirements of a customer. It can be
differentiated between a need and want. As per the concept of economist, it is evaluated that
demand is based upon wants and needs but they both are the same thing. Demand totally based
upon the ability for a person to pay (Chi, Huang and George, 2020). If a person is not able to
pay for the product, then it is having no effect if demand. On the other hand, what a buyer is
paying for deeper unit of particular goods or services known as price . the total number of the
amount of units purchased for the particular product or service is known as the quantity
demanded. When there is rising price of gold or service then it is mostly being called us
decreasing the quantity of that service or good. On the other hand, when there is a fall in price
then it will increase the quantity which is demanded. When the price of gallon of gasoline is
increased then it can be stated as an example that people are looking for minimising the
consumption by combining other products. All they can be mass transport for taking weekend
and vacation trip foreclosure at home. According to the concept given by economists, it is said
that there is inverse relationship between quantity and price demanded the law of demand.
According to the law of demand it is stated that all the other variables which are affecting
demand are known to be constant. An example of the scenario is given in the following table
⊘ This is a preview!⊘
Do you want full access?
Subscribe today to unlock all pages.
Trusted by 1+ million students worldwide
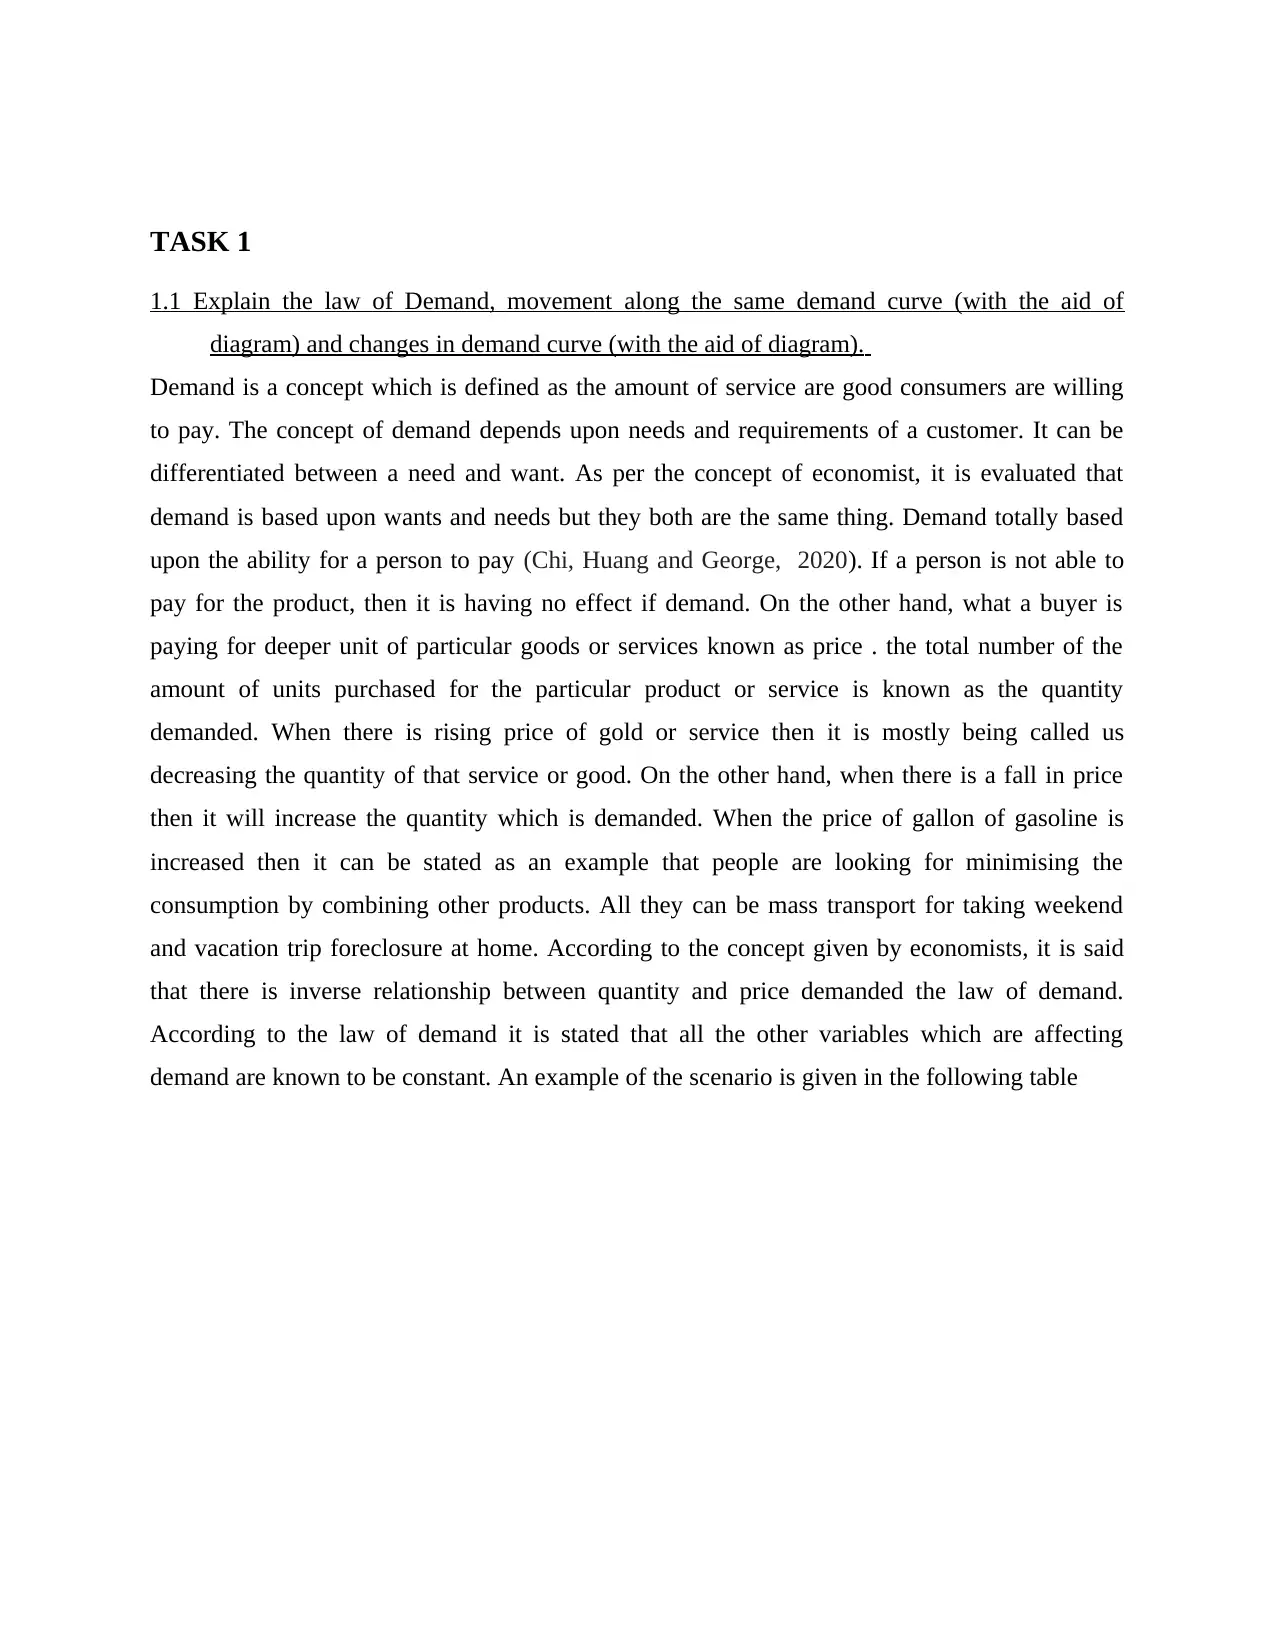
Figure 1Demand curve
(Source: Demand concept, 2019)
The demand curve is shown which provides relationship between quantity and price on the basis
of graph. As per the demand schedule, it is stated that when price rises then quantity demanded
declines. It is stated that price connected the demand curve will provide the inverse relationship
between quantity and price that is demanded. Demand curve will affect the product in oh man
are. It can be appearing relatively for flatter steep or it can be straight or curved (Cohen, 2021).
There are different demand curves which share fundamental similarity that is slope down from
left to right. According to this basis, it is can be said that demand curves embody Law of
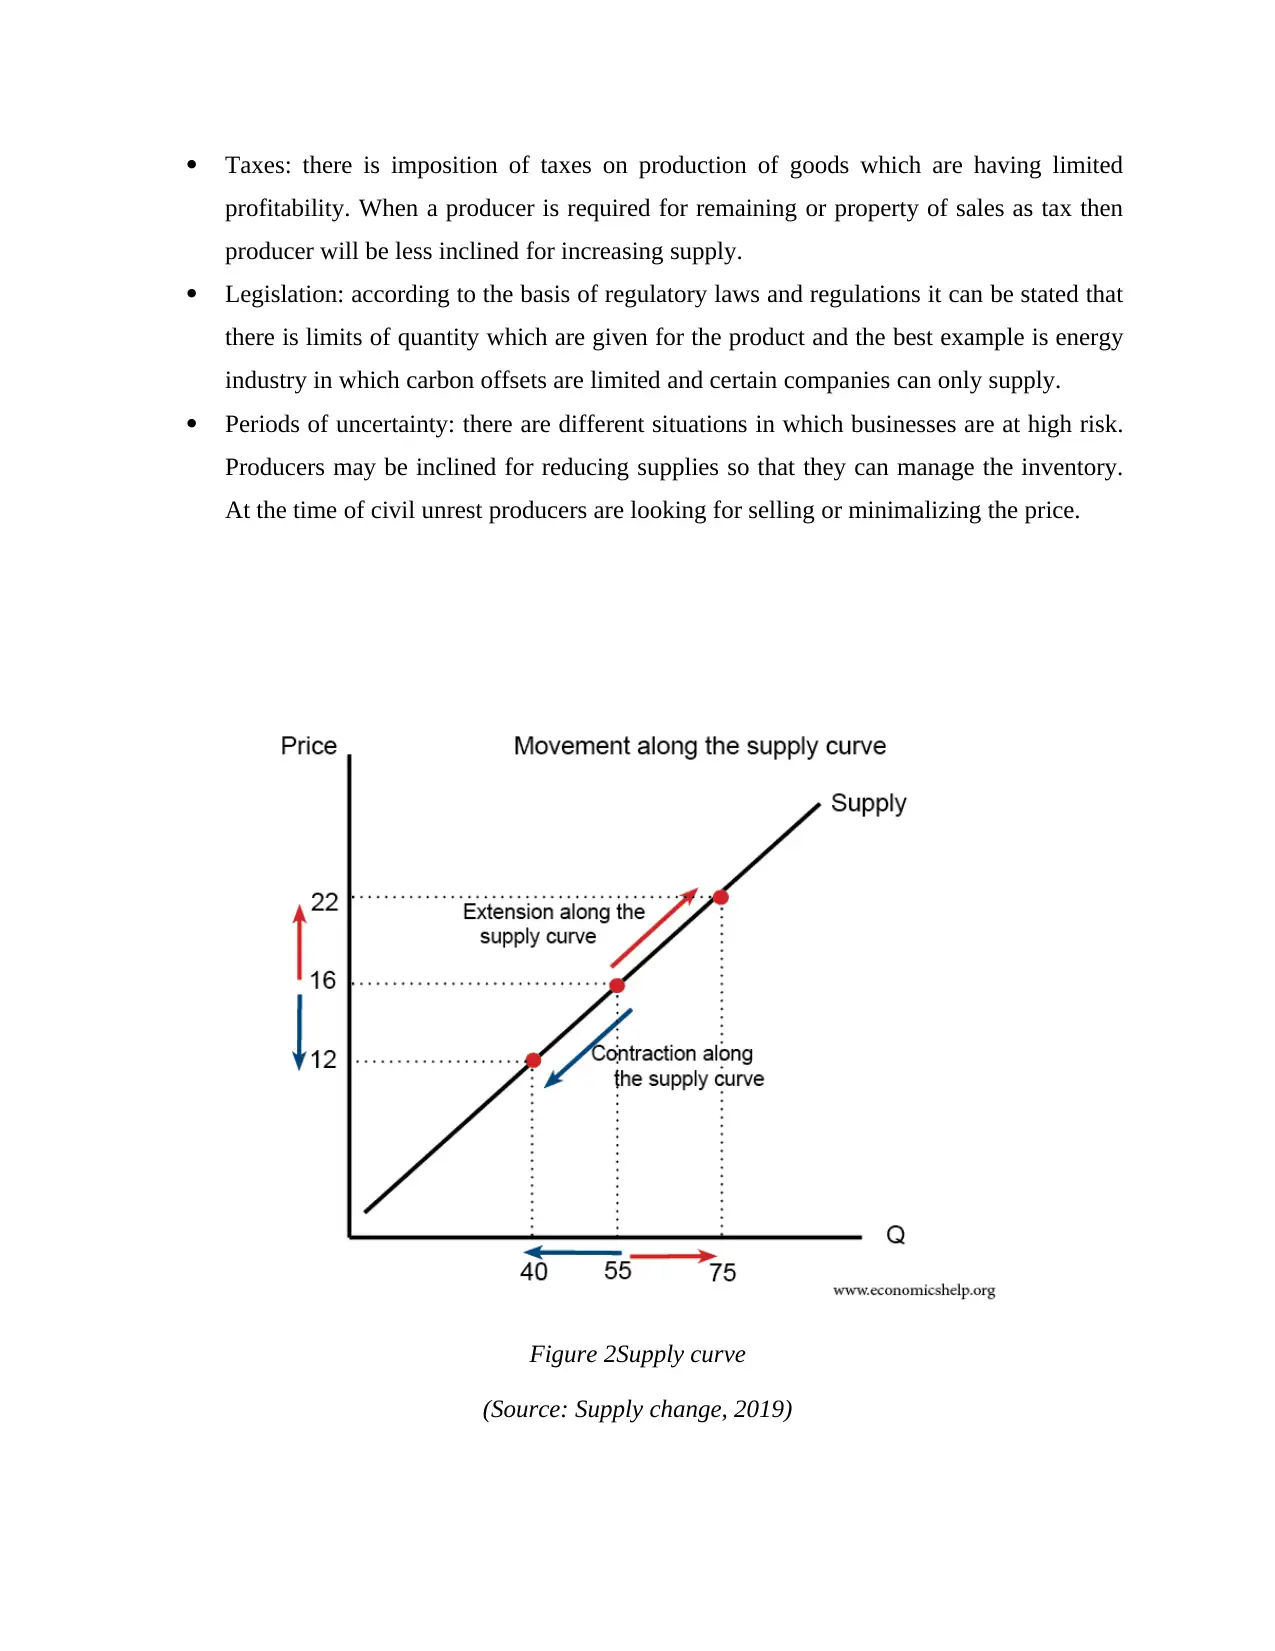
demand. This can be stated that when price increases then quantity demanded declines. It can be
stated that the need of understanding difference between shifts and cause and movement along
the cars on the basis of demand and supply are totally dependent upon the quantity which is
demanded. When there is change in demand it refers to all slight shift an entire demand car. It
can be varied according to the different factors knowingly income, preference, substitute product
price, population. When there is change in quantity demanded then it refers to the movement
(Source: Demand concept, 2019)
The demand curve is shown which provides relationship between quantity and price on the basis
of graph. As per the demand schedule, it is stated that when price rises then quantity demanded
declines. It is stated that price connected the demand curve will provide the inverse relationship
between quantity and price that is demanded. Demand curve will affect the product in oh man
are. It can be appearing relatively for flatter steep or it can be straight or curved (Cohen, 2021).
There are different demand curves which share fundamental similarity that is slope down from
left to right. According to this basis, it is can be said that demand curves embody Law of
demand. This can be stated that when price increases then quantity demanded declines. It can be
stated that the need of understanding difference between shifts and cause and movement along
the cars on the basis of demand and supply are totally dependent upon the quantity which is
demanded. When there is change in demand it refers to all slight shift an entire demand car. It
can be varied according to the different factors knowingly income, preference, substitute product
price, population. When there is change in quantity demanded then it refers to the movement
Paraphrase This Document
Need a fresh take? Get an instant paraphrase of this document with our AI Paraphraser
along with the demand curve that is needed for managing the change in price. When there is
change within these days then the demand curve does not move (Dafnomilis and et.al, 2017). It
only shows the difference between quantity demanded. Demand is known as any amount of
product or service that a consumer is willing for paying for a particular product or service. It is
suggested that there are two main factors on the basis of which demand is affected that is price in
demand for the customer. The willing list for purchasing is dives are able to buy and maintain the
income gesture which is important. The law of the mind states that when there is higher price
than customer has to demand less for an economic good. This law helps in interacting with
determining actual market price and volume of products and goods which are treated with in
market. There are some independent factors which are helpful in affecting shape of market
supply and demand which influences quantities as well as price on the basis of observing market.
Love demand is one of the basic economic laws which helps in tying the economic principle in a
right manner. There are customers who are willing to demand a good determined for managing
the market equilibrium price. It can be associated with price required for managing the quantity
of goods that people are willing to supply for adding the quantity that is demanded by the people
(Hafezalkotob and et.al, 2018).
1.2 Explain the law of Supply, movement along the same supply curve (with the aid of diagram)
and changes in supply curve (with the aid of diagram).
According to law of supply, it can be stated that when are product of price leads to higher
quantities supplied then price is lowered which leads to lower quantities supplied. Supply curves
and supply schedules are tools for summarising the relationship between price and supply. There
are several economists which have provided their views upon supply (Nadal, Szklo and Lucena,
2017). It means the amount of goods or services which are produced for willing to supply at each
and every price (Novkovska, 2020). Price is defined as what the producer is receiving for selling
one unit of service or good. When there is an increase in price it almost leads to an increase in
quantity supply to that service or good. It decreases according to the price Andy quantity
supplied. It can be given by an example that when price of gasoline drivers, then it encourages
the profit seeking companies to take serious actions. They look upon expanding the exploration
for oil reserves, drills and investing in more pipelines. It can be stated that refining the gasoline
will help in building new oil refineries and purchasing additional pipelines and trucks. There are
several economists who are managing positive relation between quantity and price supplied
which provides higher prices leading to higher quantities supplied. According to the law of
supply it is assumed that all the variables that affect supply are held constant (Song and et.al,
2020). was a pleasure dual is defined as stable which provides information regarding quantity
supplied at each price. On the other hand, a supply graph Is known as graph which shows
quantity supplied at each price. The supply curve is also known as supply schedule because it is
known as graphical representation for the supply schedule. Price is measured on the basis of
dollars per gallon of gasoline and quantity supplied is measured in 1,000,000. According to the
information provided in supply curve with quantity it can be stated that shape of supply curves
vary according to the product. In context of economic terminology, it can be stated that supply is
not same as quantity which is supplied. There are several economists who refer to supply and it
means relationship between range of quantities supplied and price. When there is relationship
which is acting on illustrating supply current supply schedule then it is easy to manage the curves
(Woodring, Hyde and McLennan, 2021). There are several economists who refer the quantity
supplied on the basis of schedule and manage the quantity which is supplied on specific point.
According to the law of supply, it can be stated that it is the basic principle used by economics
for asserting the assumption which is kept constant for increasing the price of goods which result
in corresponding direct and it increases this supply. The law works according to decrease in
price. Law of supply is depicted on the behaviour of producer when the prizes decreasing or
increasing. When there is rise in price, then tendency for increasing supply enhances because
there is no more profit that can be earned. It can also be stated that when price falls then
producers stand for decreasing production on the basis of declined economic opportunity for
profit. When there is over arcing relationship between price and quantity, then it supplies for the
factors which are remaining constant. Basically, there are four factors on which quantity supplied
is given. These are mentioned below:
Cost of production: it is stated that when there are chances within cost of raw material or
Labour for producing a unit of supply then volume will change accordingly. It is assumed
that selling price is remained same. Variable cost is affecting profit margins as a big
factor and it targets quantity for producing.
Technological changes: according to the increment in technological aspect, there is
boosting efficiency of the unit produced. It is directly related to the cost of production
⊘ This is a preview!⊘
Do you want full access?
Subscribe today to unlock all pages.
Trusted by 1+ million students worldwide
Taxes: there is imposition of taxes on production of goods which are having limited
profitability. When a producer is required for remaining or property of sales as tax then
producer will be less inclined for increasing supply.
Legislation: according to the basis of regulatory laws and regulations it can be stated that
there is limits of quantity which are given for the product and the best example is energy
industry in which carbon offsets are limited and certain companies can only supply.
Periods of uncertainty: there are different situations in which businesses are at high risk.
Producers may be inclined for reducing supplies so that they can manage the inventory.
At the time of civil unrest producers are looking for selling or minimalizing the price.
Figure 2Supply curve
(Source: Supply change, 2019)
Paraphrase This Document
Need a fresh take? Get an instant paraphrase of this document with our AI Paraphraser
TASK 2
Compare and contrast emerging theories and models in 21st century contemporary economics
with those of the 20th century, and relate both of these to modern business practices.
In the year 1883, John Maynard was one of the greatest economists off 20th century who
provided a subject area for managing the off thinking. According to him, economics is known as
mattered not a doctrine. He thinks that it is a perception of mind and a technique of thinking that
helps for drawing correct conclusions. Economists off 20th century overseen to look world
through a different lens and not on the basis of biologists, anthropologists, practitioners and
classicists. These were the people who analyse are different issues and problems related to
economic theories and depends upon particular assumption regarding human behaviour . there
are different assumptions on the basis of anthropologists and psychologists which have to be
used by these people to manage work. There is a simple theory which represents on how to or
other variables are interacting with each other. Main motive of this story is to collect a complex
and real world issue and make it simplify for managing these solutions. It can be stated that there
are different complex issues which have been provided for managing the abstract representation
and it is a model for empirical or applied representation. There is an architect who is planning for
major office building then he should have a physical model on which the building should be
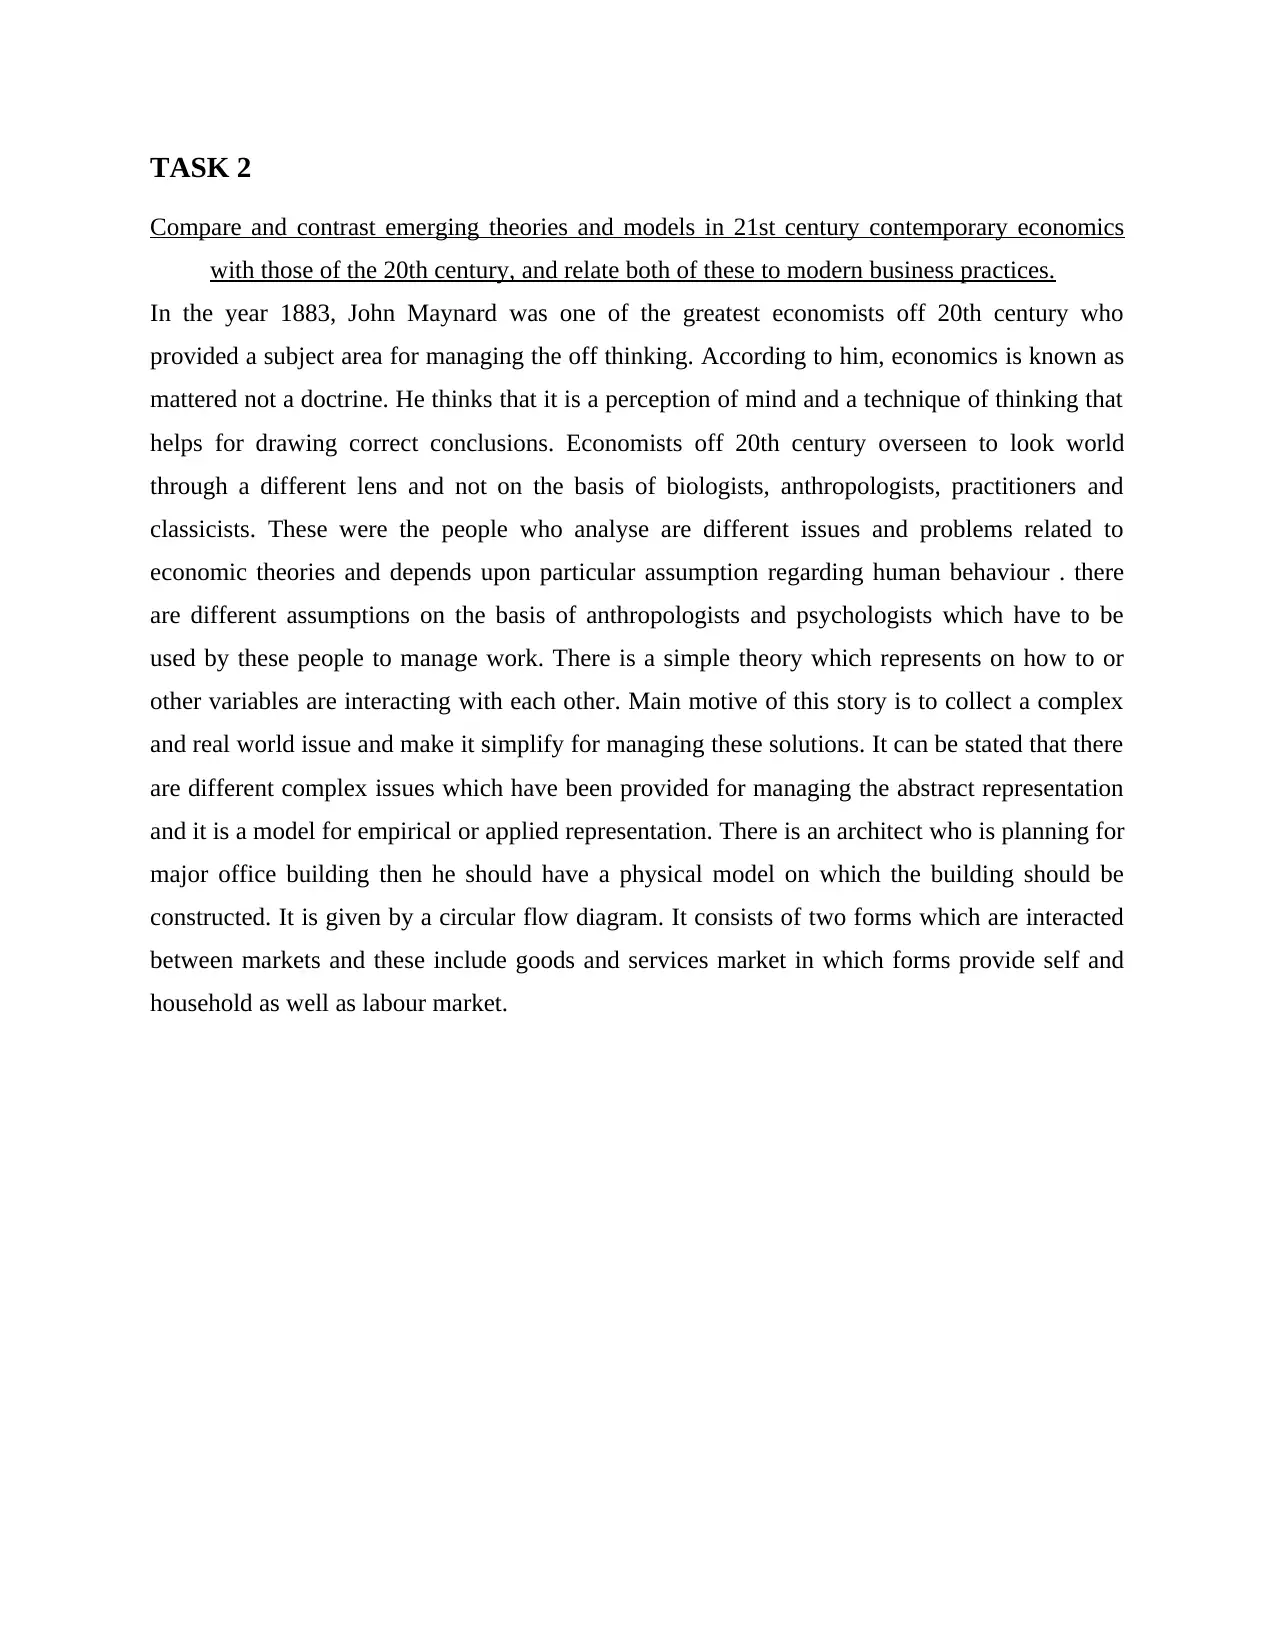
constructed. It is given by a circular flow diagram. It consists of two forms which are interacted
between markets and these include goods and services market in which forms provide self and
household as well as labour market.
Compare and contrast emerging theories and models in 21st century contemporary economics
with those of the 20th century, and relate both of these to modern business practices.
In the year 1883, John Maynard was one of the greatest economists off 20th century who
provided a subject area for managing the off thinking. According to him, economics is known as
mattered not a doctrine. He thinks that it is a perception of mind and a technique of thinking that
helps for drawing correct conclusions. Economists off 20th century overseen to look world
through a different lens and not on the basis of biologists, anthropologists, practitioners and
classicists. These were the people who analyse are different issues and problems related to
economic theories and depends upon particular assumption regarding human behaviour . there
are different assumptions on the basis of anthropologists and psychologists which have to be
used by these people to manage work. There is a simple theory which represents on how to or
other variables are interacting with each other. Main motive of this story is to collect a complex
and real world issue and make it simplify for managing these solutions. It can be stated that there
are different complex issues which have been provided for managing the abstract representation
and it is a model for empirical or applied representation. There is an architect who is planning for
major office building then he should have a physical model on which the building should be
constructed. It is given by a circular flow diagram. It consists of two forms which are interacted
between markets and these include goods and services market in which forms provide self and
household as well as labour market.
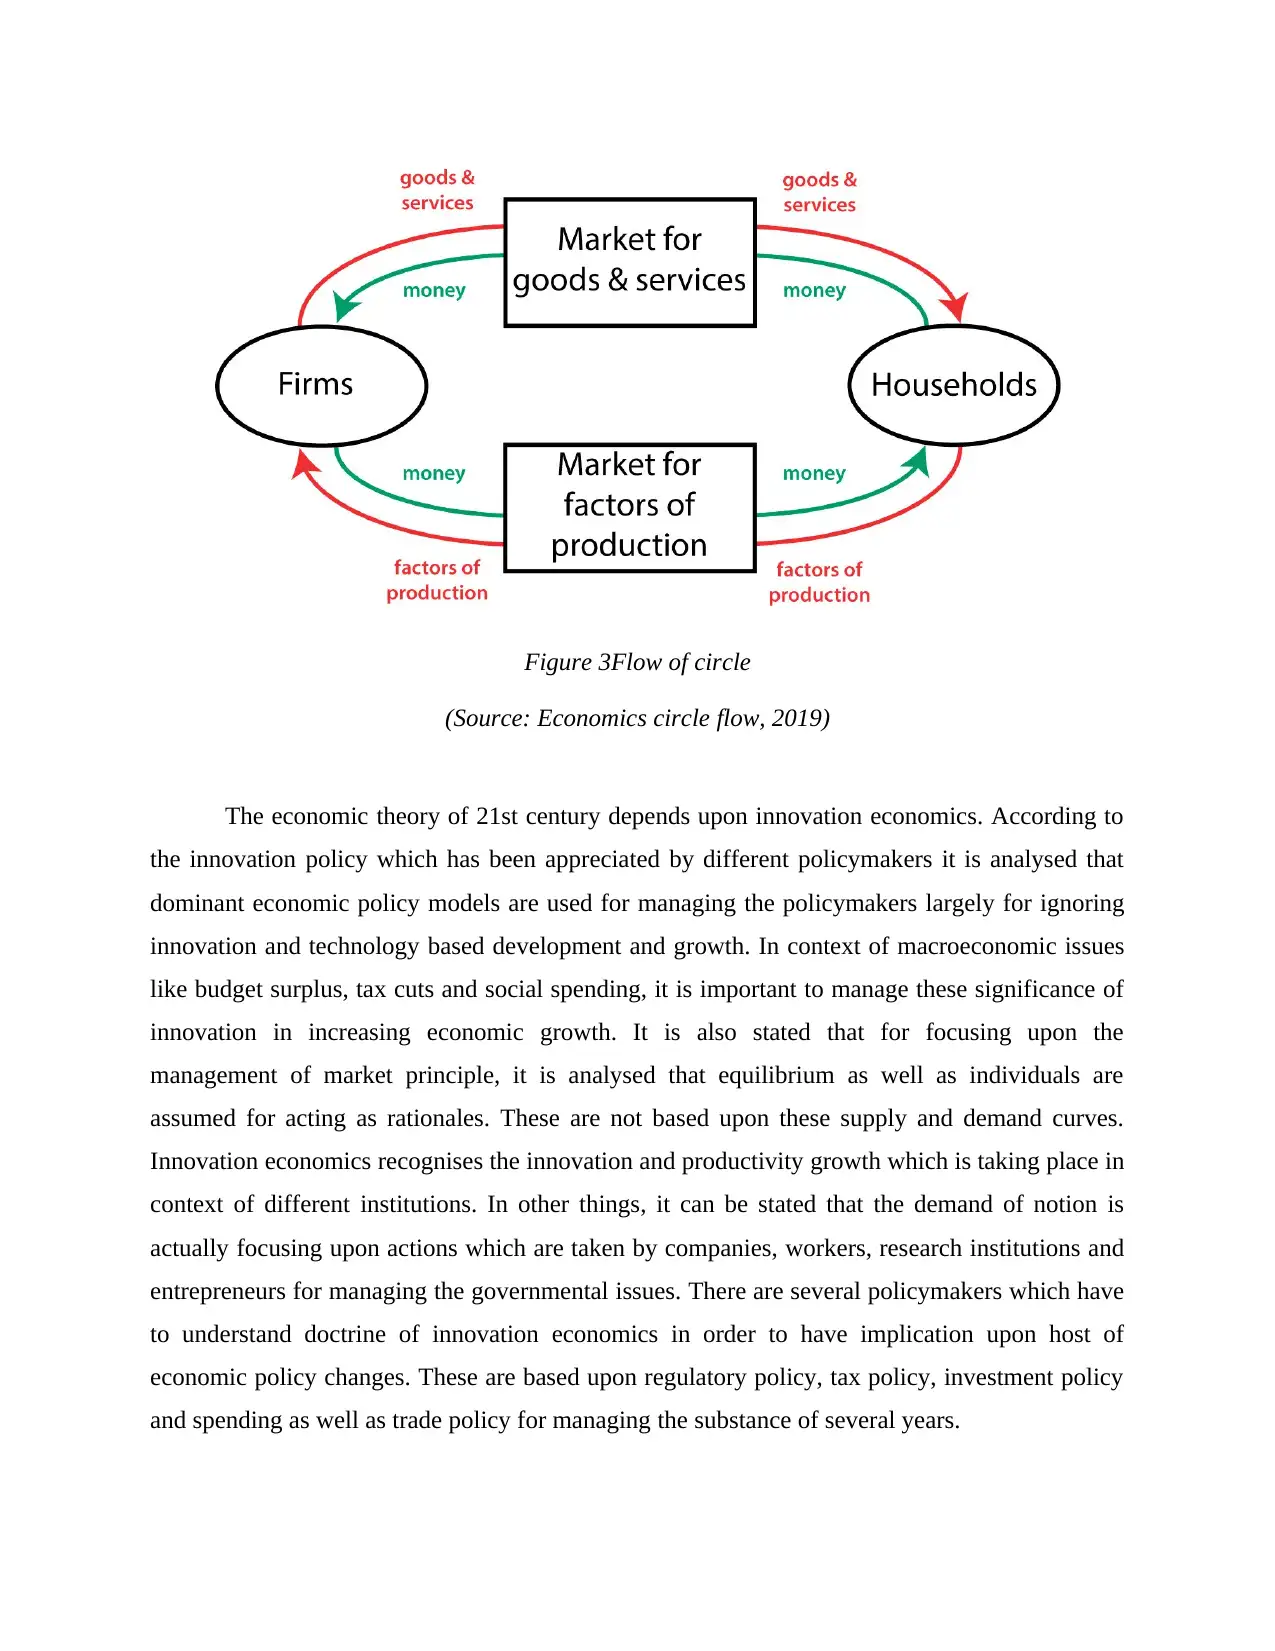
Figure 3Flow of circle
(Source: Economics circle flow, 2019)
The economic theory of 21st century depends upon innovation economics. According to
the innovation policy which has been appreciated by different policymakers it is analysed that
dominant economic policy models are used for managing the policymakers largely for ignoring
innovation and technology based development and growth. In context of macroeconomic issues
like budget surplus, tax cuts and social spending, it is important to manage these significance of
innovation in increasing economic growth. It is also stated that for focusing upon the
management of market principle, it is analysed that equilibrium as well as individuals are
assumed for acting as rationales. These are not based upon these supply and demand curves.
Innovation economics recognises the innovation and productivity growth which is taking place in
context of different institutions. In other things, it can be stated that the demand of notion is
actually focusing upon actions which are taken by companies, workers, research institutions and
entrepreneurs for managing the governmental issues. There are several policymakers which have
to understand doctrine of innovation economics in order to have implication upon host of
economic policy changes. These are based upon regulatory policy, tax policy, investment policy
and spending as well as trade policy for managing the substance of several years.
⊘ This is a preview!⊘
Do you want full access?
Subscribe today to unlock all pages.
Trusted by 1+ million students worldwide
It can be stated that economists are carrying a set off different theories for managing the toolkit
of different professionals. There are several economic issues and problems which are solved by
analysing the theories properly. These provide an insight for solving the issue or problem in
efficient manner. According to views of economist’s former tourists can be expressed on the
basis of mathematical equations, graphs and diagrams which help in solving the problem
effectively. There is use of graph which helps for figuring out the answer properly. Economics is
the concept that is studied for managing the issues and problems but a long term by using
theories and models. This supply and demand theory is used for managing lot of problems of
present scenario. Economic sts analyse different problems and issues depending upon
disciplinary experts. The main technique that economists are using is to illustrate different
answers for problem.It can be stated that main tools for economics are theories and models.
According to old neoclassical theory of economic growth, it can be stated that The main aspect
for economics is aggregate production function. According to this aggregate output of economy
totally depends upon the concept which is determined by conventional factors of the production.
It states that it totally depends upon quantity of capital and Labour. On the other hand, it can be
stated that efficiency of prevailing technology with respecting economy will help in managing
the commonly turned global function which is simply used as residual. There are several
characteristics of this model in which underlying production functions are important it can be
taken as technological efficiency for contributing the evolution of technology and managing
common assumptions for constant return. The economy which is described in 20th century has
more striking growth characteristics. It is assumed that it is for the sake of simplicity and
population as well as Labour to interact with the marginal productivity for managing the capital
process for the economic process. An economic model is developed for managing and handling
various study materials related to the current problems. Macroeconomics has contributed a lot in
dominating core approach for managing the decades. When there is understanding of large
economic shocks, it is analysed that temporary as well as economic returns have to be managed
for equilibrium and growth. There are several assumptions which have to be unsuited for
creating a large crisis and transition for unemployment and financial system crisis . there is an
analytical straitjacket which is meaningful for old parody gum and recognising the active charge
UN certainly given by the future and helpful for economic decisions. There is understanding
Paraphrase This Document
Need a fresh take? Get an instant paraphrase of this document with our AI Paraphraser

regarding functions for empirically grounded diagnostic techniques which economics are
building for today in order to analyse the range of models and tools. There is placing of weight
and idolising model in order to blink macroeconomics and spread the change across the business.
building for today in order to analyse the range of models and tools. There is placing of weight
and idolising model in order to blink macroeconomics and spread the change across the business.
REFERENCES
Books and Journals
Chi, M., Huang, R. and George, J.F., 2020. Collaboration in demand-driven supply chain: Based
on a perspective of governance and IT-business strategic alignment. International Journal of
Information Management, 52, p.102062.
Cohen, E., 2021. Regulating Demand or Supply: Examining Israel’s Public Policy for Reducing
Housing Prices During 2015–2019. Housing Policy Debate, pp.1-16.
Dafnomilis, I., Hoefnagels, R., Pratama, Y.W., Schott, D.L., Lodewijks, G. and Junginger, M.,
2017. Review of solid and liquid biofuel demand and supply in Northwest Europe towards 2030–
A comparison of national and regional projections. Renewable and Sustainable Energy
Reviews, 78, pp.31-45.
Hafezalkotob, A., Mahmoudi, R., Hajisami, E. and Wee, H.M., 2018. Wholesale-retail pricing
strategies under market risk and uncertain demand in supply chain using evolutionary game
theory. Kybernetes.
Nadal, R., Szklo, A. and Lucena, A., 2017. Time-varying impacts of demand and supply oil
shocks on correlations between crude oil prices and stock markets indices. Research in
International Business and Finance, 42, pp.1011-1020.
Novkovska, B., 2020. Skills demand and supply in North Macedonia: an analysis at regional and
local levels.
Song, H., Yu, S., Liu, F., Sun, X. and Sun, T., 2020, December. Optimal Subsidy Support for
Market-Oriented Transformation of Elderly Care: Focus on the Gap between Supply and
Demand in Aging Regions of China. In Healthcare (Vol. 8, No. 4, p. 441). Multidisciplinary
Digital Publishing Institute.
Woodring, D., Hyde, T. and McLennan, J., 2021. There's Demand For Recyclate, But Little
Supply: Recycled and virgin plastics pricing decouple as global supply gap widens. Plastics
Engineering, 77(2), pp.39-41.
Žic, J. and Žic, S., Experimental analysis of market demand influence on greenhouse gas
emissions in supply chains. In Proceedings of 10th International Scientific Conference on
Management of Technology-Step to Sustainable Production (MOTSP 2018)/Ćosić, Predrag-
Zagreb: Croatian Association for PLM, 2018 (p. 128).
⊘ This is a preview!⊘
Do you want full access?
Subscribe today to unlock all pages.
Trusted by 1+ million students worldwide
1 out of 13
Related Documents


Your All-in-One AI-Powered Toolkit for Academic Success.
+13062052269
info@desklib.com
Available 24*7 on WhatsApp / Email
![[object Object]](/_next/static/media/star-bottom.7253800d.svg)
Unlock your academic potential
Copyright © 2020–2026 A2Z Services. All Rights Reserved. Developed and managed by ZUCOL.