Macroeconomic Analysis: Australia, China, and USA Economics Report
VerifiedAdded on 2023/04/25
|15
|3482
|136
Report
AI Summary
This economics report provides a comprehensive comparative analysis of the macroeconomic conditions in Australia, China, and the USA. It evaluates GDP growth, unemployment rates, and inflation trends in each country, examining the phases of the business cycle and employing the aggregate demand and aggregate supply model to illustrate economic fluctuations. The report further delves into the impact of the global financial crisis on each nation, assessing its effects on economic performance and stability. The analysis includes an introduction to the economic structures of each country, highlighting key sectors and their contributions to GDP. The report also addresses major macroeconomic issues such as unemployment, offering insights into their causes and consequences within the context of each country's economy. The report concludes with a macroeconomic briefing, summarizing key findings and providing a comparative overview of the economic performance of Australia, China, and the USA during the analyzed period.
Running head: ECONOMICS
Economics
Name of the Student
Name of the University
Course ID
Economics
Name of the Student
Name of the University
Course ID
Paraphrase This Document
Need a fresh take? Get an instant paraphrase of this document with our AI Paraphraser
1ECONOMICS
Table of Contents
Introduction...........................................................................................................................................2
Evaluation of GDP growth, unemployment and inflation......................................................................2
Australia............................................................................................................................................2
USA....................................................................................................................................................4
China..................................................................................................................................................5
Business Cycle phases............................................................................................................................7
Australia............................................................................................................................................7
USA....................................................................................................................................................8
China..................................................................................................................................................8
Aggregate demand and aggregate supply model..................................................................................8
Macroeconomic issues in the selected countries................................................................................10
Effect of global financial crisis..............................................................................................................10
Australia..........................................................................................................................................11
China................................................................................................................................................11
USA..................................................................................................................................................11
Macroeconomic briefing of Australia, China and USA.........................................................................12
References list.....................................................................................................................................13
2ECONOMICS
Introduction
Australia, an economy having a mixed market economic structure is fourteenth largest
economy when considered with respect to nominal GDP. The largest dominating sector of Australian
economy is service sector with service sector contributing 61.1 percent of GDP. After service sector,
two following important sectors are manufacturing and primary sector. China account second largest
nominal GDP in world. In the last few decades, China recorded a rapid economic growth. The most
productive sector of China is manufacturing (Bloch, Rafiq & Salim, 2015). USA records the largest
nominal GDP and second highest per capita GDP (PPP adjusted). The report compares economic
condition of Australia, China and USA in relation to phases of business cycle and major
macroeconomic issues.
Evaluation of GDP growth, unemployment and inflation
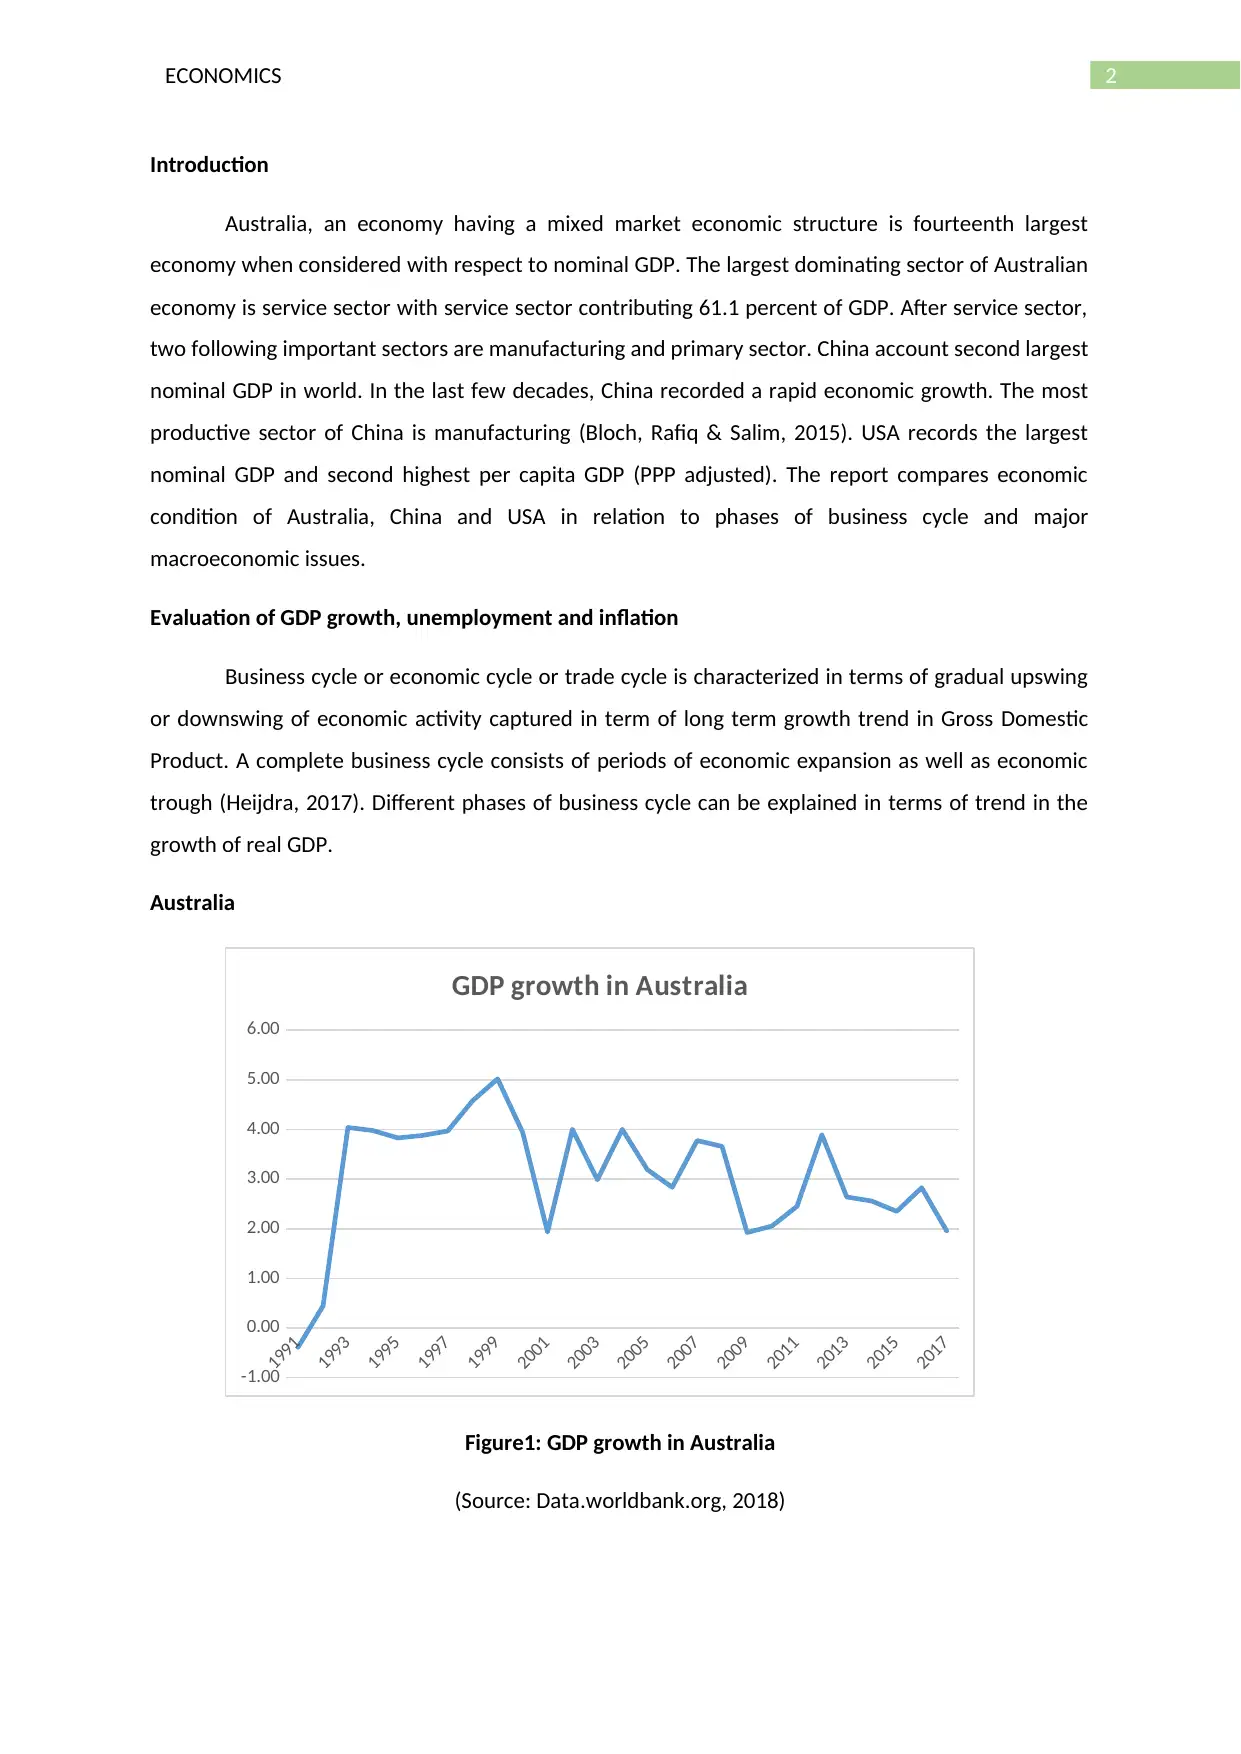
Business cycle or economic cycle or trade cycle is characterized in terms of gradual upswing
or downswing of economic activity captured in term of long term growth trend in Gross Domestic
Product. A complete business cycle consists of periods of economic expansion as well as economic
trough (Heijdra, 2017). Different phases of business cycle can be explained in terms of trend in the
growth of real GDP.
Australia
1991
1993
1995
1997
1999
2001
2003
2005
2007
2009
2011
2013
2015
2017
-1.00
0.00
1.00
2.00
3.00
4.00
5.00
6.00
GDP growth in Australia
Figure1: GDP growth in Australia
(Source: Data.worldbank.org, 2018)
Introduction
Australia, an economy having a mixed market economic structure is fourteenth largest
economy when considered with respect to nominal GDP. The largest dominating sector of Australian
economy is service sector with service sector contributing 61.1 percent of GDP. After service sector,
two following important sectors are manufacturing and primary sector. China account second largest
nominal GDP in world. In the last few decades, China recorded a rapid economic growth. The most
productive sector of China is manufacturing (Bloch, Rafiq & Salim, 2015). USA records the largest
nominal GDP and second highest per capita GDP (PPP adjusted). The report compares economic
condition of Australia, China and USA in relation to phases of business cycle and major
macroeconomic issues.
Evaluation of GDP growth, unemployment and inflation
Business cycle or economic cycle or trade cycle is characterized in terms of gradual upswing
or downswing of economic activity captured in term of long term growth trend in Gross Domestic
Product. A complete business cycle consists of periods of economic expansion as well as economic
trough (Heijdra, 2017). Different phases of business cycle can be explained in terms of trend in the
growth of real GDP.
Australia
1991
1993
1995
1997
1999
2001
2003
2005
2007
2009
2011
2013
2015
2017
-1.00
0.00
1.00
2.00
3.00
4.00
5.00
6.00
GDP growth in Australia
Figure1: GDP growth in Australia
(Source: Data.worldbank.org, 2018)
⊘ This is a preview!⊘
Do you want full access?
Subscribe today to unlock all pages.
Trusted by 1+ million students worldwide
3ECONOMICS
1991
1993
1995
1997
1999
2001
2003
2005
2007
2009
2011
2013
2015
2017
0
2
4
6
8
10
12
Unemployment in Australia
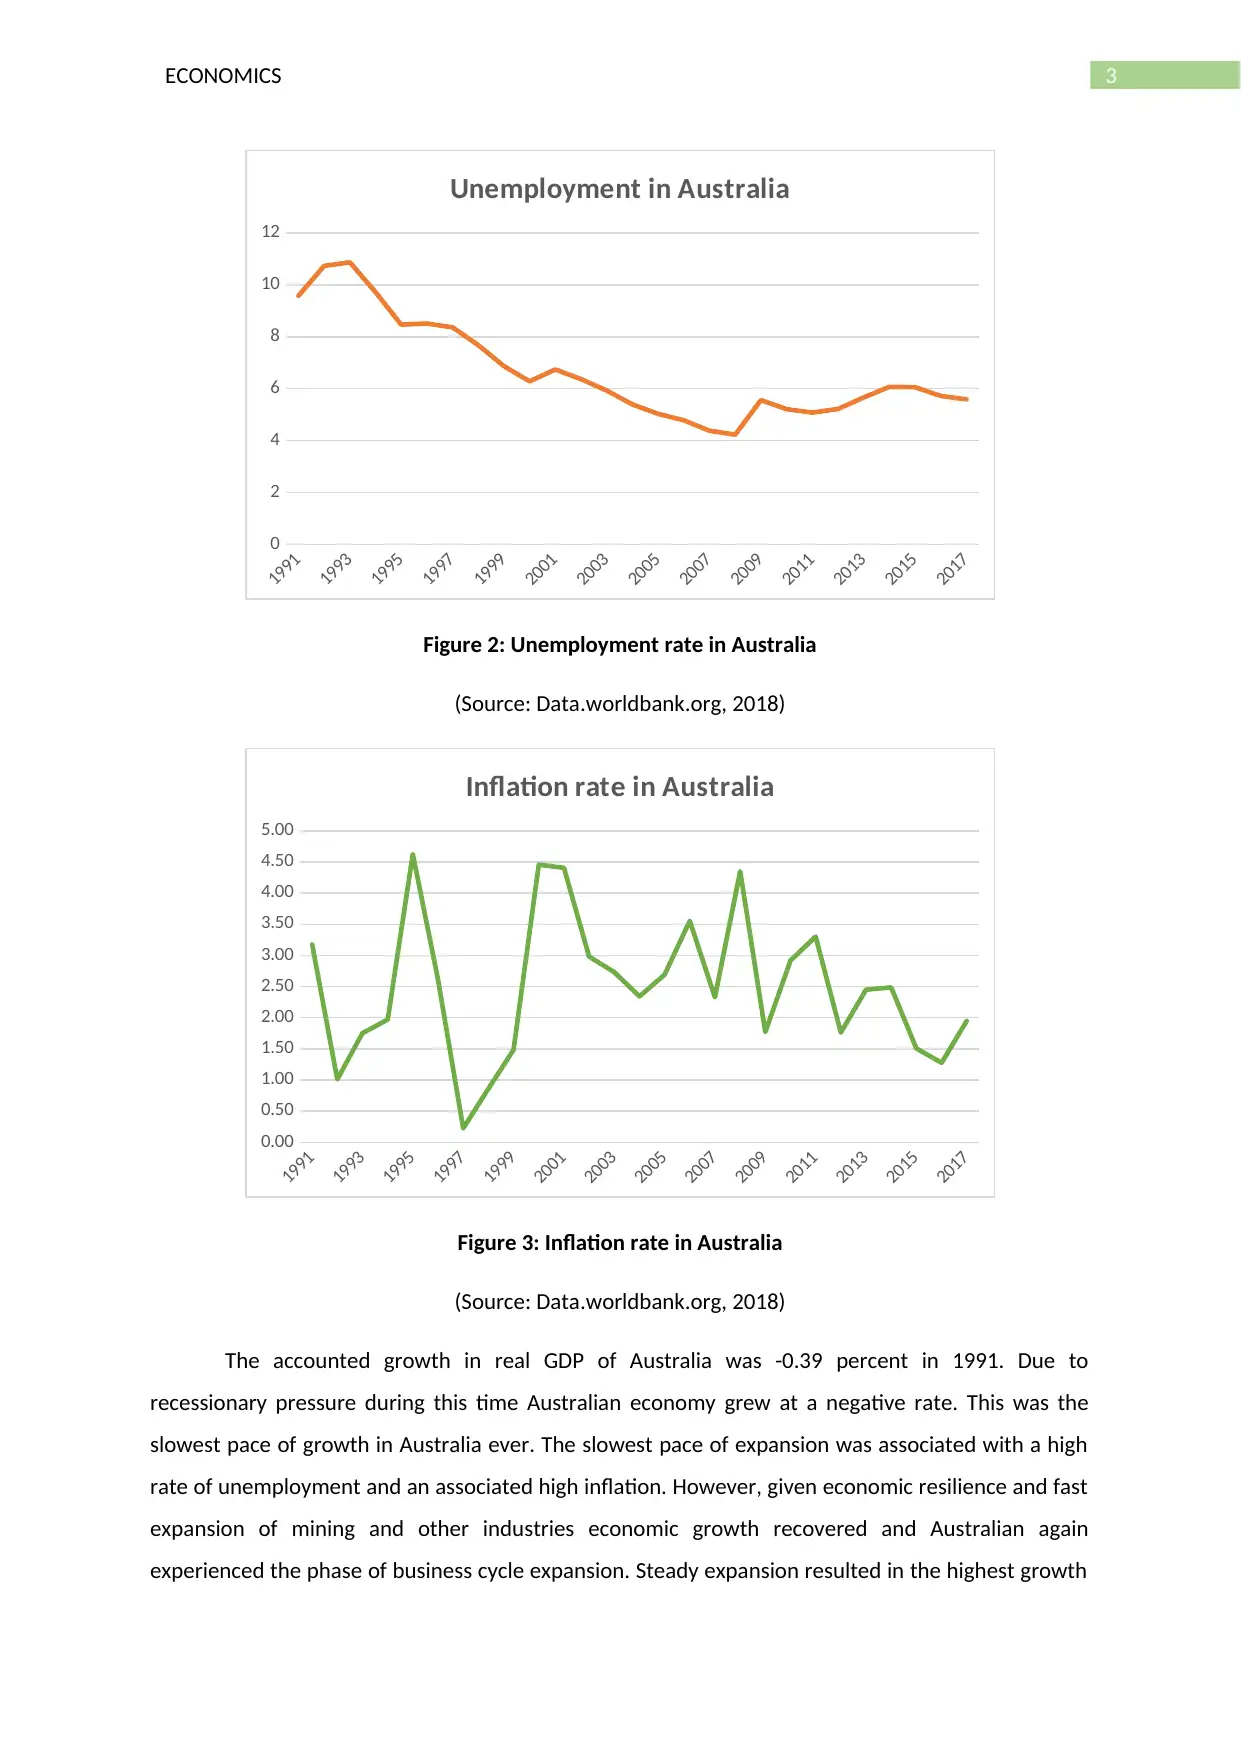
Figure 2: Unemployment rate in Australia
(Source: Data.worldbank.org, 2018)
1991
1993
1995
1997
1999
2001
2003
2005
2007
2009
2011
2013
2015
2017
0.00
0.50
1.00
1.50
2.00
2.50
3.00
3.50
4.00
4.50
5.00
Inflation rate in Australia
Figure 3: Inflation rate in Australia
(Source: Data.worldbank.org, 2018)
The accounted growth in real GDP of Australia was -0.39 percent in 1991. Due to
recessionary pressure during this time Australian economy grew at a negative rate. This was the
slowest pace of growth in Australia ever. The slowest pace of expansion was associated with a high
rate of unemployment and an associated high inflation. However, given economic resilience and fast
expansion of mining and other industries economic growth recovered and Australian again
experienced the phase of business cycle expansion. Steady expansion resulted in the highest growth
1991
1993
1995
1997
1999
2001
2003
2005
2007
2009
2011
2013
2015
2017
0
2
4
6
8
10
12
Unemployment in Australia
Figure 2: Unemployment rate in Australia
(Source: Data.worldbank.org, 2018)
1991
1993
1995
1997
1999
2001
2003
2005
2007
2009
2011
2013
2015
2017
0.00
0.50
1.00
1.50
2.00
2.50
3.00
3.50
4.00
4.50
5.00
Inflation rate in Australia
Figure 3: Inflation rate in Australia
(Source: Data.worldbank.org, 2018)
The accounted growth in real GDP of Australia was -0.39 percent in 1991. Due to
recessionary pressure during this time Australian economy grew at a negative rate. This was the
slowest pace of growth in Australia ever. The slowest pace of expansion was associated with a high
rate of unemployment and an associated high inflation. However, given economic resilience and fast
expansion of mining and other industries economic growth recovered and Australian again
experienced the phase of business cycle expansion. Steady expansion resulted in the highest growth
Paraphrase This Document
Need a fresh take? Get an instant paraphrase of this document with our AI Paraphraser
4ECONOMICS
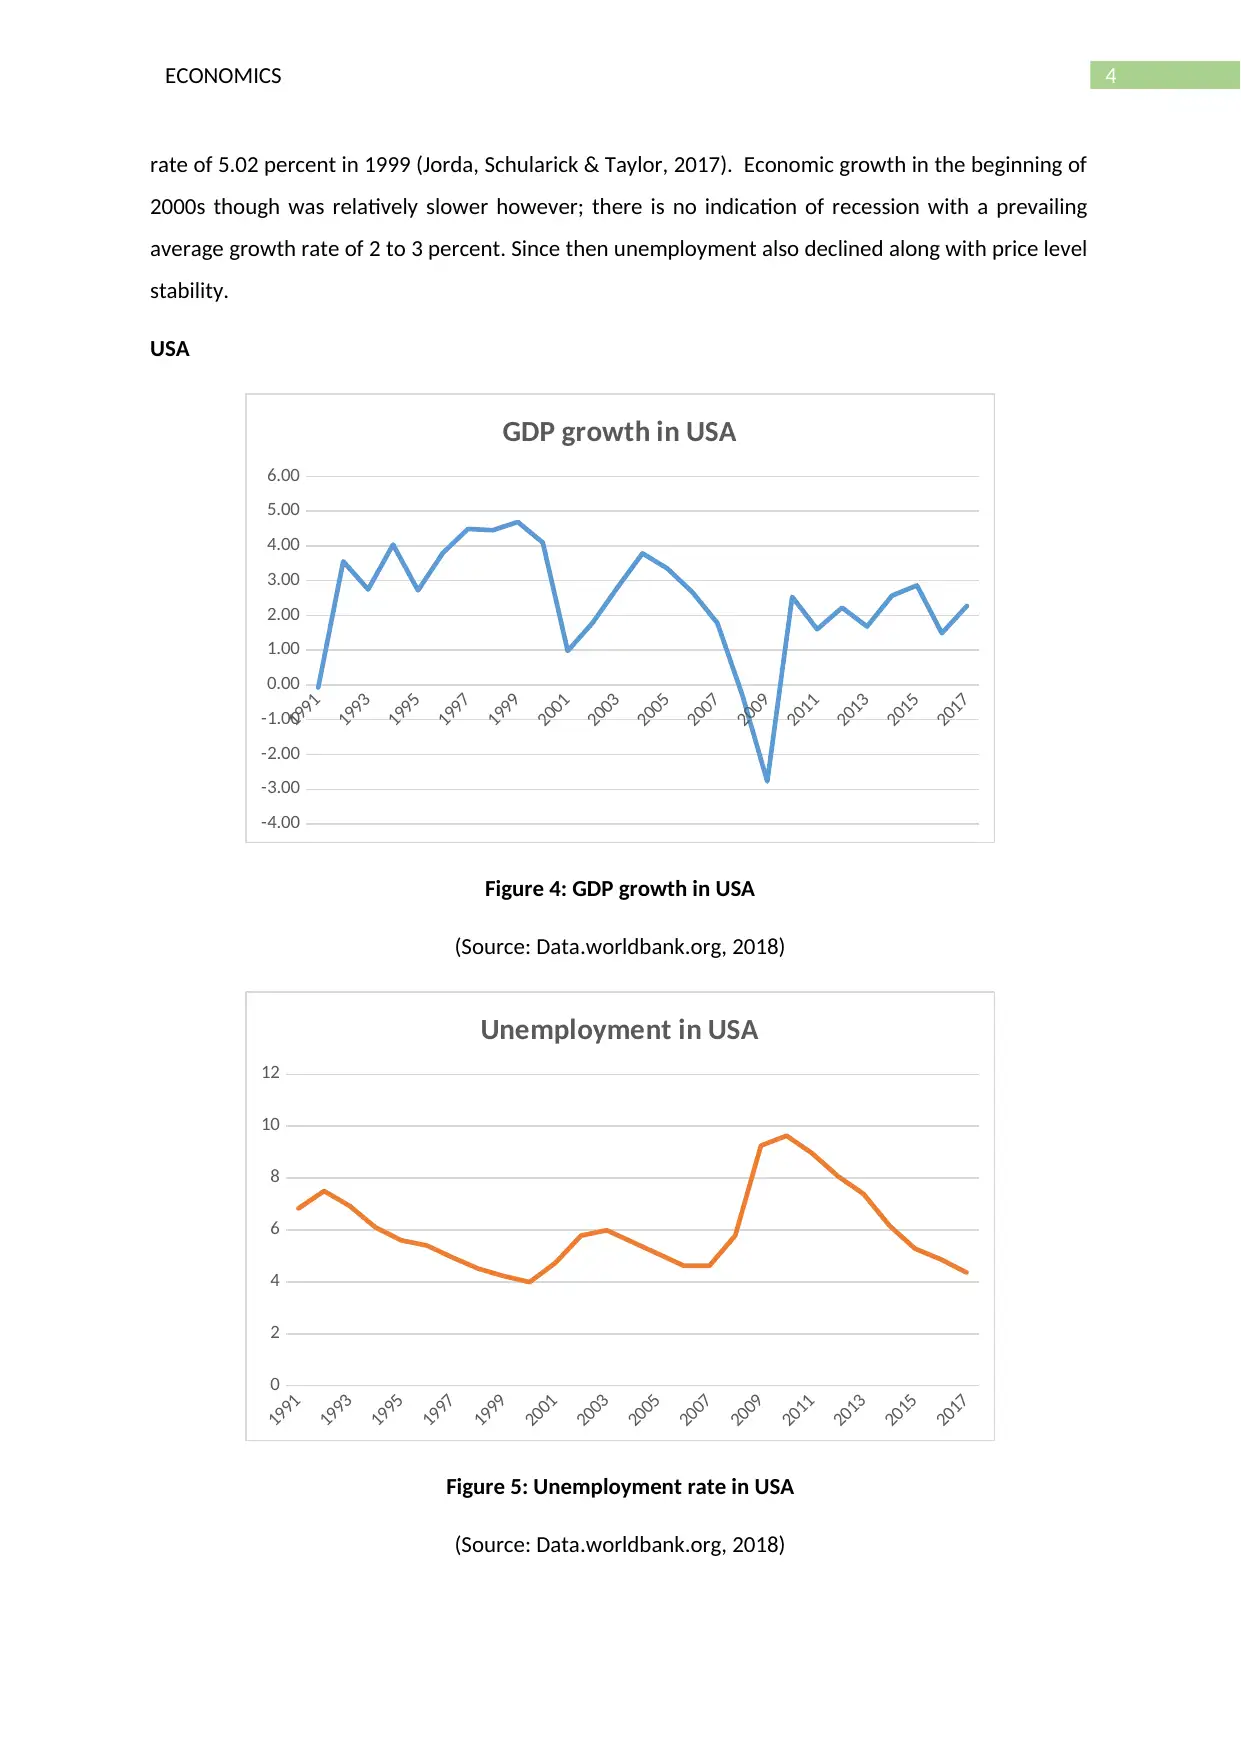
rate of 5.02 percent in 1999 (Jorda, Schularick & Taylor, 2017). Economic growth in the beginning of
2000s though was relatively slower however; there is no indication of recession with a prevailing
average growth rate of 2 to 3 percent. Since then unemployment also declined along with price level
stability.
USA
1991
1993
1995
1997
1999
2001
2003
2005
2007
2009
2011
2013
2015
2017
-4.00
-3.00
-2.00
-1.00
0.00
1.00
2.00
3.00
4.00
5.00
6.00
GDP growth in USA
Figure 4: GDP growth in USA
(Source: Data.worldbank.org, 2018)
1991
1993
1995
1997
1999
2001
2003
2005
2007
2009
2011
2013
2015
2017
0
2
4
6
8
10
12
Unemployment in USA
Figure 5: Unemployment rate in USA
(Source: Data.worldbank.org, 2018)
5ECONOMICS
1991
1993
1995
1997
1999
2001
2003
2005
2007
2009
2011
2013
2015
2017
-1.00
0.00
1.00
2.00
3.00
4.00
5.00
Inflation rate in USA
Figure 6: Inflation rate in USA
(Source: Data.worldbank.org, 2018)
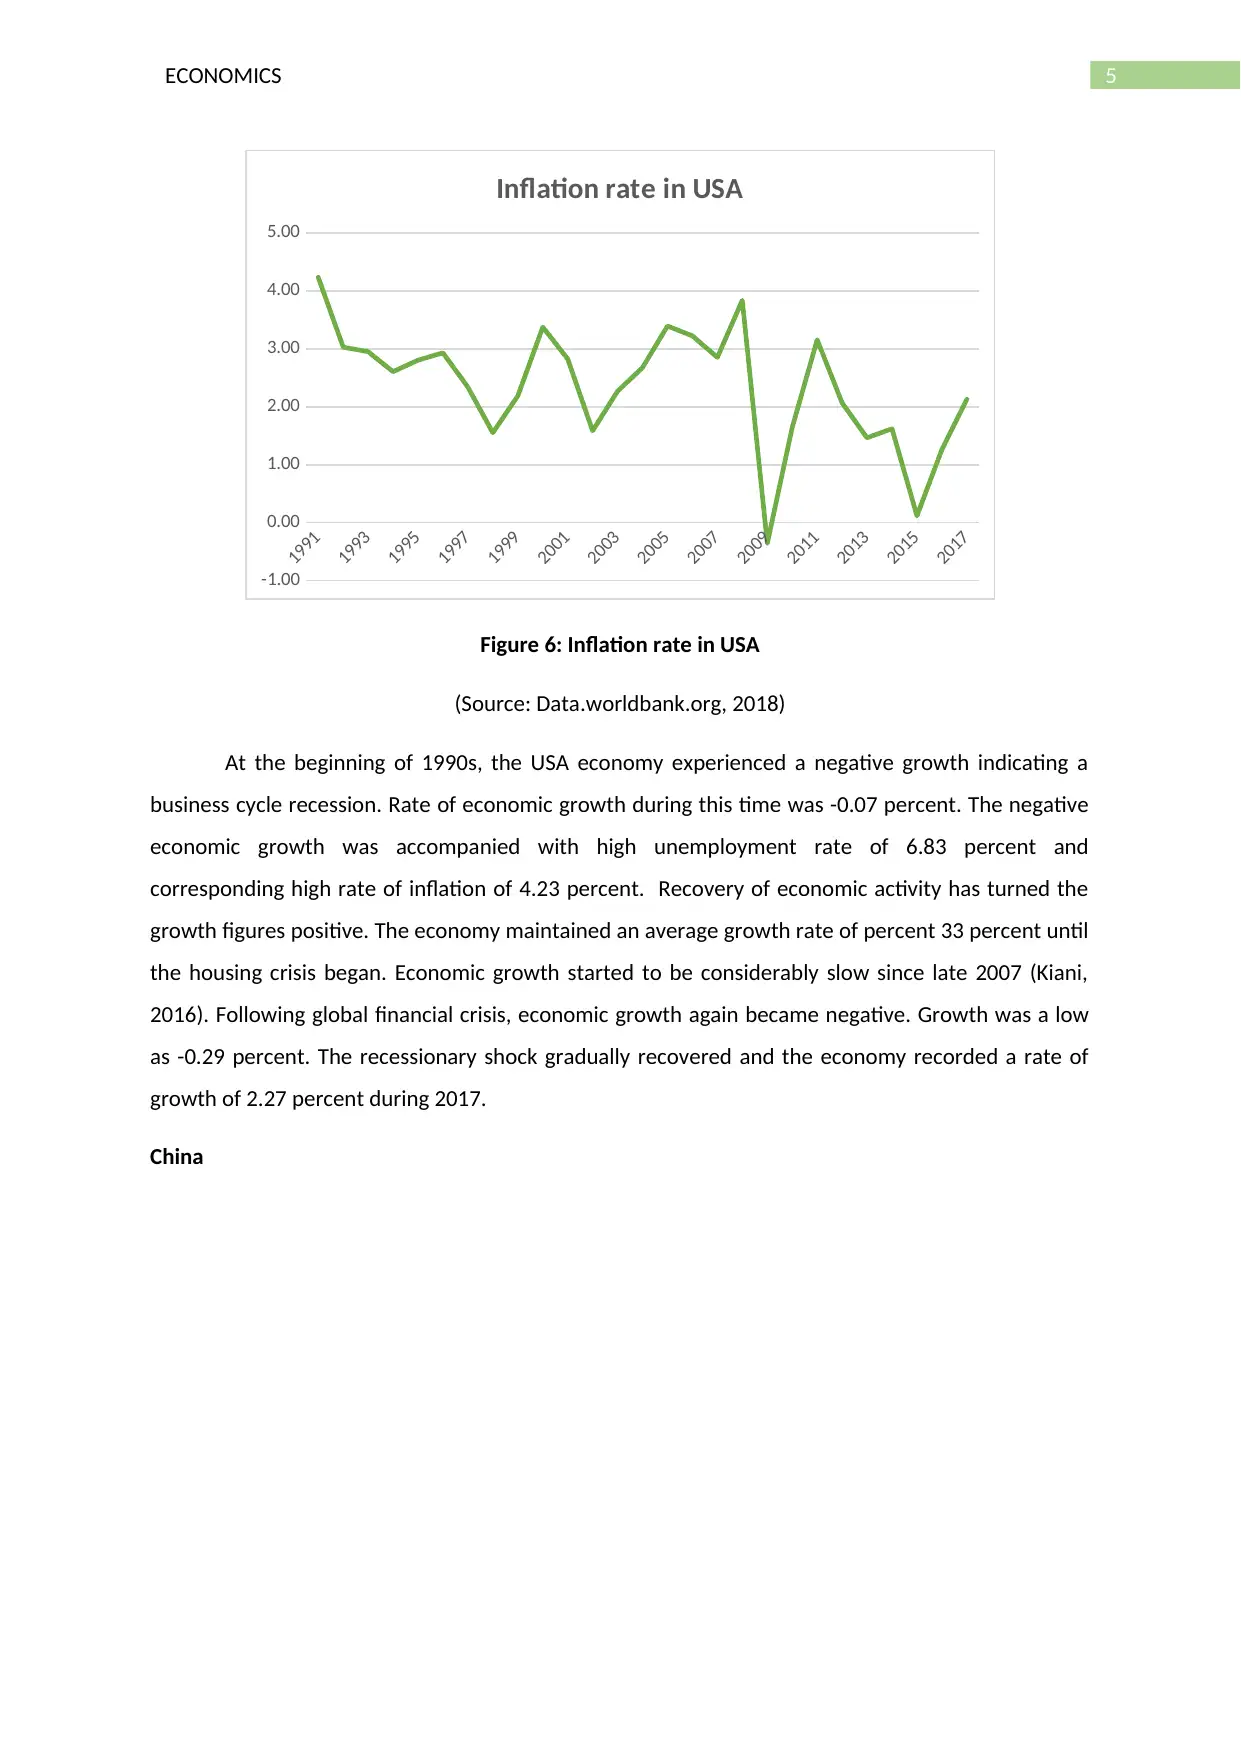
At the beginning of 1990s, the USA economy experienced a negative growth indicating a
business cycle recession. Rate of economic growth during this time was -0.07 percent. The negative
economic growth was accompanied with high unemployment rate of 6.83 percent and
corresponding high rate of inflation of 4.23 percent. Recovery of economic activity has turned the
growth figures positive. The economy maintained an average growth rate of percent 33 percent until
the housing crisis began. Economic growth started to be considerably slow since late 2007 (Kiani,
2016). Following global financial crisis, economic growth again became negative. Growth was a low
as -0.29 percent. The recessionary shock gradually recovered and the economy recorded a rate of
growth of 2.27 percent during 2017.
China
1991
1993
1995
1997
1999
2001
2003
2005
2007
2009
2011
2013
2015
2017
-1.00
0.00
1.00
2.00
3.00
4.00
5.00
Inflation rate in USA
Figure 6: Inflation rate in USA
(Source: Data.worldbank.org, 2018)
At the beginning of 1990s, the USA economy experienced a negative growth indicating a
business cycle recession. Rate of economic growth during this time was -0.07 percent. The negative
economic growth was accompanied with high unemployment rate of 6.83 percent and
corresponding high rate of inflation of 4.23 percent. Recovery of economic activity has turned the
growth figures positive. The economy maintained an average growth rate of percent 33 percent until
the housing crisis began. Economic growth started to be considerably slow since late 2007 (Kiani,
2016). Following global financial crisis, economic growth again became negative. Growth was a low
as -0.29 percent. The recessionary shock gradually recovered and the economy recorded a rate of
growth of 2.27 percent during 2017.
China
⊘ This is a preview!⊘
Do you want full access?
Subscribe today to unlock all pages.
Trusted by 1+ million students worldwide
6ECONOMICS
1991
1993
1995
1997
1999
2001
2003
2005
2007
2009
2011
2013
2015
2017
0.00
2.00
4.00
6.00
8.00
10.00
12.00
14.00
16.00
GDP growth in China
Figure 7: GDP growth in China
(Source: Data.worldbank.org, 2018)
1991
1993
1995
1997
1999
2001
2003
2005
2007
2009
2011
2013
2015
2017
0
1
2
3
4
5
6
Unemployment in China
Figure 8: Unemployment rate in China
(Source: Data.worldbank.org, 2018)
1991
1993
1995
1997
1999
2001
2003
2005
2007
2009
2011
2013
2015
2017
0.00
2.00
4.00
6.00
8.00
10.00
12.00
14.00
16.00
GDP growth in China
Figure 7: GDP growth in China
(Source: Data.worldbank.org, 2018)
1991
1993
1995
1997
1999
2001
2003
2005
2007
2009
2011
2013
2015
2017
0
1
2
3
4
5
6
Unemployment in China
Figure 8: Unemployment rate in China
(Source: Data.worldbank.org, 2018)
Paraphrase This Document
Need a fresh take? Get an instant paraphrase of this document with our AI Paraphraser
7ECONOMICS
1991
1993
1995
1997
1999
2001
2003
2005
2007
2009
2011
2013
2015
2017
-5.00
0.00
5.00
10.00
15.00
20.00
25.00
30.00
Inflation rate in China
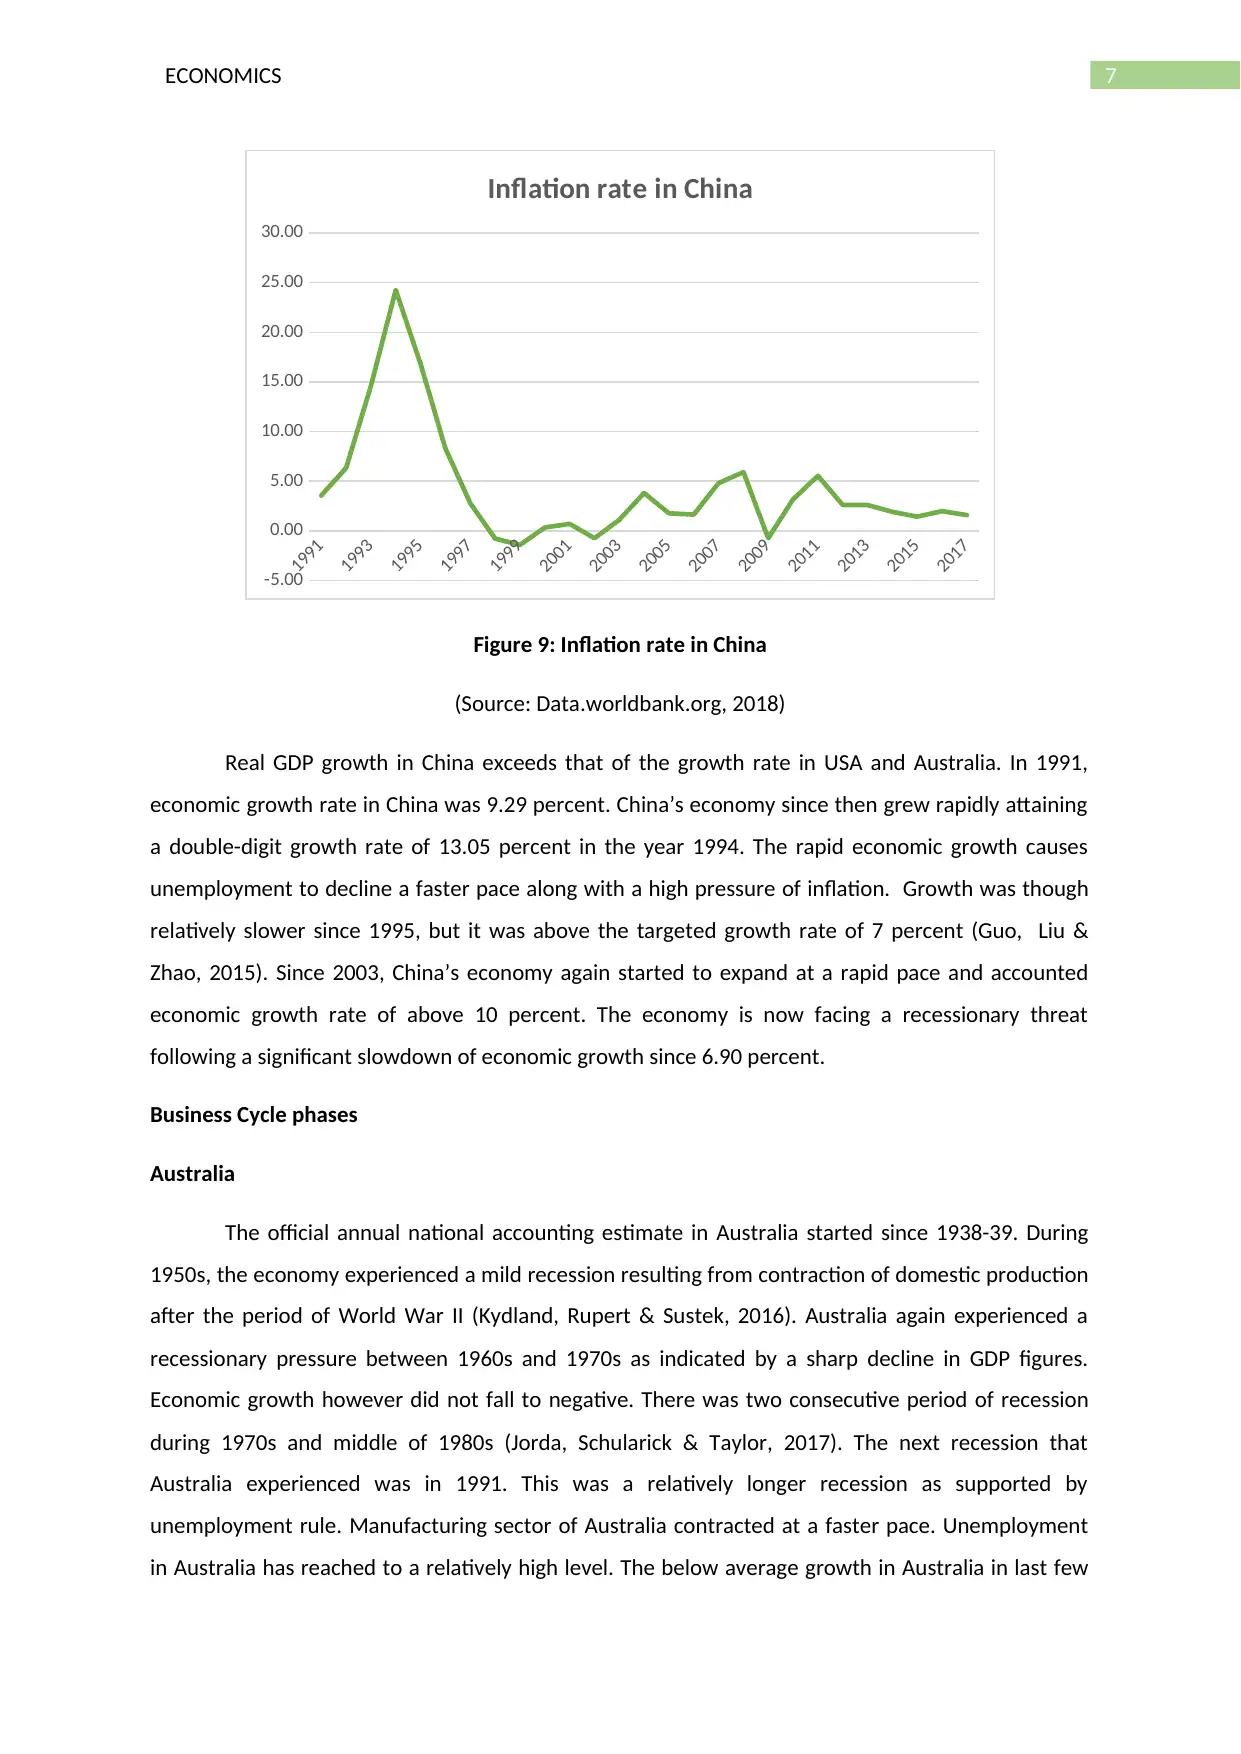
Figure 9: Inflation rate in China
(Source: Data.worldbank.org, 2018)
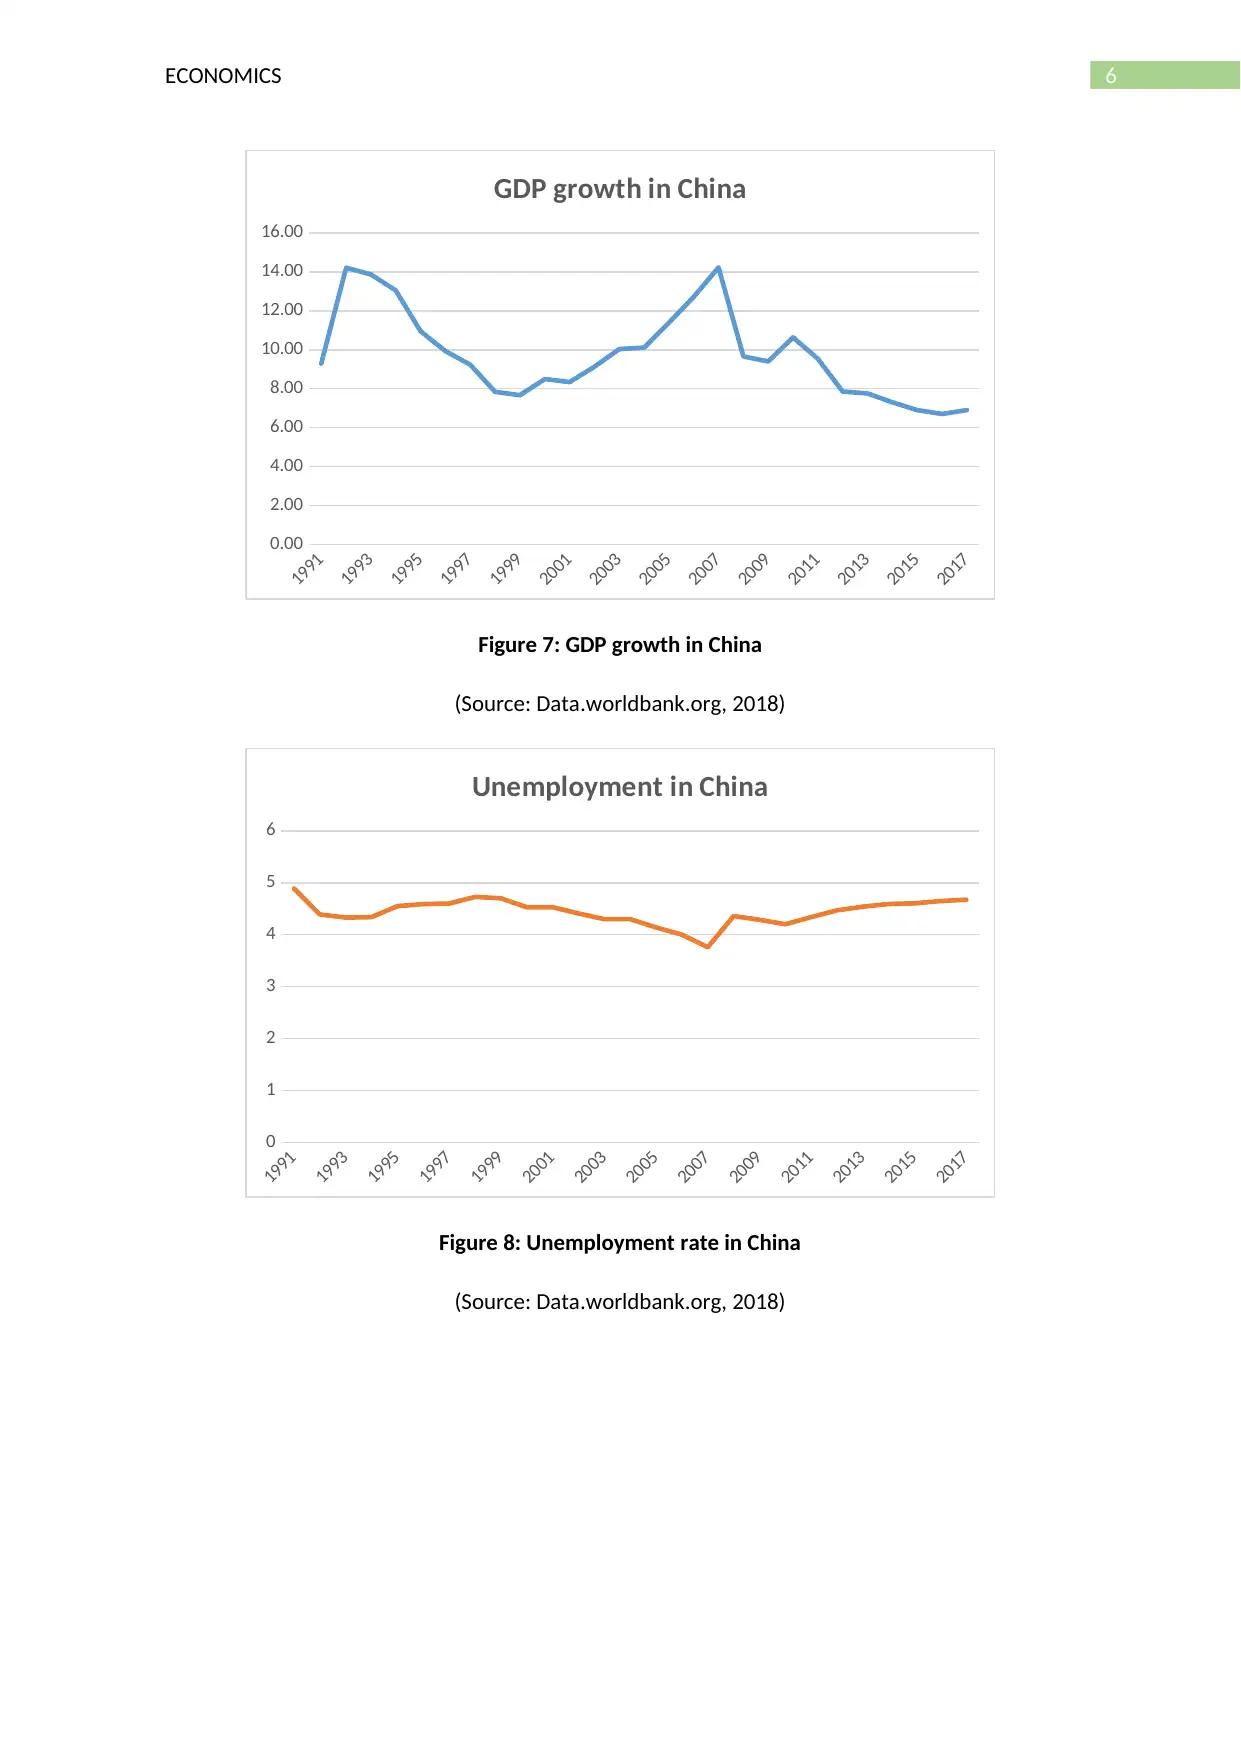
Real GDP growth in China exceeds that of the growth rate in USA and Australia. In 1991,
economic growth rate in China was 9.29 percent. China’s economy since then grew rapidly attaining
a double-digit growth rate of 13.05 percent in the year 1994. The rapid economic growth causes
unemployment to decline a faster pace along with a high pressure of inflation. Growth was though
relatively slower since 1995, but it was above the targeted growth rate of 7 percent (Guo, Liu &
Zhao, 2015). Since 2003, China’s economy again started to expand at a rapid pace and accounted
economic growth rate of above 10 percent. The economy is now facing a recessionary threat
following a significant slowdown of economic growth since 6.90 percent.
Business Cycle phases
Australia
The official annual national accounting estimate in Australia started since 1938-39. During
1950s, the economy experienced a mild recession resulting from contraction of domestic production
after the period of World War II (Kydland, Rupert & Sustek, 2016). Australia again experienced a
recessionary pressure between 1960s and 1970s as indicated by a sharp decline in GDP figures.
Economic growth however did not fall to negative. There was two consecutive period of recession
during 1970s and middle of 1980s (Jorda, Schularick & Taylor, 2017). The next recession that
Australia experienced was in 1991. This was a relatively longer recession as supported by
unemployment rule. Manufacturing sector of Australia contracted at a faster pace. Unemployment
in Australia has reached to a relatively high level. The below average growth in Australia in last few
1991
1993
1995
1997
1999
2001
2003
2005
2007
2009
2011
2013
2015
2017
-5.00
0.00
5.00
10.00
15.00
20.00
25.00
30.00
Inflation rate in China
Figure 9: Inflation rate in China
(Source: Data.worldbank.org, 2018)
Real GDP growth in China exceeds that of the growth rate in USA and Australia. In 1991,
economic growth rate in China was 9.29 percent. China’s economy since then grew rapidly attaining
a double-digit growth rate of 13.05 percent in the year 1994. The rapid economic growth causes
unemployment to decline a faster pace along with a high pressure of inflation. Growth was though
relatively slower since 1995, but it was above the targeted growth rate of 7 percent (Guo, Liu &
Zhao, 2015). Since 2003, China’s economy again started to expand at a rapid pace and accounted
economic growth rate of above 10 percent. The economy is now facing a recessionary threat
following a significant slowdown of economic growth since 6.90 percent.
Business Cycle phases
Australia
The official annual national accounting estimate in Australia started since 1938-39. During
1950s, the economy experienced a mild recession resulting from contraction of domestic production
after the period of World War II (Kydland, Rupert & Sustek, 2016). Australia again experienced a
recessionary pressure between 1960s and 1970s as indicated by a sharp decline in GDP figures.
Economic growth however did not fall to negative. There was two consecutive period of recession
during 1970s and middle of 1980s (Jorda, Schularick & Taylor, 2017). The next recession that
Australia experienced was in 1991. This was a relatively longer recession as supported by
unemployment rule. Manufacturing sector of Australia contracted at a faster pace. Unemployment
in Australia has reached to a relatively high level. The below average growth in Australia in last few
8ECONOMICS
years indicate a recessionary pressure in the economy (Fenna, 2013). Investment growth from
sectors other than mining and expansion of business contribute to economic recovery.
USA
Economic expansion in USA lasted for a comparatively longer period than contractions since
the world war II. The most recent business cycle in USA lasted from 1945 to 2009 (Kiani, 2016). In
the entire phase of business cycle economic expansion was lasted for the period 58 months. As
compared to this, number of recession months were approximately 11. Last recession in USA began
since the latter half of 2007 (Ma & Zhang, 2016). This recession, also known as global financial crisis
continued for two years. The recession ended in 2009. Recession in the USA economy was the
combined result of overconfidence of household and businesses and collapse of financial market
(Johnson, 2014). USA economy is experiencing a phase of expansion since 2009.
China
The average growth rate in China between 1998 and 2009 was 10.1 percent. The double
digit growth rate of China indicates long period of economic expansion in China since 1997 (Guo, Liu
& Zhao, 2015). In 2007, growth rate reached to the peak level of 14.2 percent. Large trade surplus
fuels economic growth of China. China maintained a smooth balance between import and export.
Weak demand in the domestic economy created a recessionary pressure during 2008 (Ding,
Guariglia & Knight, 2013). In order to boost economic growth during this time monetary stimulus
was given to the economy in terms of decline in interest rate. In recent years, economic growth on
China though has slowed down but the economy yet not entered a recession (Gong & Kim, 2013).
Growing uncertainty worldwide and export expansion from other developing countries possesses
continuous threat to the economy.
Aggregate demand and aggregate supply model
⊘ This is a preview!⊘
Do you want full access?
Subscribe today to unlock all pages.
Trusted by 1+ million students worldwide
9ECONOMICS
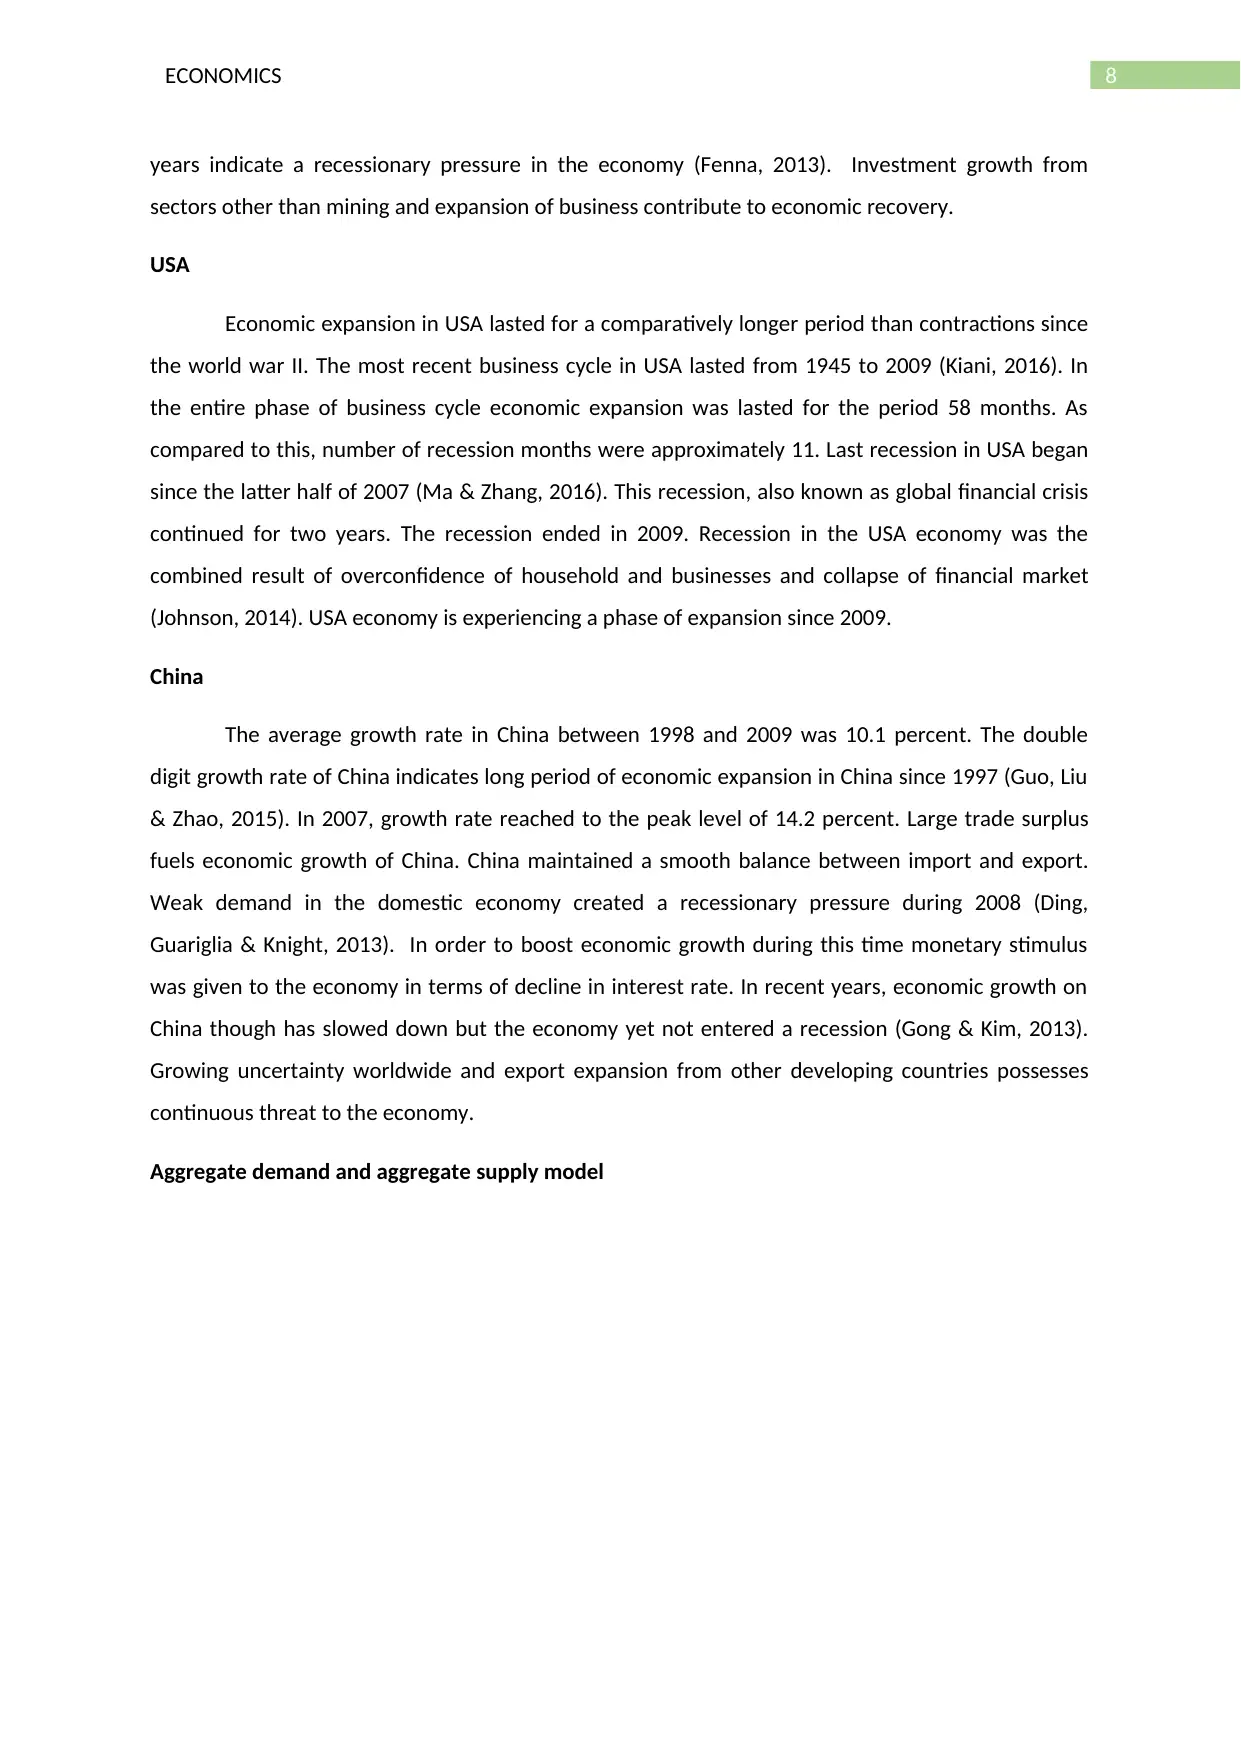
Figure 1: AD-AS for Australia’s economy
(Source: as created by Author)
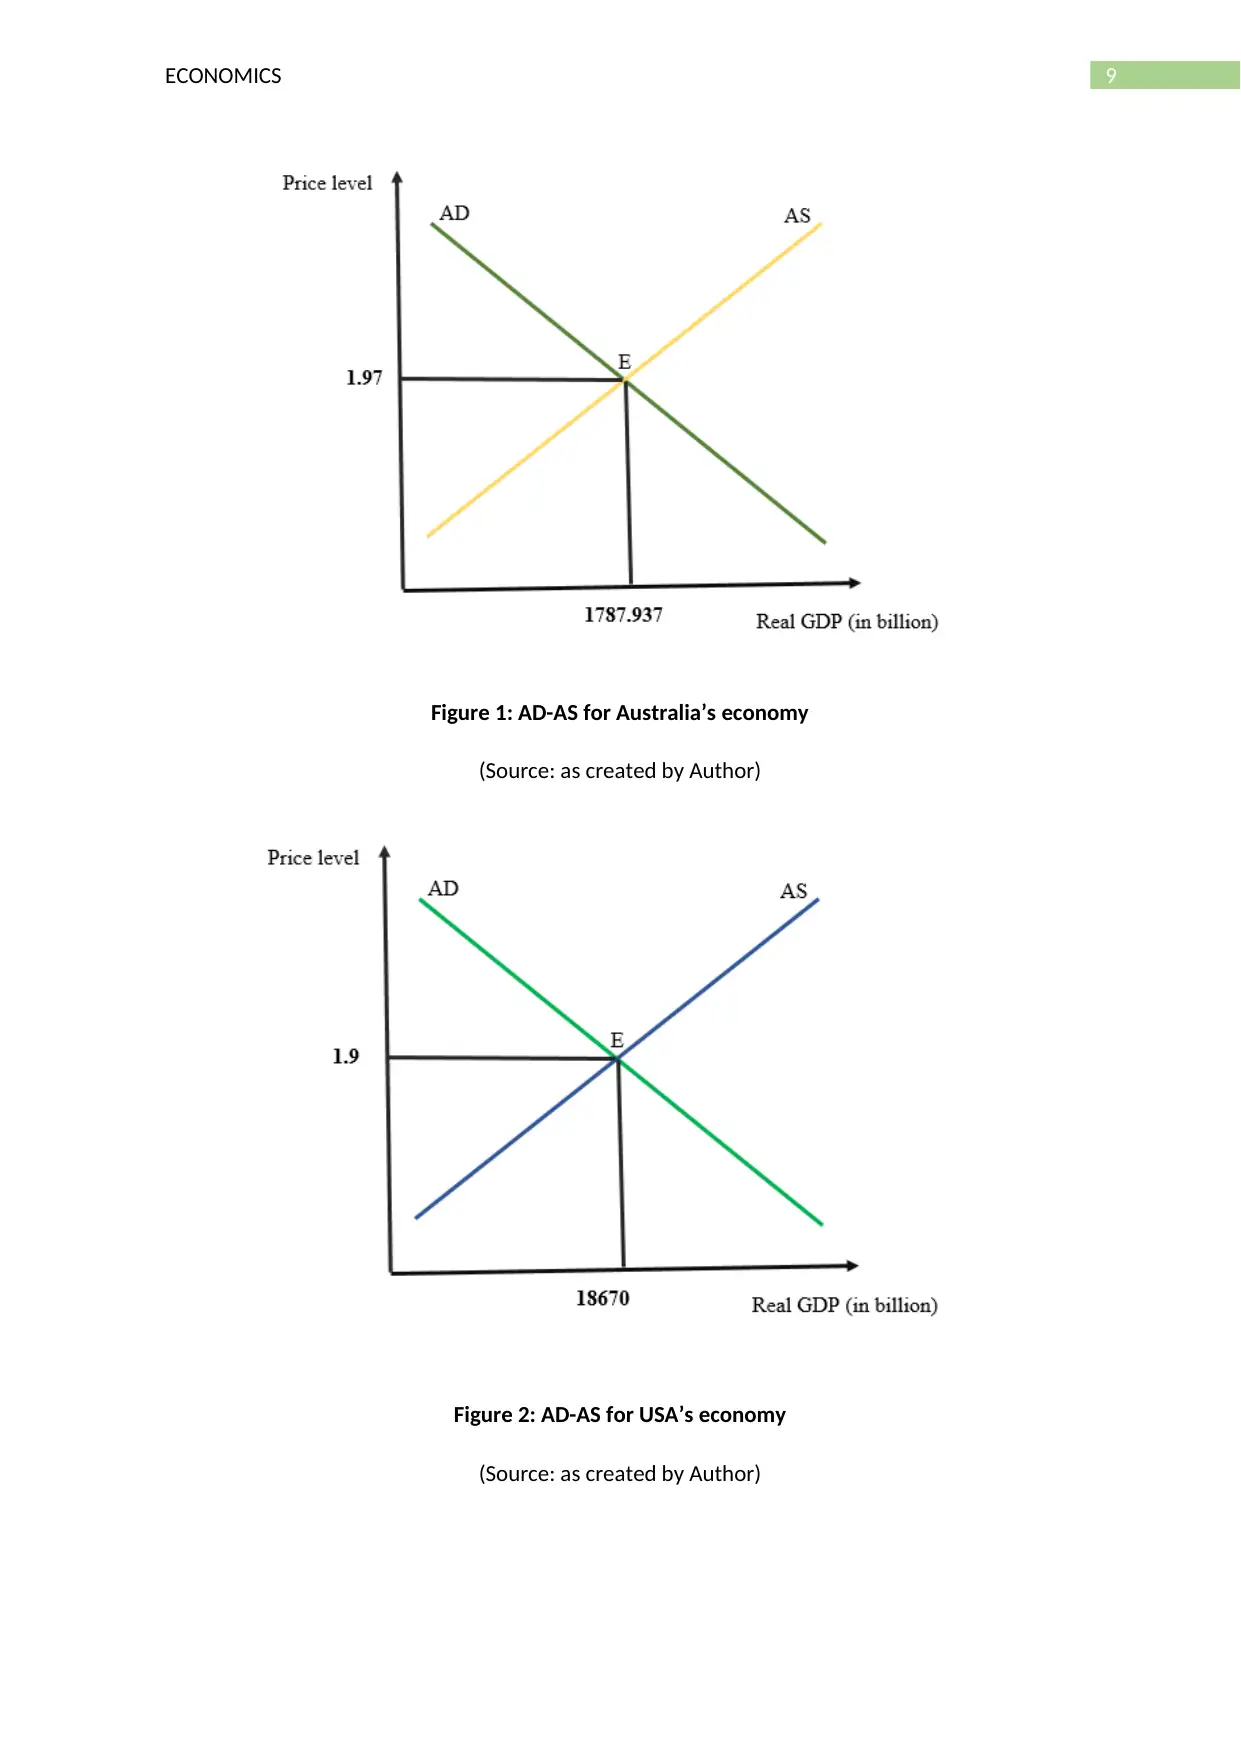
Figure 2: AD-AS for USA’s economy
(Source: as created by Author)
Figure 1: AD-AS for Australia’s economy
(Source: as created by Author)
Figure 2: AD-AS for USA’s economy
(Source: as created by Author)
Paraphrase This Document
Need a fresh take? Get an instant paraphrase of this document with our AI Paraphraser
10ECONOMICS
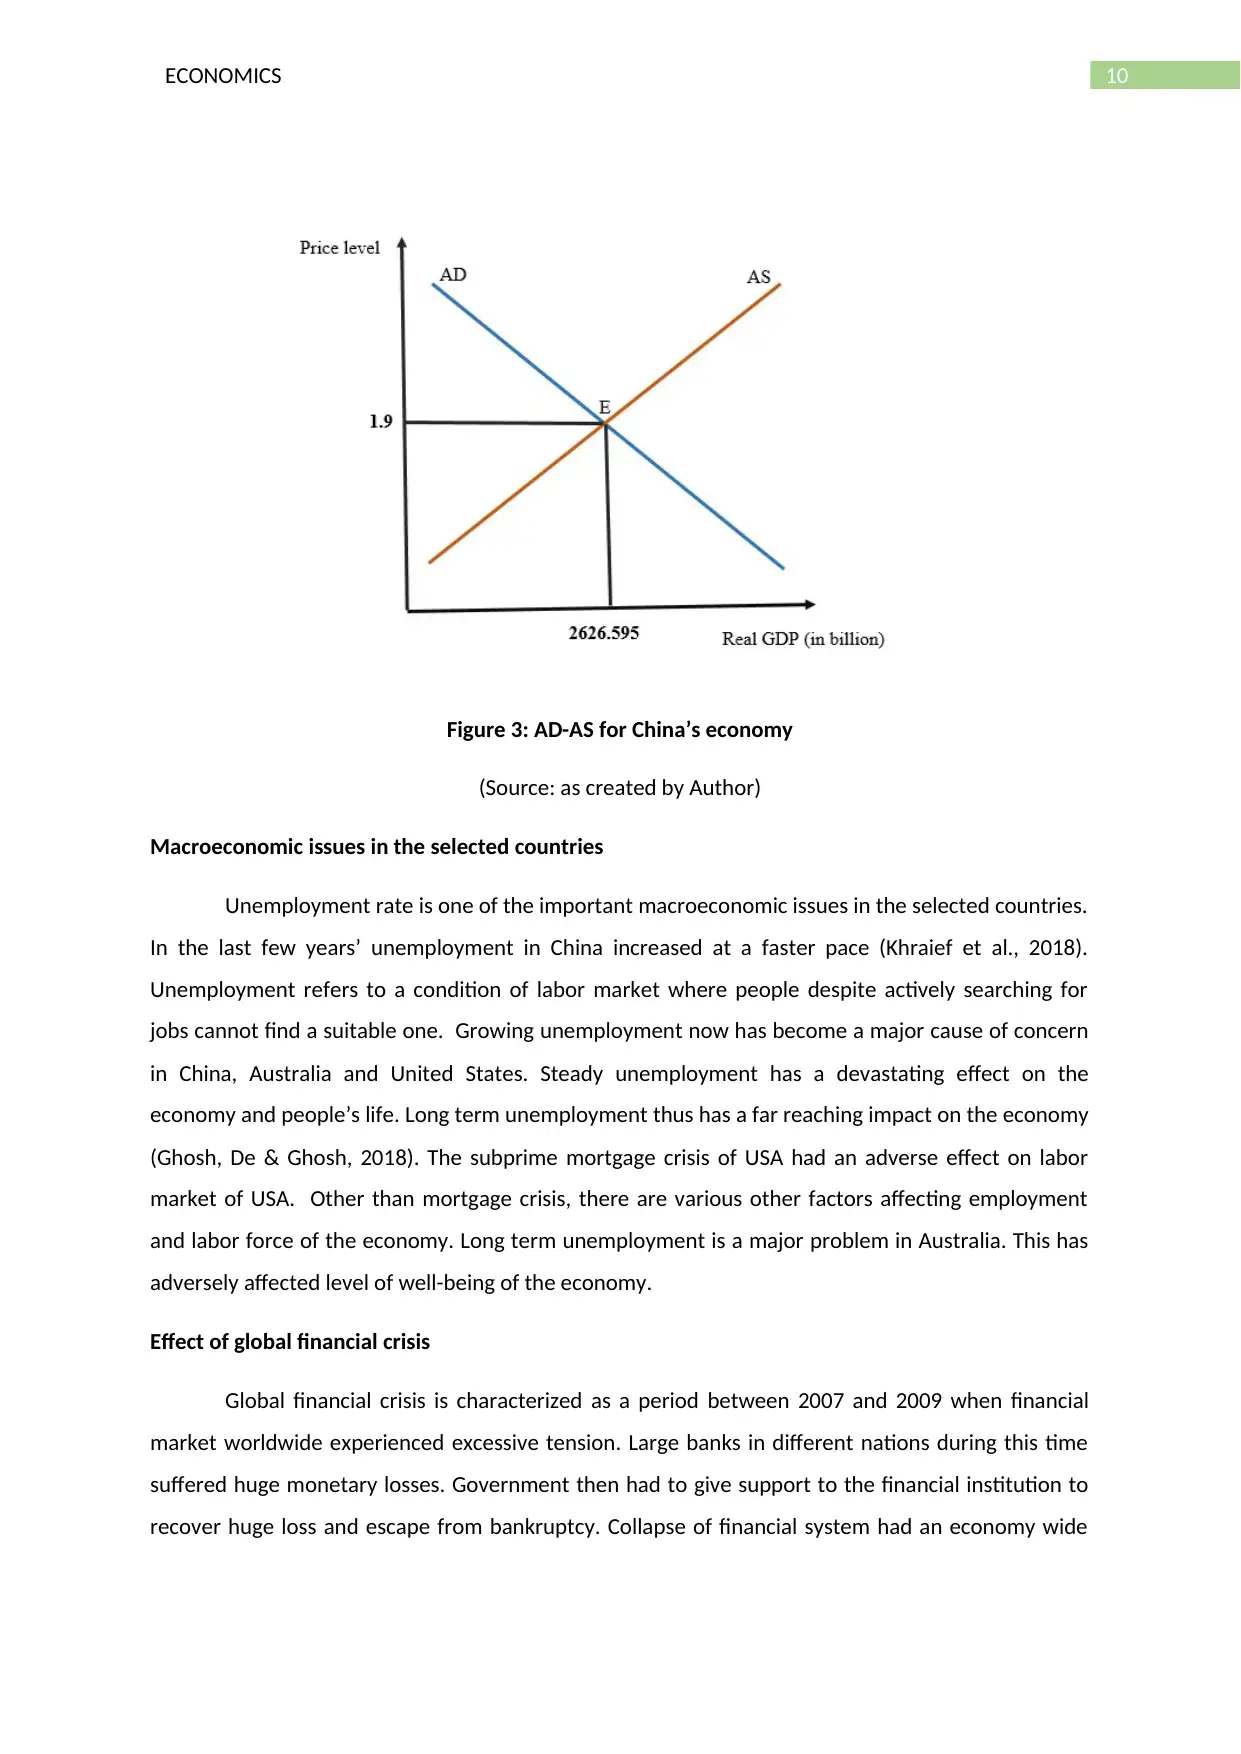
Figure 3: AD-AS for China’s economy
(Source: as created by Author)
Macroeconomic issues in the selected countries
Unemployment rate is one of the important macroeconomic issues in the selected countries.
In the last few years’ unemployment in China increased at a faster pace (Khraief et al., 2018).
Unemployment refers to a condition of labor market where people despite actively searching for
jobs cannot find a suitable one. Growing unemployment now has become a major cause of concern
in China, Australia and United States. Steady unemployment has a devastating effect on the
economy and people’s life. Long term unemployment thus has a far reaching impact on the economy
(Ghosh, De & Ghosh, 2018). The subprime mortgage crisis of USA had an adverse effect on labor
market of USA. Other than mortgage crisis, there are various other factors affecting employment
and labor force of the economy. Long term unemployment is a major problem in Australia. This has
adversely affected level of well-being of the economy.
Effect of global financial crisis
Global financial crisis is characterized as a period between 2007 and 2009 when financial
market worldwide experienced excessive tension. Large banks in different nations during this time
suffered huge monetary losses. Government then had to give support to the financial institution to
recover huge loss and escape from bankruptcy. Collapse of financial system had an economy wide
11ECONOMICS
impact in terms of contraction of economic activity and experienced huge recession. The impact of
global financial crisis on Australia, China and USA are summarized below.
Australia
Australia though have a relatively steady banking and financial system, the financial
disruption in 2007 still had a considerable effect on the economy. Banks in Australia have been
affected largely. The impact of financial crisis on Australia is relatively less severe compare to other
nations worldwide. With intensification of deep rooted crisis, Australian dollar lost its value and
started to depreciate. There was an above thirty percent decline in the value of Australian dollar.
The financial crisis largely impacted manufacturing sector of Australia (Bissoondoyal-Bheenick et al.,
2018). The automotive sector of Australia faced huge contraction as a result of the crisis. There were
huge job losses in the regional areas. Crisis in the global financial market negatively affected volume
of trade. In 2009, trade volume in Australia contracted by 11.6 percent. This was the first decline in
export volume of Australia since 1965 indicating vulnerability of Australia to the global economic
events.
China
China successfully escaped from most of severe impact of global financial crisis. The
economy experienced only a slight slow-down during this time. The main reason for which China
remained relatively less affected from the global financial crisis is that the financial system of China is
relatively closed. China however had not completely escape from global financial crisis because of its
dependency on global market for export. As global financial crisis affected many of its trade partners
badly, there was a large decline in international demand of China’s domestic product. Interruption in
export volume hurt China’s economy badly. The financial crisis significantly lowered stock return in
the financial market. Foreign direct investment in China had declined largely. In 2008, net foreign
investment lowered to $121 billion in China (Hussain & Li, 2018). With stock market crash, many of
the invested assets had lost its value. China’s government intervened actively to minimize the impact
of global financial crisis and helped in quick recovery of the economy.
USA
USA faced the most severe consequences of Global Financial Crisis. The crisis originally
rooted in United State created an economy wide recession in USA. The recession that began since
December 2007 is known to be officially ended in the middle of 2009. The economy however took a
relatively longer time to back to its previous employment and output. Following financial crisis, the
economy lost approximately 8.7 million jobs in just two years span between 2008 and 2010.
⊘ This is a preview!⊘
Do you want full access?
Subscribe today to unlock all pages.
Trusted by 1+ million students worldwide
1 out of 15
Related Documents


Your All-in-One AI-Powered Toolkit for Academic Success.
+13062052269
info@desklib.com
Available 24*7 on WhatsApp / Email
![[object Object]](/_next/static/media/star-bottom.7253800d.svg)
Unlock your academic potential
Copyright © 2020–2026 A2Z Services. All Rights Reserved. Developed and managed by ZUCOL.