Economics for Business: Employment, Aggregate Supply and Demand Report
VerifiedAdded on 2023/03/23
|11
|2572
|60
Report
AI Summary
This report analyzes the Australian economy using data from the Australian Bureau of Statistics (ABS) to examine the four expenditure components of Gross Domestic Product: consumption, investment, government spending, and net exports from 1987/8 to 2017/18. It includes real per capita measures, time series plots, and economic explanations of observed trends. The report also delves into the concepts of nominal and real wages, exploring the impact of low wage growth on aggregate demand and supply. It discusses the effects of low wage growth on various industries, such as mining, and suggests government interventions like raising the minimum wage and protecting workers' rights to mitigate the negative consequences. The analysis highlights the interplay between economic indicators and the need for government policies to ensure economic stability and growth.
1
Running head: ECONOMICS FOR BUSINESS
Employment, Aggregate Supply and Demand
Name
Institution
Running head: ECONOMICS FOR BUSINESS
Employment, Aggregate Supply and Demand
Name
Institution
Paraphrase This Document
Need a fresh take? Get an instant paraphrase of this document with our AI Paraphraser
2
EMPLOYMENT, AGGREGATE SUPPLY AND DEMAND
Employment, Aggregate Supply and Demand
Question 1
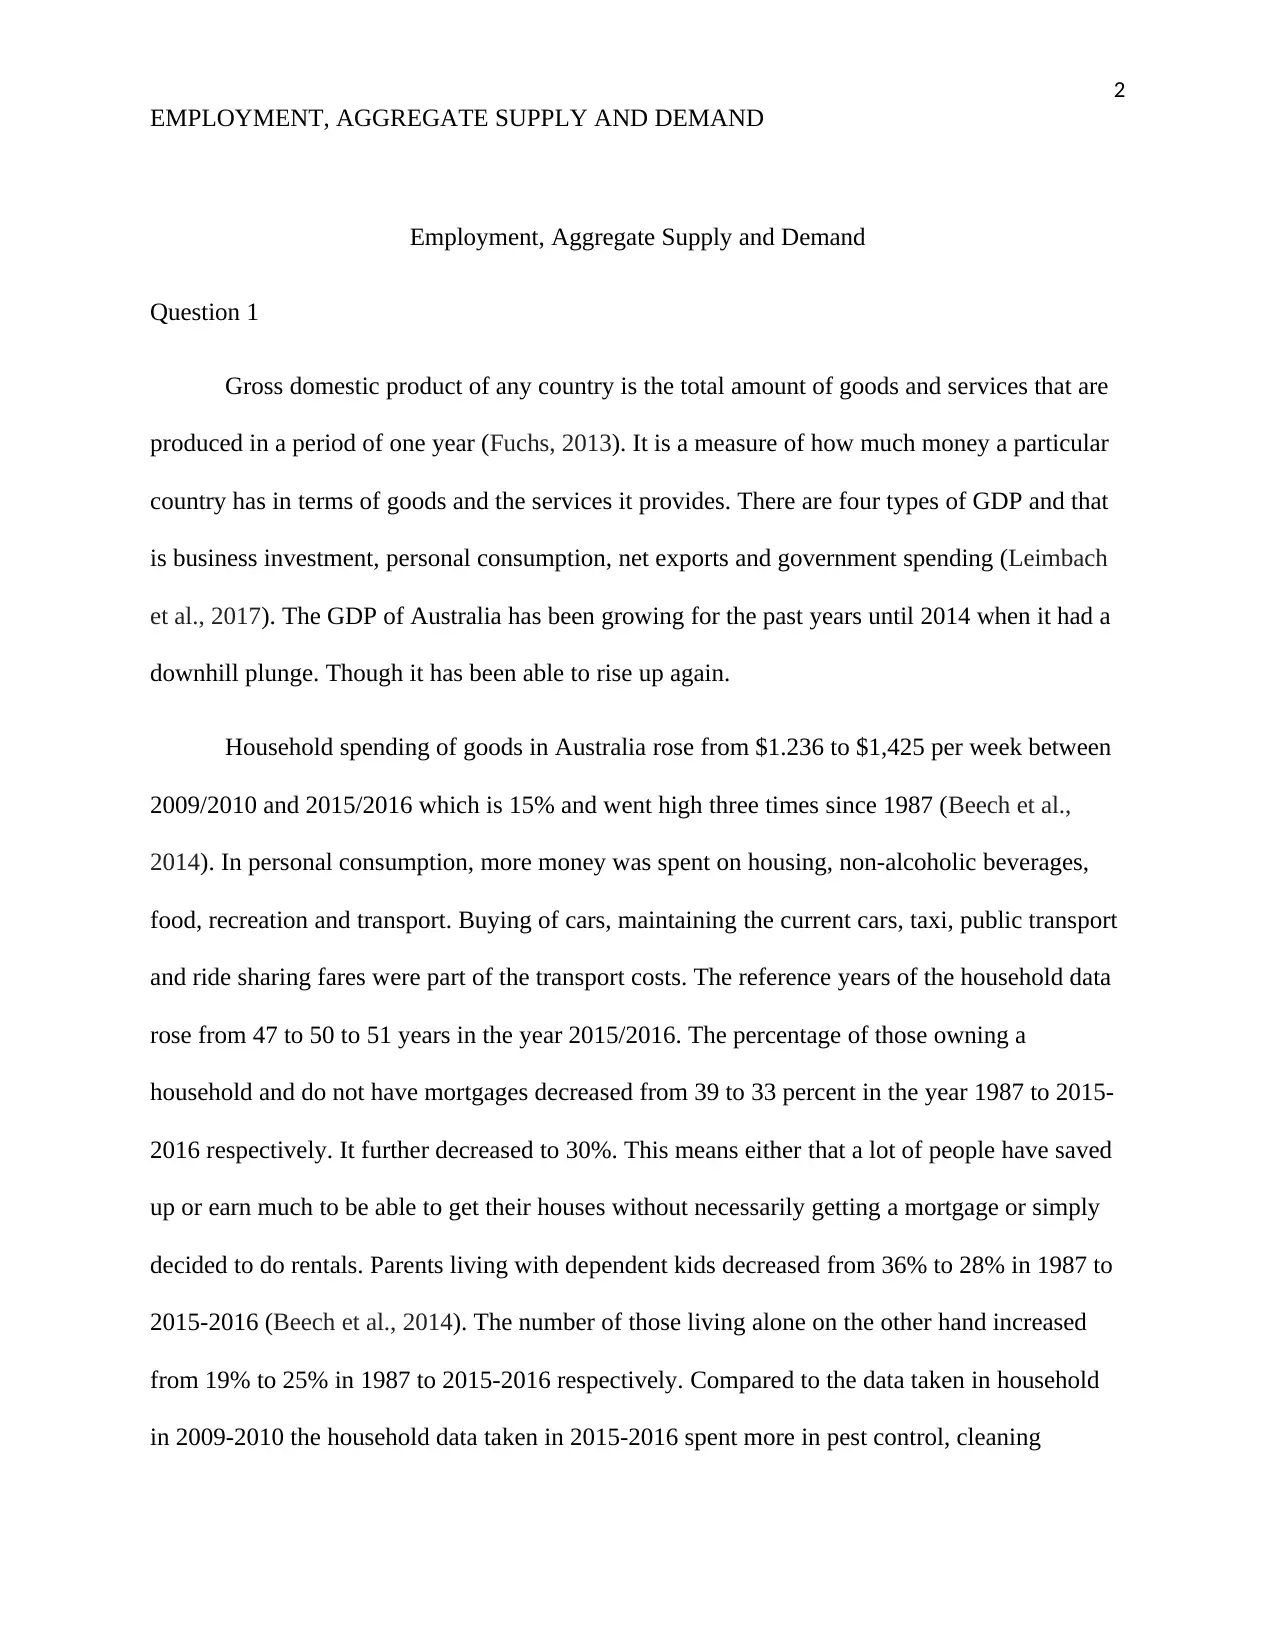
Gross domestic product of any country is the total amount of goods and services that are
produced in a period of one year (Fuchs, 2013). It is a measure of how much money a particular
country has in terms of goods and the services it provides. There are four types of GDP and that
is business investment, personal consumption, net exports and government spending (Leimbach
et al., 2017). The GDP of Australia has been growing for the past years until 2014 when it had a
downhill plunge. Though it has been able to rise up again.
Household spending of goods in Australia rose from $1.236 to $1,425 per week between
2009/2010 and 2015/2016 which is 15% and went high three times since 1987 (Beech et al.,
2014). In personal consumption, more money was spent on housing, non-alcoholic beverages,
food, recreation and transport. Buying of cars, maintaining the current cars, taxi, public transport
and ride sharing fares were part of the transport costs. The reference years of the household data
rose from 47 to 50 to 51 years in the year 2015/2016. The percentage of those owning a
household and do not have mortgages decreased from 39 to 33 percent in the year 1987 to 2015-
2016 respectively. It further decreased to 30%. This means either that a lot of people have saved
up or earn much to be able to get their houses without necessarily getting a mortgage or simply
decided to do rentals. Parents living with dependent kids decreased from 36% to 28% in 1987 to
2015-2016 (Beech et al., 2014). The number of those living alone on the other hand increased
from 19% to 25% in 1987 to 2015-2016 respectively. Compared to the data taken in household
in 2009-2010 the household data taken in 2015-2016 spent more in pest control, cleaning
EMPLOYMENT, AGGREGATE SUPPLY AND DEMAND
Employment, Aggregate Supply and Demand
Question 1
Gross domestic product of any country is the total amount of goods and services that are
produced in a period of one year (Fuchs, 2013). It is a measure of how much money a particular
country has in terms of goods and the services it provides. There are four types of GDP and that
is business investment, personal consumption, net exports and government spending (Leimbach
et al., 2017). The GDP of Australia has been growing for the past years until 2014 when it had a
downhill plunge. Though it has been able to rise up again.
Household spending of goods in Australia rose from $1.236 to $1,425 per week between
2009/2010 and 2015/2016 which is 15% and went high three times since 1987 (Beech et al.,
2014). In personal consumption, more money was spent on housing, non-alcoholic beverages,
food, recreation and transport. Buying of cars, maintaining the current cars, taxi, public transport
and ride sharing fares were part of the transport costs. The reference years of the household data
rose from 47 to 50 to 51 years in the year 2015/2016. The percentage of those owning a
household and do not have mortgages decreased from 39 to 33 percent in the year 1987 to 2015-
2016 respectively. It further decreased to 30%. This means either that a lot of people have saved
up or earn much to be able to get their houses without necessarily getting a mortgage or simply
decided to do rentals. Parents living with dependent kids decreased from 36% to 28% in 1987 to
2015-2016 (Beech et al., 2014). The number of those living alone on the other hand increased
from 19% to 25% in 1987 to 2015-2016 respectively. Compared to the data taken in household
in 2009-2010 the household data taken in 2015-2016 spent more in pest control, cleaning
3
EMPLOYMENT, AGGREGATE SUPPLY AND DEMAND
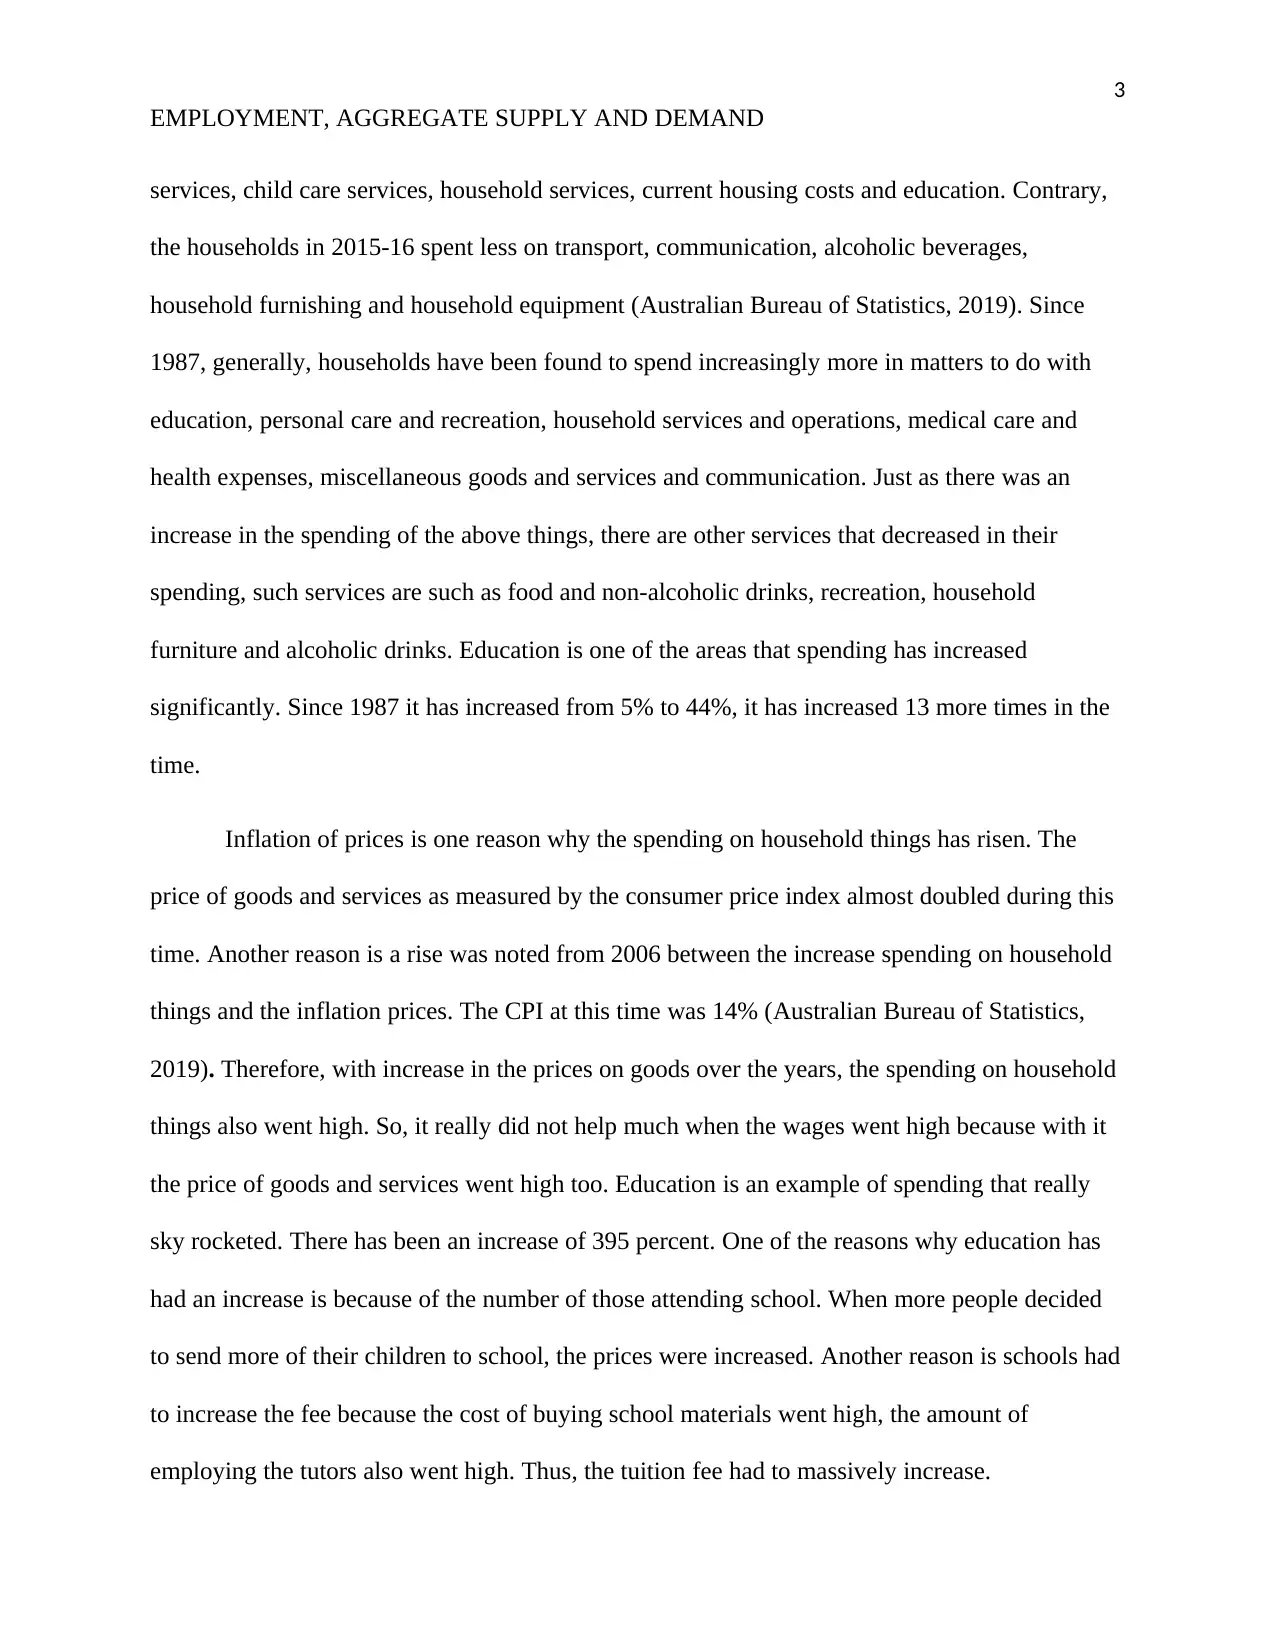
services, child care services, household services, current housing costs and education. Contrary,
the households in 2015-16 spent less on transport, communication, alcoholic beverages,
household furnishing and household equipment (Australian Bureau of Statistics, 2019). Since
1987, generally, households have been found to spend increasingly more in matters to do with
education, personal care and recreation, household services and operations, medical care and
health expenses, miscellaneous goods and services and communication. Just as there was an
increase in the spending of the above things, there are other services that decreased in their
spending, such services are such as food and non-alcoholic drinks, recreation, household
furniture and alcoholic drinks. Education is one of the areas that spending has increased
significantly. Since 1987 it has increased from 5% to 44%, it has increased 13 more times in the
time.
Inflation of prices is one reason why the spending on household things has risen. The
price of goods and services as measured by the consumer price index almost doubled during this
time. Another reason is a rise was noted from 2006 between the increase spending on household
things and the inflation prices. The CPI at this time was 14% (Australian Bureau of Statistics,
2019). Therefore, with increase in the prices on goods over the years, the spending on household
things also went high. So, it really did not help much when the wages went high because with it
the price of goods and services went high too. Education is an example of spending that really
sky rocketed. There has been an increase of 395 percent. One of the reasons why education has
had an increase is because of the number of those attending school. When more people decided
to send more of their children to school, the prices were increased. Another reason is schools had
to increase the fee because the cost of buying school materials went high, the amount of
employing the tutors also went high. Thus, the tuition fee had to massively increase.
EMPLOYMENT, AGGREGATE SUPPLY AND DEMAND
services, child care services, household services, current housing costs and education. Contrary,
the households in 2015-16 spent less on transport, communication, alcoholic beverages,
household furnishing and household equipment (Australian Bureau of Statistics, 2019). Since
1987, generally, households have been found to spend increasingly more in matters to do with
education, personal care and recreation, household services and operations, medical care and
health expenses, miscellaneous goods and services and communication. Just as there was an
increase in the spending of the above things, there are other services that decreased in their
spending, such services are such as food and non-alcoholic drinks, recreation, household
furniture and alcoholic drinks. Education is one of the areas that spending has increased
significantly. Since 1987 it has increased from 5% to 44%, it has increased 13 more times in the
time.
Inflation of prices is one reason why the spending on household things has risen. The
price of goods and services as measured by the consumer price index almost doubled during this
time. Another reason is a rise was noted from 2006 between the increase spending on household
things and the inflation prices. The CPI at this time was 14% (Australian Bureau of Statistics,
2019). Therefore, with increase in the prices on goods over the years, the spending on household
things also went high. So, it really did not help much when the wages went high because with it
the price of goods and services went high too. Education is an example of spending that really
sky rocketed. There has been an increase of 395 percent. One of the reasons why education has
had an increase is because of the number of those attending school. When more people decided
to send more of their children to school, the prices were increased. Another reason is schools had
to increase the fee because the cost of buying school materials went high, the amount of
employing the tutors also went high. Thus, the tuition fee had to massively increase.
⊘ This is a preview!⊘
Do you want full access?
Subscribe today to unlock all pages.
Trusted by 1+ million students worldwide
4
EMPLOYMENT, AGGREGATE SUPPLY AND DEMAND
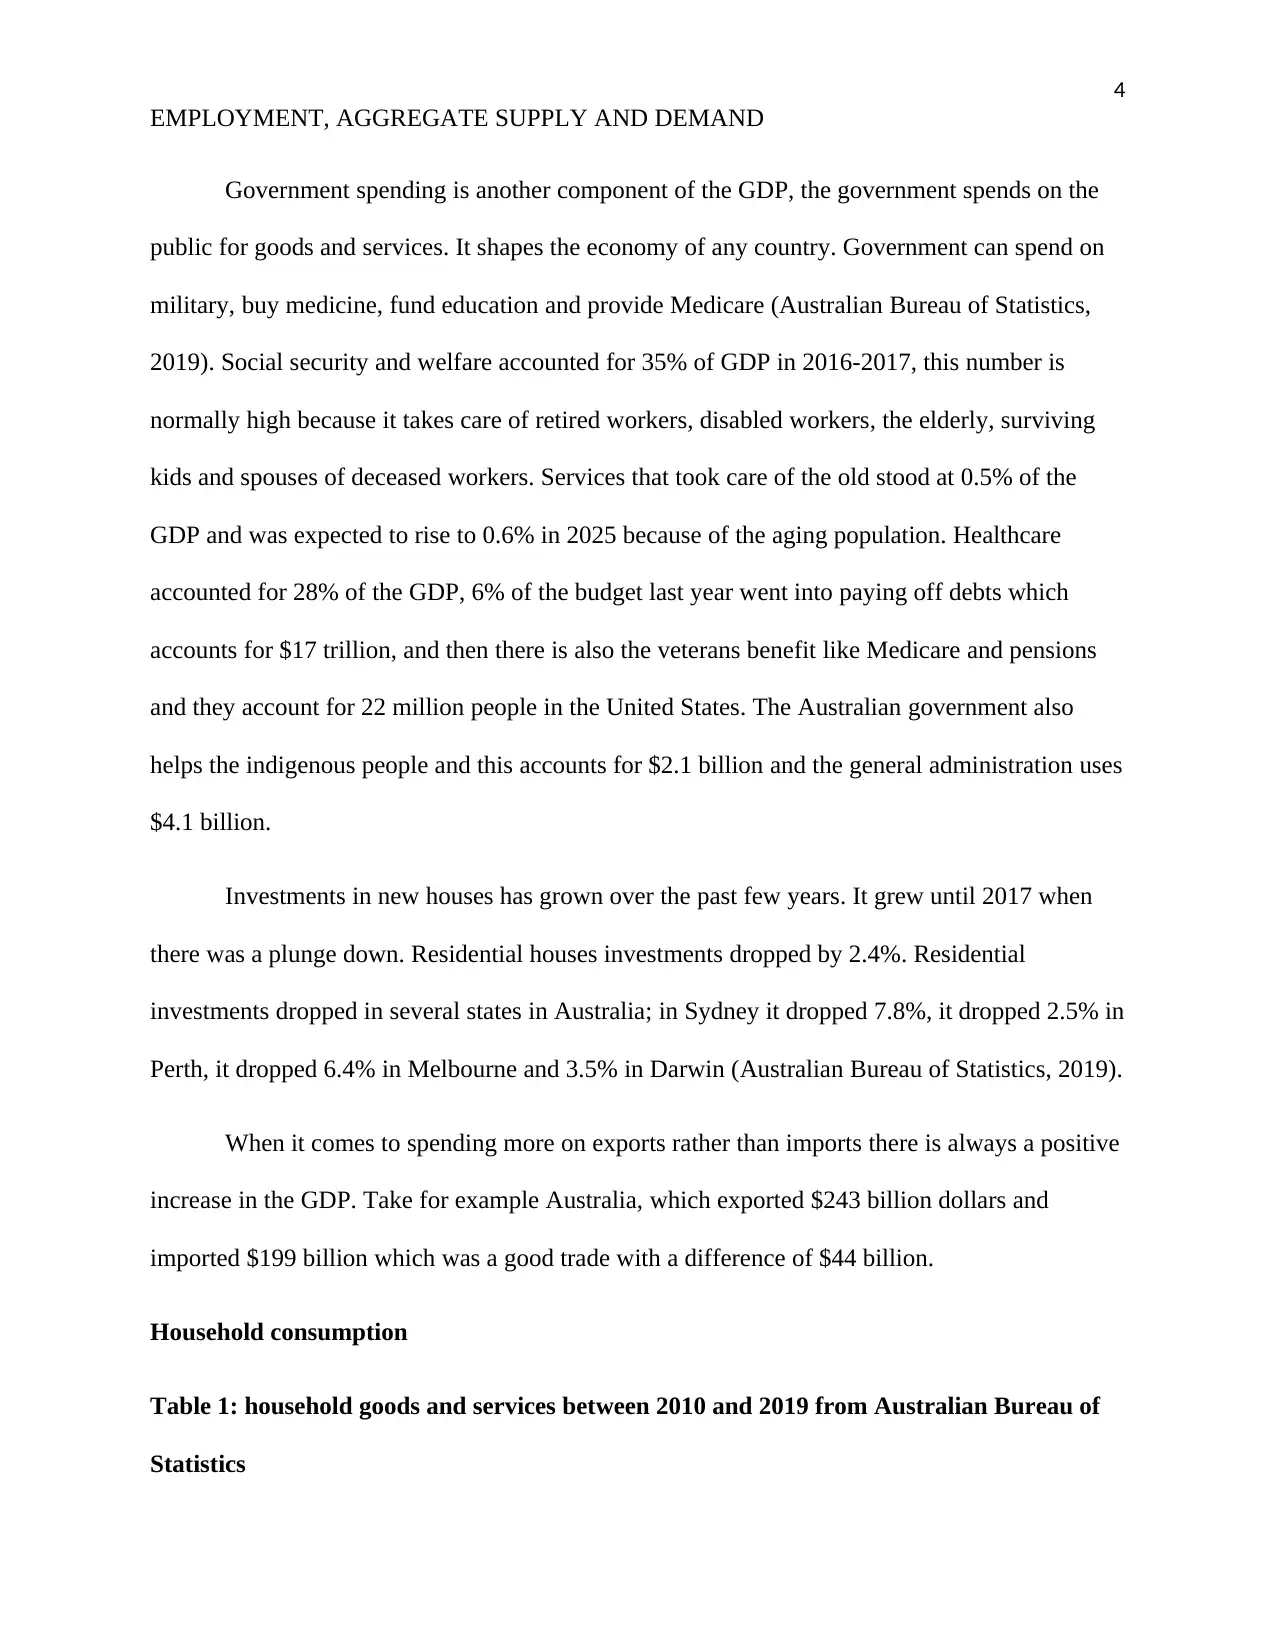
Government spending is another component of the GDP, the government spends on the
public for goods and services. It shapes the economy of any country. Government can spend on
military, buy medicine, fund education and provide Medicare (Australian Bureau of Statistics,
2019). Social security and welfare accounted for 35% of GDP in 2016-2017, this number is
normally high because it takes care of retired workers, disabled workers, the elderly, surviving
kids and spouses of deceased workers. Services that took care of the old stood at 0.5% of the
GDP and was expected to rise to 0.6% in 2025 because of the aging population. Healthcare
accounted for 28% of the GDP, 6% of the budget last year went into paying off debts which
accounts for $17 trillion, and then there is also the veterans benefit like Medicare and pensions
and they account for 22 million people in the United States. The Australian government also
helps the indigenous people and this accounts for $2.1 billion and the general administration uses
$4.1 billion.
Investments in new houses has grown over the past few years. It grew until 2017 when
there was a plunge down. Residential houses investments dropped by 2.4%. Residential
investments dropped in several states in Australia; in Sydney it dropped 7.8%, it dropped 2.5% in
Perth, it dropped 6.4% in Melbourne and 3.5% in Darwin (Australian Bureau of Statistics, 2019).
When it comes to spending more on exports rather than imports there is always a positive
increase in the GDP. Take for example Australia, which exported $243 billion dollars and
imported $199 billion which was a good trade with a difference of $44 billion.
Household consumption
Table 1: household goods and services between 2010 and 2019 from Australian Bureau of
Statistics
EMPLOYMENT, AGGREGATE SUPPLY AND DEMAND
Government spending is another component of the GDP, the government spends on the
public for goods and services. It shapes the economy of any country. Government can spend on
military, buy medicine, fund education and provide Medicare (Australian Bureau of Statistics,
2019). Social security and welfare accounted for 35% of GDP in 2016-2017, this number is
normally high because it takes care of retired workers, disabled workers, the elderly, surviving
kids and spouses of deceased workers. Services that took care of the old stood at 0.5% of the
GDP and was expected to rise to 0.6% in 2025 because of the aging population. Healthcare
accounted for 28% of the GDP, 6% of the budget last year went into paying off debts which
accounts for $17 trillion, and then there is also the veterans benefit like Medicare and pensions
and they account for 22 million people in the United States. The Australian government also
helps the indigenous people and this accounts for $2.1 billion and the general administration uses
$4.1 billion.
Investments in new houses has grown over the past few years. It grew until 2017 when
there was a plunge down. Residential houses investments dropped by 2.4%. Residential
investments dropped in several states in Australia; in Sydney it dropped 7.8%, it dropped 2.5% in
Perth, it dropped 6.4% in Melbourne and 3.5% in Darwin (Australian Bureau of Statistics, 2019).
When it comes to spending more on exports rather than imports there is always a positive
increase in the GDP. Take for example Australia, which exported $243 billion dollars and
imported $199 billion which was a good trade with a difference of $44 billion.
Household consumption
Table 1: household goods and services between 2010 and 2019 from Australian Bureau of
Statistics
Paraphrase This Document
Need a fresh take? Get an instant paraphrase of this document with our AI Paraphraser
5
EMPLOYMENT, AGGREGATE SUPPLY AND DEMAND
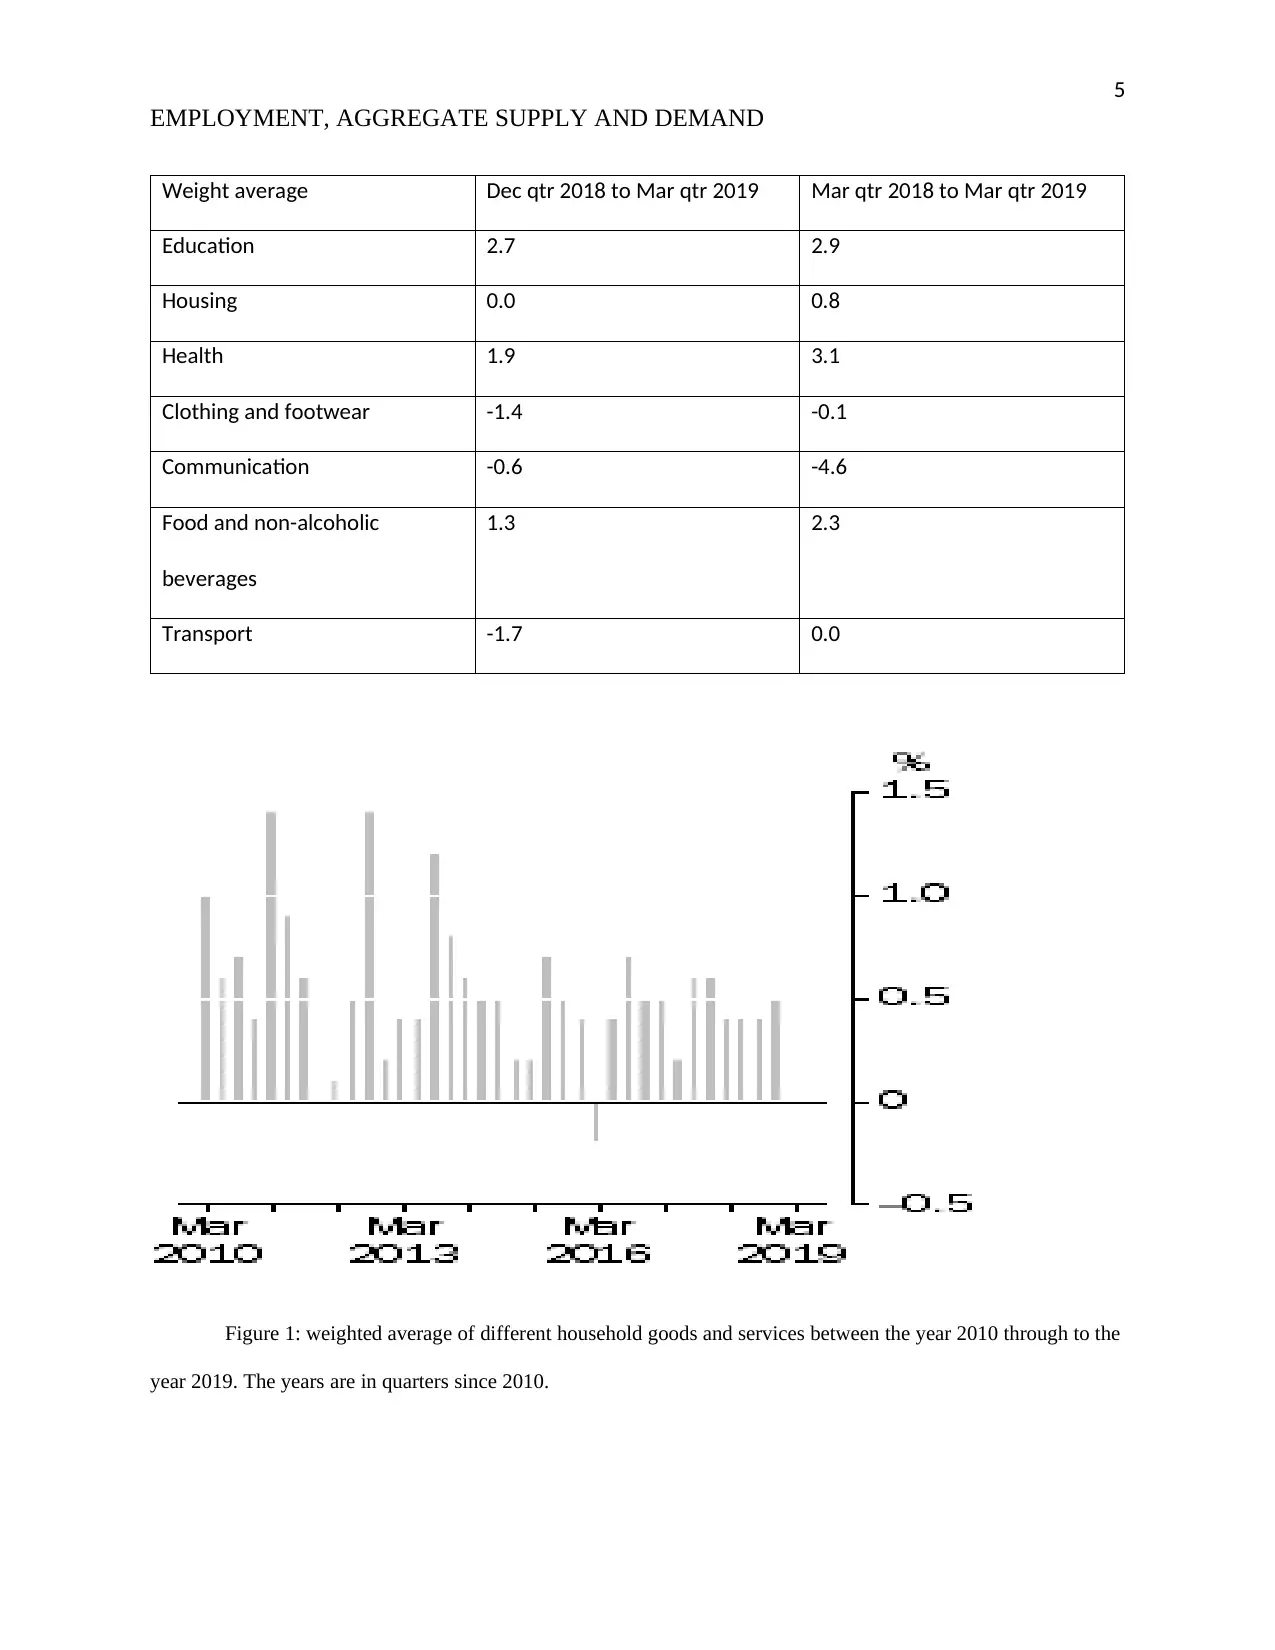
Weight average Dec qtr 2018 to Mar qtr 2019 Mar qtr 2018 to Mar qtr 2019
Education 2.7 2.9
Housing 0.0 0.8
Health 1.9 3.1
Clothing and footwear -1.4 -0.1
Communication -0.6 -4.6
Food and non-alcoholic
beverages
1.3 2.3
Transport -1.7 0.0
Figure 1: weighted average of different household goods and services between the year 2010 through to the
year 2019. The years are in quarters since 2010.
EMPLOYMENT, AGGREGATE SUPPLY AND DEMAND
Weight average Dec qtr 2018 to Mar qtr 2019 Mar qtr 2018 to Mar qtr 2019
Education 2.7 2.9
Housing 0.0 0.8
Health 1.9 3.1
Clothing and footwear -1.4 -0.1
Communication -0.6 -4.6
Food and non-alcoholic
beverages
1.3 2.3
Transport -1.7 0.0
Figure 1: weighted average of different household goods and services between the year 2010 through to the
year 2019. The years are in quarters since 2010.
6
EMPLOYMENT, AGGREGATE SUPPLY AND DEMAND
Education, medical, hospital services and vegetables are the kind of products that rose
while recreation, travel and accommodation fell (Australian Bureau of Statistics, 2019). Since
2008 there has been a slight drop in spending in the household goods and services. Mostly
because the prices of these goods and services have been rising up, also because of the rising
amounts of fuel.
Exports
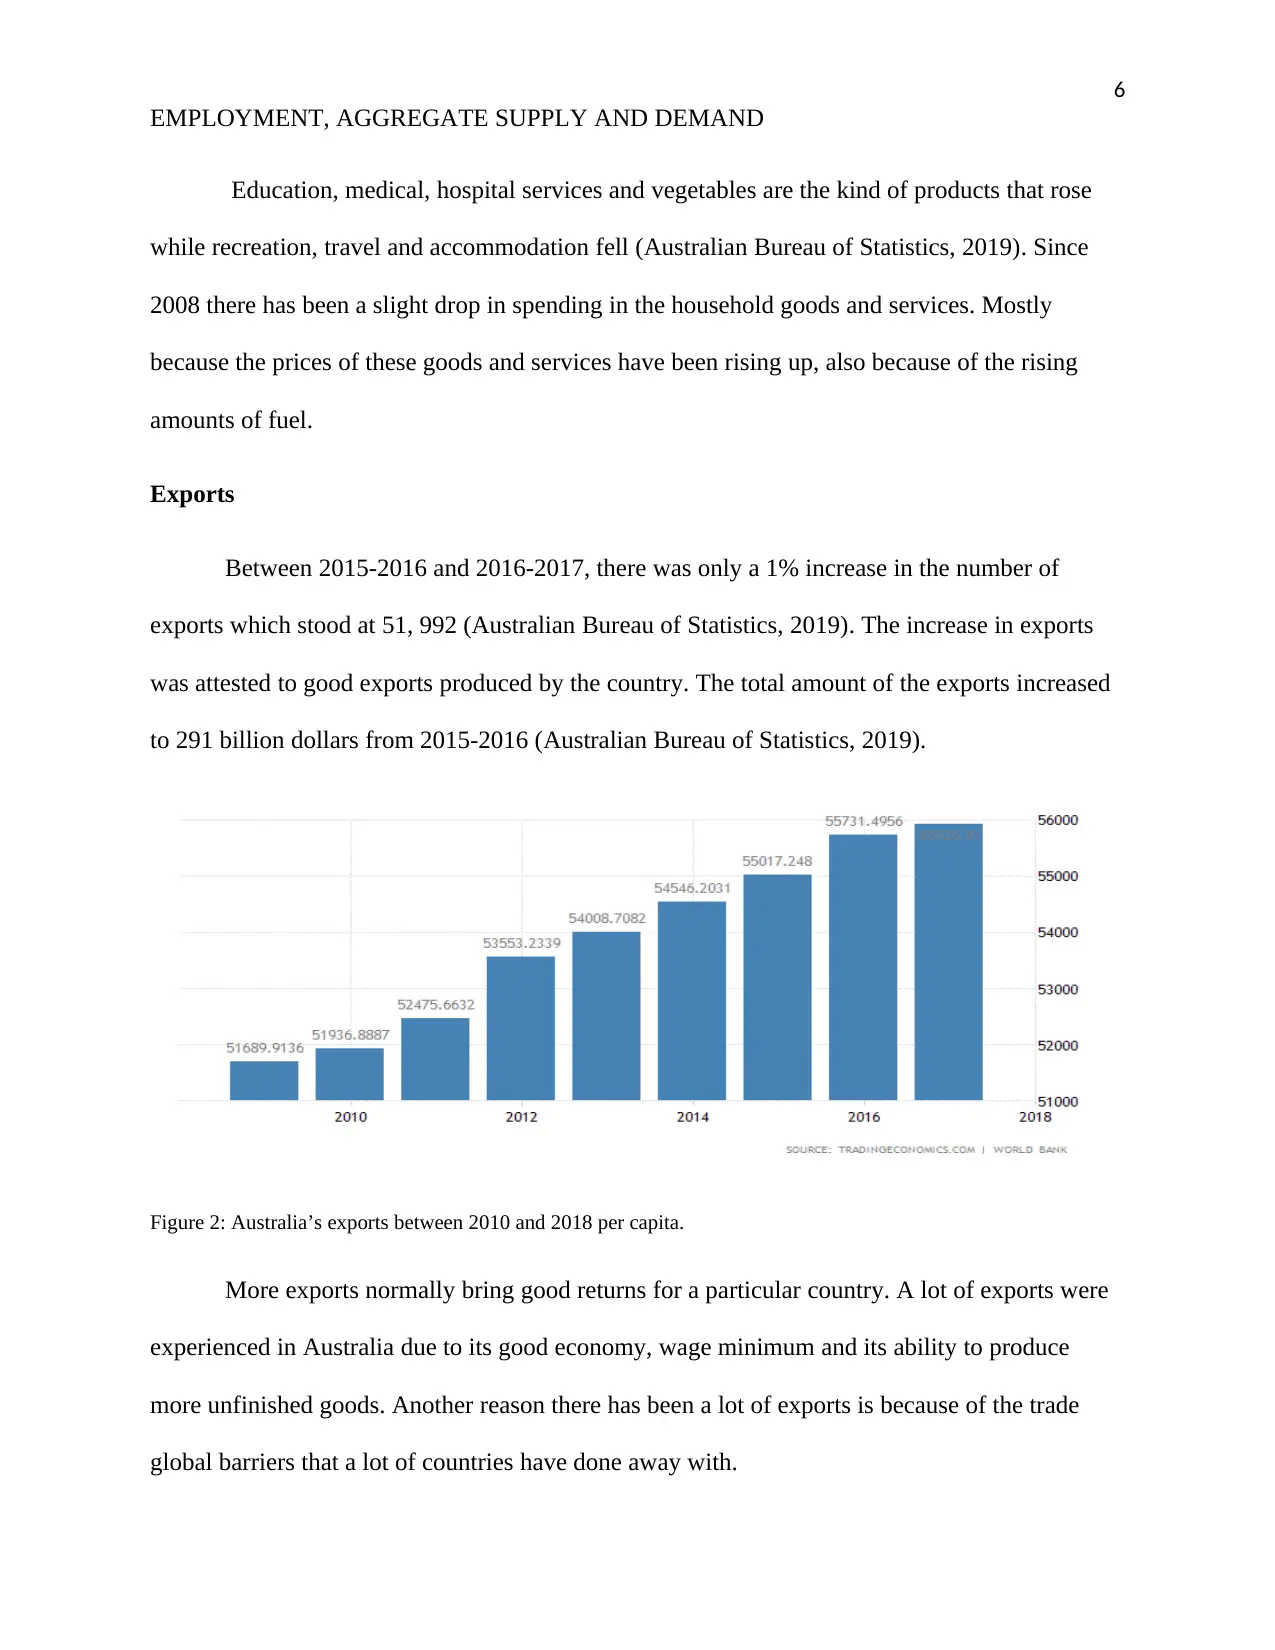
Between 2015-2016 and 2016-2017, there was only a 1% increase in the number of
exports which stood at 51, 992 (Australian Bureau of Statistics, 2019). The increase in exports
was attested to good exports produced by the country. The total amount of the exports increased
to 291 billion dollars from 2015-2016 (Australian Bureau of Statistics, 2019).
Figure 2: Australia’s exports between 2010 and 2018 per capita.
More exports normally bring good returns for a particular country. A lot of exports were
experienced in Australia due to its good economy, wage minimum and its ability to produce
more unfinished goods. Another reason there has been a lot of exports is because of the trade
global barriers that a lot of countries have done away with.
EMPLOYMENT, AGGREGATE SUPPLY AND DEMAND
Education, medical, hospital services and vegetables are the kind of products that rose
while recreation, travel and accommodation fell (Australian Bureau of Statistics, 2019). Since
2008 there has been a slight drop in spending in the household goods and services. Mostly
because the prices of these goods and services have been rising up, also because of the rising
amounts of fuel.
Exports
Between 2015-2016 and 2016-2017, there was only a 1% increase in the number of
exports which stood at 51, 992 (Australian Bureau of Statistics, 2019). The increase in exports
was attested to good exports produced by the country. The total amount of the exports increased
to 291 billion dollars from 2015-2016 (Australian Bureau of Statistics, 2019).
Figure 2: Australia’s exports between 2010 and 2018 per capita.
More exports normally bring good returns for a particular country. A lot of exports were
experienced in Australia due to its good economy, wage minimum and its ability to produce
more unfinished goods. Another reason there has been a lot of exports is because of the trade
global barriers that a lot of countries have done away with.
⊘ This is a preview!⊘
Do you want full access?
Subscribe today to unlock all pages.
Trusted by 1+ million students worldwide
7
EMPLOYMENT, AGGREGATE SUPPLY AND DEMAND
Investments
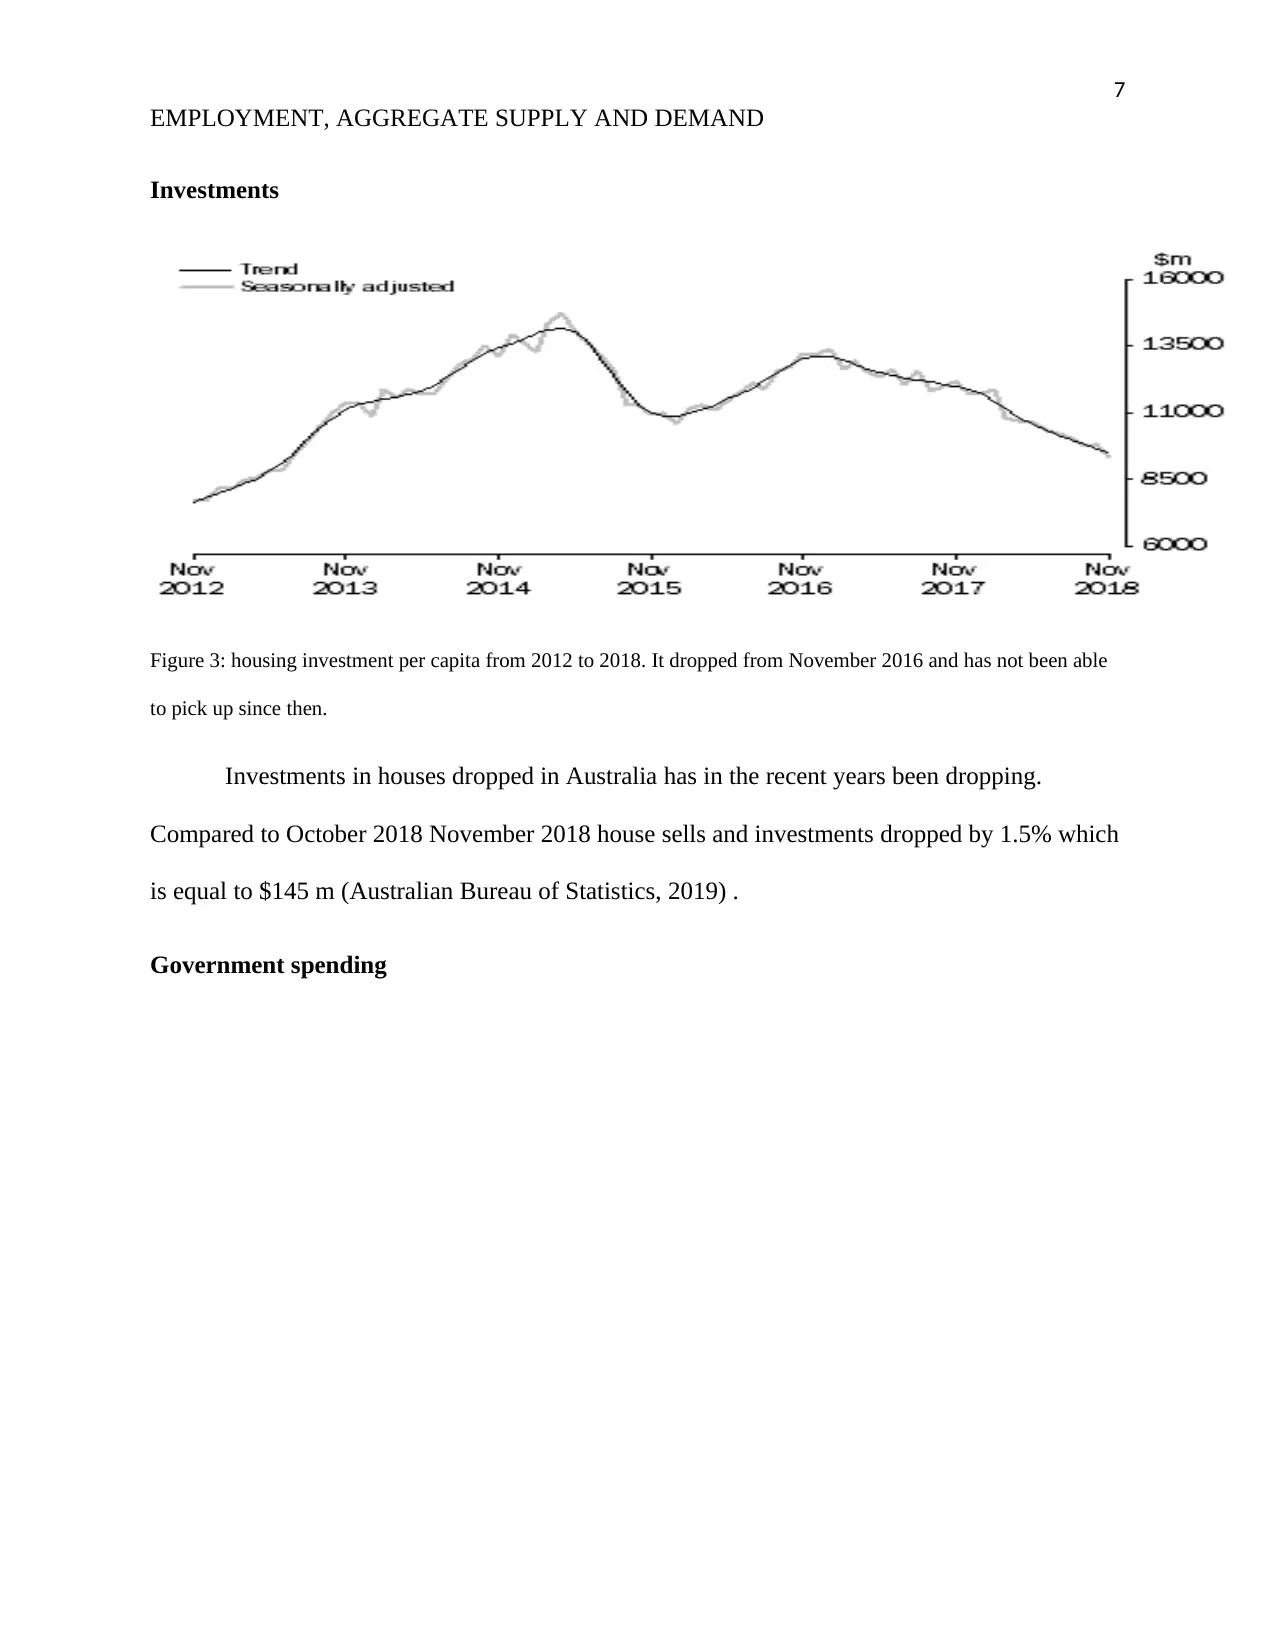
Figure 3: housing investment per capita from 2012 to 2018. It dropped from November 2016 and has not been able
to pick up since then.
Investments in houses dropped in Australia has in the recent years been dropping.
Compared to October 2018 November 2018 house sells and investments dropped by 1.5% which
is equal to $145 m (Australian Bureau of Statistics, 2019) .
Government spending
EMPLOYMENT, AGGREGATE SUPPLY AND DEMAND
Investments
Figure 3: housing investment per capita from 2012 to 2018. It dropped from November 2016 and has not been able
to pick up since then.
Investments in houses dropped in Australia has in the recent years been dropping.
Compared to October 2018 November 2018 house sells and investments dropped by 1.5% which
is equal to $145 m (Australian Bureau of Statistics, 2019) .
Government spending
Paraphrase This Document
Need a fresh take? Get an instant paraphrase of this document with our AI Paraphraser
8
EMPLOYMENT, AGGREGATE SUPPLY AND DEMAND
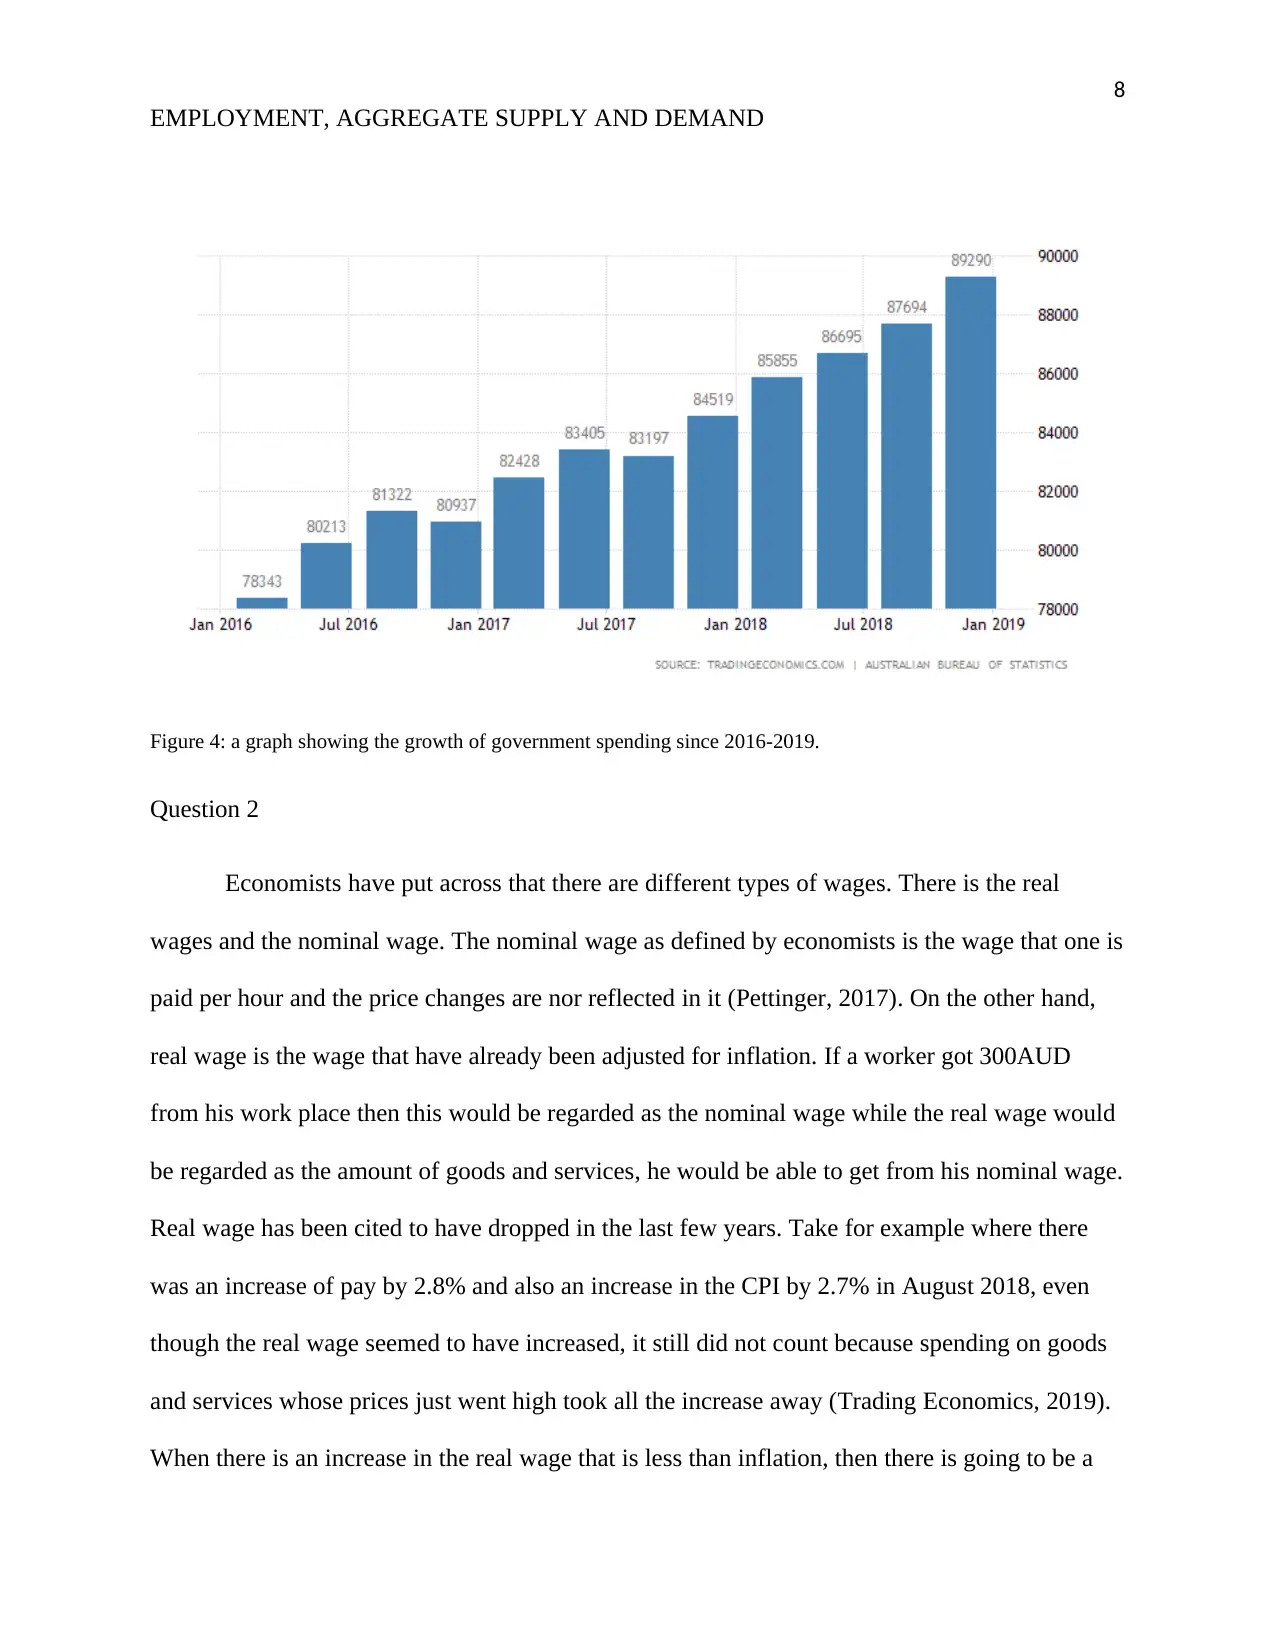
Figure 4: a graph showing the growth of government spending since 2016-2019.
Question 2
Economists have put across that there are different types of wages. There is the real
wages and the nominal wage. The nominal wage as defined by economists is the wage that one is
paid per hour and the price changes are nor reflected in it (Pettinger, 2017). On the other hand,
real wage is the wage that have already been adjusted for inflation. If a worker got 300AUD
from his work place then this would be regarded as the nominal wage while the real wage would
be regarded as the amount of goods and services, he would be able to get from his nominal wage.
Real wage has been cited to have dropped in the last few years. Take for example where there
was an increase of pay by 2.8% and also an increase in the CPI by 2.7% in August 2018, even
though the real wage seemed to have increased, it still did not count because spending on goods
and services whose prices just went high took all the increase away (Trading Economics, 2019).
When there is an increase in the real wage that is less than inflation, then there is going to be a
EMPLOYMENT, AGGREGATE SUPPLY AND DEMAND
Figure 4: a graph showing the growth of government spending since 2016-2019.
Question 2
Economists have put across that there are different types of wages. There is the real
wages and the nominal wage. The nominal wage as defined by economists is the wage that one is
paid per hour and the price changes are nor reflected in it (Pettinger, 2017). On the other hand,
real wage is the wage that have already been adjusted for inflation. If a worker got 300AUD
from his work place then this would be regarded as the nominal wage while the real wage would
be regarded as the amount of goods and services, he would be able to get from his nominal wage.
Real wage has been cited to have dropped in the last few years. Take for example where there
was an increase of pay by 2.8% and also an increase in the CPI by 2.7% in August 2018, even
though the real wage seemed to have increased, it still did not count because spending on goods
and services whose prices just went high took all the increase away (Trading Economics, 2019).
When there is an increase in the real wage that is less than inflation, then there is going to be a
9
EMPLOYMENT, AGGREGATE SUPPLY AND DEMAND
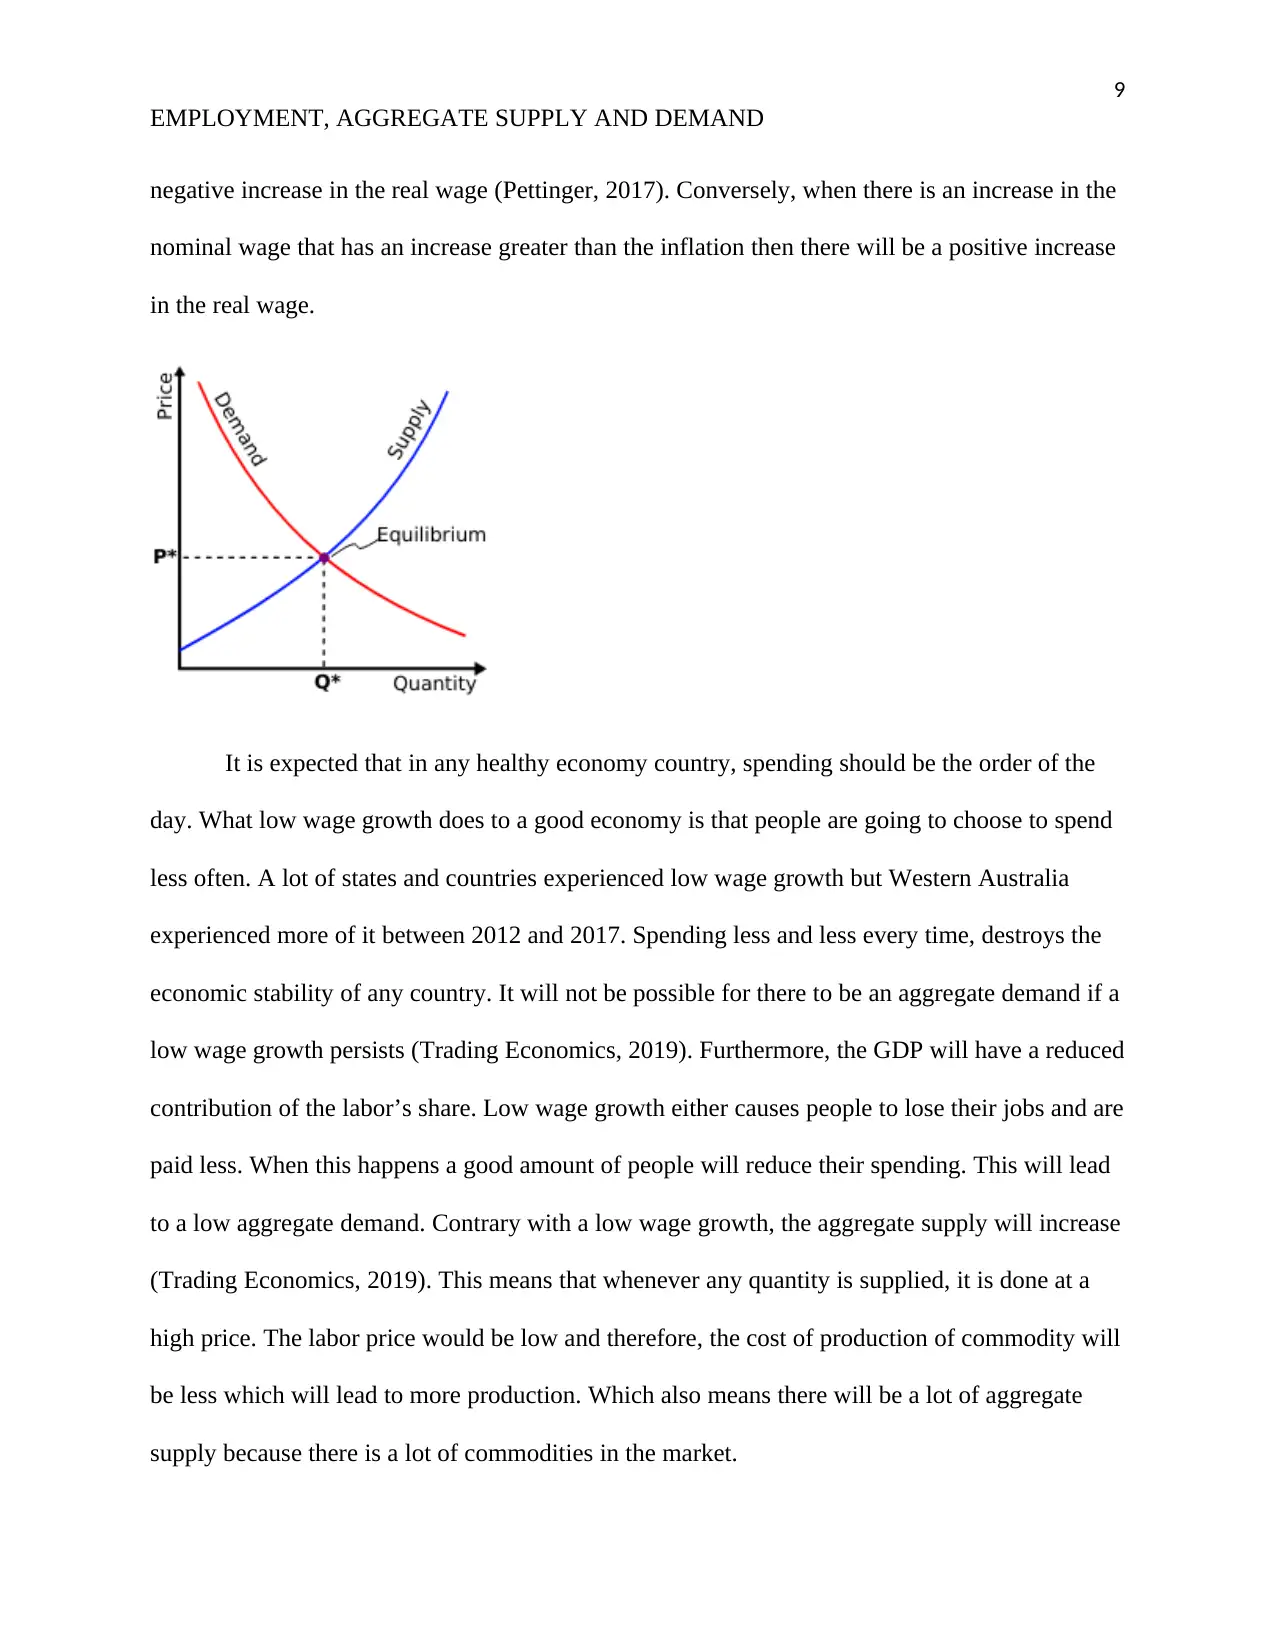
negative increase in the real wage (Pettinger, 2017). Conversely, when there is an increase in the
nominal wage that has an increase greater than the inflation then there will be a positive increase
in the real wage.
It is expected that in any healthy economy country, spending should be the order of the
day. What low wage growth does to a good economy is that people are going to choose to spend
less often. A lot of states and countries experienced low wage growth but Western Australia
experienced more of it between 2012 and 2017. Spending less and less every time, destroys the
economic stability of any country. It will not be possible for there to be an aggregate demand if a
low wage growth persists (Trading Economics, 2019). Furthermore, the GDP will have a reduced
contribution of the labor’s share. Low wage growth either causes people to lose their jobs and are
paid less. When this happens a good amount of people will reduce their spending. This will lead
to a low aggregate demand. Contrary with a low wage growth, the aggregate supply will increase
(Trading Economics, 2019). This means that whenever any quantity is supplied, it is done at a
high price. The labor price would be low and therefore, the cost of production of commodity will
be less which will lead to more production. Which also means there will be a lot of aggregate
supply because there is a lot of commodities in the market.
EMPLOYMENT, AGGREGATE SUPPLY AND DEMAND
negative increase in the real wage (Pettinger, 2017). Conversely, when there is an increase in the
nominal wage that has an increase greater than the inflation then there will be a positive increase
in the real wage.
It is expected that in any healthy economy country, spending should be the order of the
day. What low wage growth does to a good economy is that people are going to choose to spend
less often. A lot of states and countries experienced low wage growth but Western Australia
experienced more of it between 2012 and 2017. Spending less and less every time, destroys the
economic stability of any country. It will not be possible for there to be an aggregate demand if a
low wage growth persists (Trading Economics, 2019). Furthermore, the GDP will have a reduced
contribution of the labor’s share. Low wage growth either causes people to lose their jobs and are
paid less. When this happens a good amount of people will reduce their spending. This will lead
to a low aggregate demand. Contrary with a low wage growth, the aggregate supply will increase
(Trading Economics, 2019). This means that whenever any quantity is supplied, it is done at a
high price. The labor price would be low and therefore, the cost of production of commodity will
be less which will lead to more production. Which also means there will be a lot of aggregate
supply because there is a lot of commodities in the market.
⊘ This is a preview!⊘
Do you want full access?
Subscribe today to unlock all pages.
Trusted by 1+ million students worldwide
10
EMPLOYMENT, AGGREGATE SUPPLY AND DEMAND
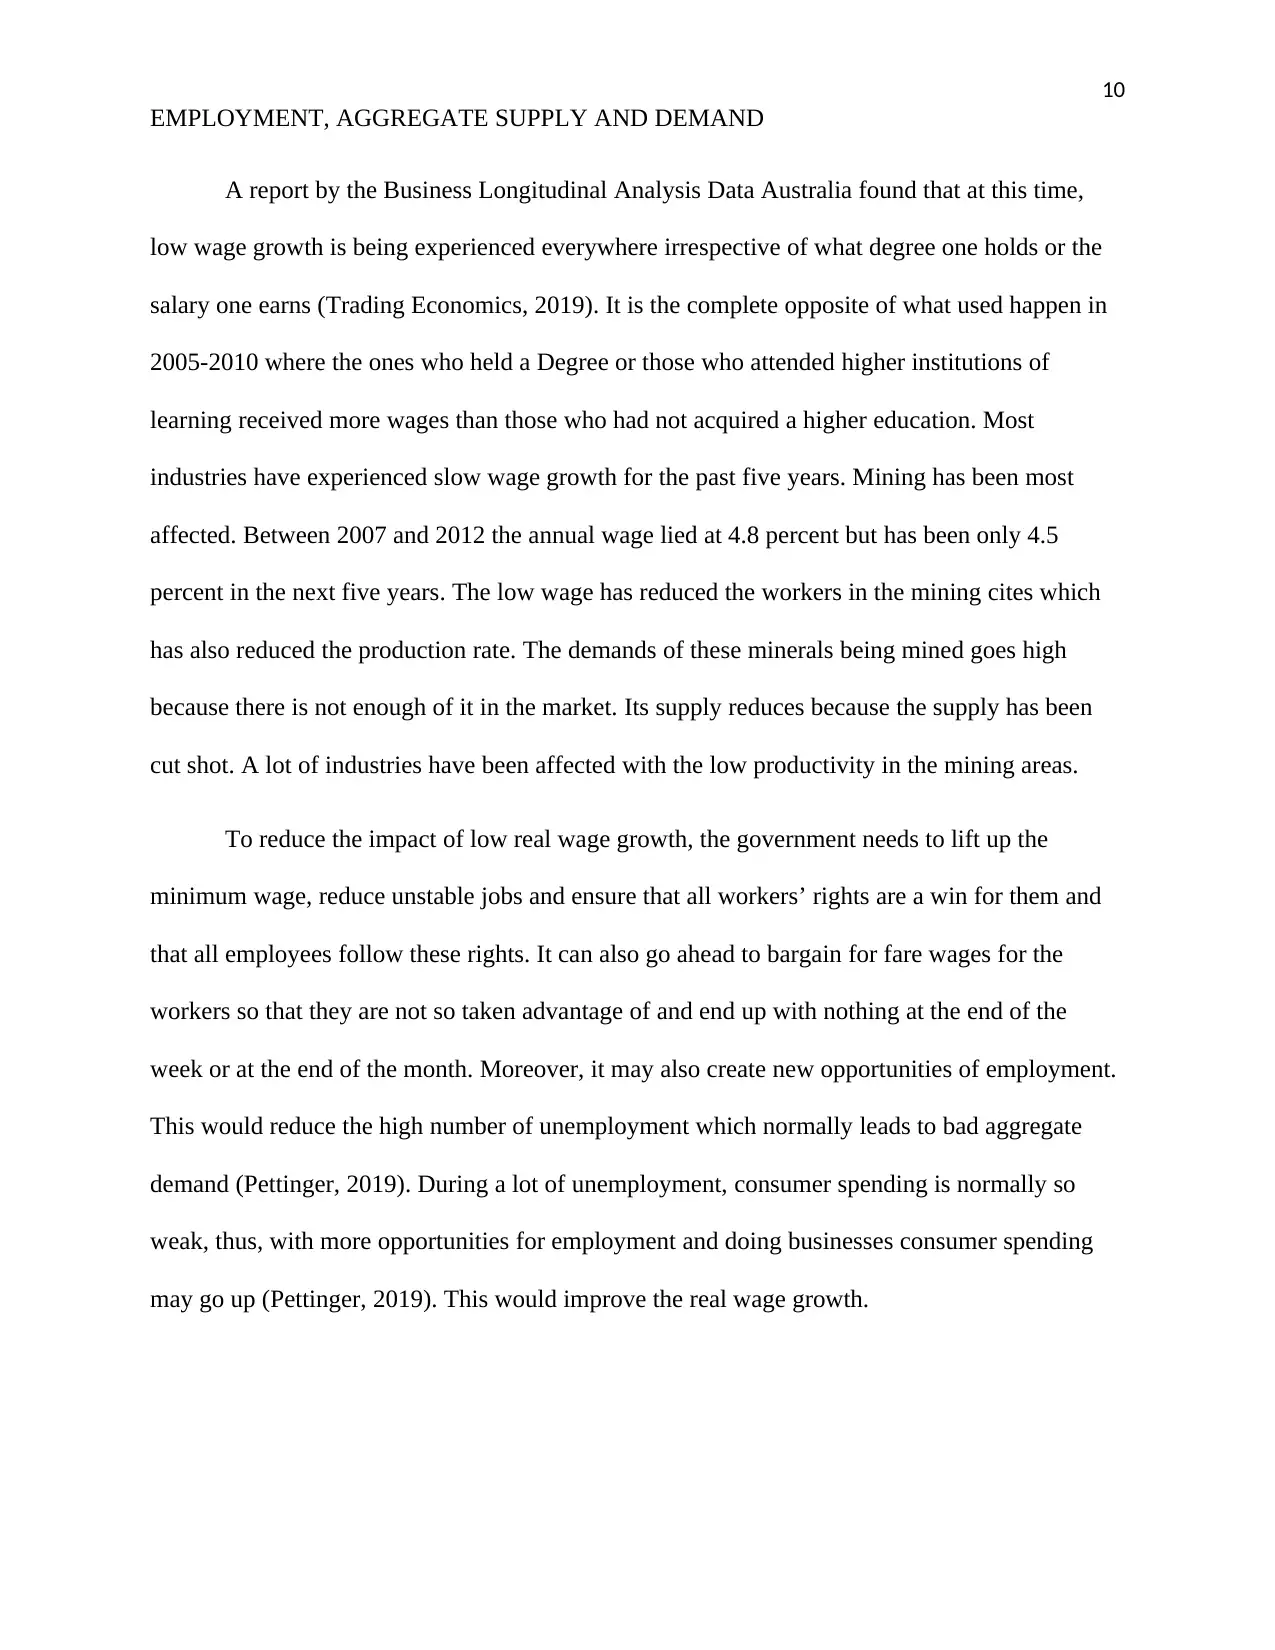
A report by the Business Longitudinal Analysis Data Australia found that at this time,
low wage growth is being experienced everywhere irrespective of what degree one holds or the
salary one earns (Trading Economics, 2019). It is the complete opposite of what used happen in
2005-2010 where the ones who held a Degree or those who attended higher institutions of
learning received more wages than those who had not acquired a higher education. Most
industries have experienced slow wage growth for the past five years. Mining has been most
affected. Between 2007 and 2012 the annual wage lied at 4.8 percent but has been only 4.5
percent in the next five years. The low wage has reduced the workers in the mining cites which
has also reduced the production rate. The demands of these minerals being mined goes high
because there is not enough of it in the market. Its supply reduces because the supply has been
cut shot. A lot of industries have been affected with the low productivity in the mining areas.
To reduce the impact of low real wage growth, the government needs to lift up the
minimum wage, reduce unstable jobs and ensure that all workers’ rights are a win for them and
that all employees follow these rights. It can also go ahead to bargain for fare wages for the
workers so that they are not so taken advantage of and end up with nothing at the end of the
week or at the end of the month. Moreover, it may also create new opportunities of employment.
This would reduce the high number of unemployment which normally leads to bad aggregate
demand (Pettinger, 2019). During a lot of unemployment, consumer spending is normally so
weak, thus, with more opportunities for employment and doing businesses consumer spending
may go up (Pettinger, 2019). This would improve the real wage growth.
EMPLOYMENT, AGGREGATE SUPPLY AND DEMAND
A report by the Business Longitudinal Analysis Data Australia found that at this time,
low wage growth is being experienced everywhere irrespective of what degree one holds or the
salary one earns (Trading Economics, 2019). It is the complete opposite of what used happen in
2005-2010 where the ones who held a Degree or those who attended higher institutions of
learning received more wages than those who had not acquired a higher education. Most
industries have experienced slow wage growth for the past five years. Mining has been most
affected. Between 2007 and 2012 the annual wage lied at 4.8 percent but has been only 4.5
percent in the next five years. The low wage has reduced the workers in the mining cites which
has also reduced the production rate. The demands of these minerals being mined goes high
because there is not enough of it in the market. Its supply reduces because the supply has been
cut shot. A lot of industries have been affected with the low productivity in the mining areas.
To reduce the impact of low real wage growth, the government needs to lift up the
minimum wage, reduce unstable jobs and ensure that all workers’ rights are a win for them and
that all employees follow these rights. It can also go ahead to bargain for fare wages for the
workers so that they are not so taken advantage of and end up with nothing at the end of the
week or at the end of the month. Moreover, it may also create new opportunities of employment.
This would reduce the high number of unemployment which normally leads to bad aggregate
demand (Pettinger, 2019). During a lot of unemployment, consumer spending is normally so
weak, thus, with more opportunities for employment and doing businesses consumer spending
may go up (Pettinger, 2019). This would improve the real wage growth.
Paraphrase This Document
Need a fresh take? Get an instant paraphrase of this document with our AI Paraphraser
11
EMPLOYMENT, AGGREGATE SUPPLY AND DEMAND
References
Australian Bureau of Statistics. (2019). Business Indicators - Australian Bureau of Statistics.
Retrieved from https://www.abs.gov.au/Business-Indicators
Beech, A., Dollman, R., Finlay, R., & La Cava, G. (2014). The distribution of household
spending in Australia. RBA Bulletin, 13-22.
Fuchs, V. R. (2013). The gross domestic product and health care spending. New England
Journal of Medicine, 369(2), 107-109.
Leimbach, M., Kriegler, E., Roming, N., & Schwanitz, J. (2017). Future growth patterns of
world regions–A GDP scenario approach. Global Environmental Change, 42, 215-225.
Pettinger, T. (2019). Effect of minimum wage on economic growth, inflation and AD/AS -
Economics Help. Retrieved from
https://www.economicshelp.org/blog/11503/labour-markets/effect-of-minimum-wage-on-adas/
Pettinger, T. (2017). Real Wages. Retrieved from
https://www.economicshelp.org/blog/2637/economics/real-wages-in-uk/
Trading Economics. (2019). Australia Government Spending | 2019 | Data | Chart | Calendar |
Forecast. Retrieved from https://tradingeconomics.com/australia/government-spending
1 out of 11
Related Documents


Your All-in-One AI-Powered Toolkit for Academic Success.
+13062052269
info@desklib.com
Available 24*7 on WhatsApp / Email
![[object Object]](/_next/static/media/star-bottom.7253800d.svg)
Unlock your academic potential
Copyright © 2020–2026 A2Z Services. All Rights Reserved. Developed and managed by ZUCOL.