Economics Assignment: AD-AS Model and Economic Impacts

Verified

Added on  2021/06/17

|11
|1116
|46
Homework Assignment
AI Summary
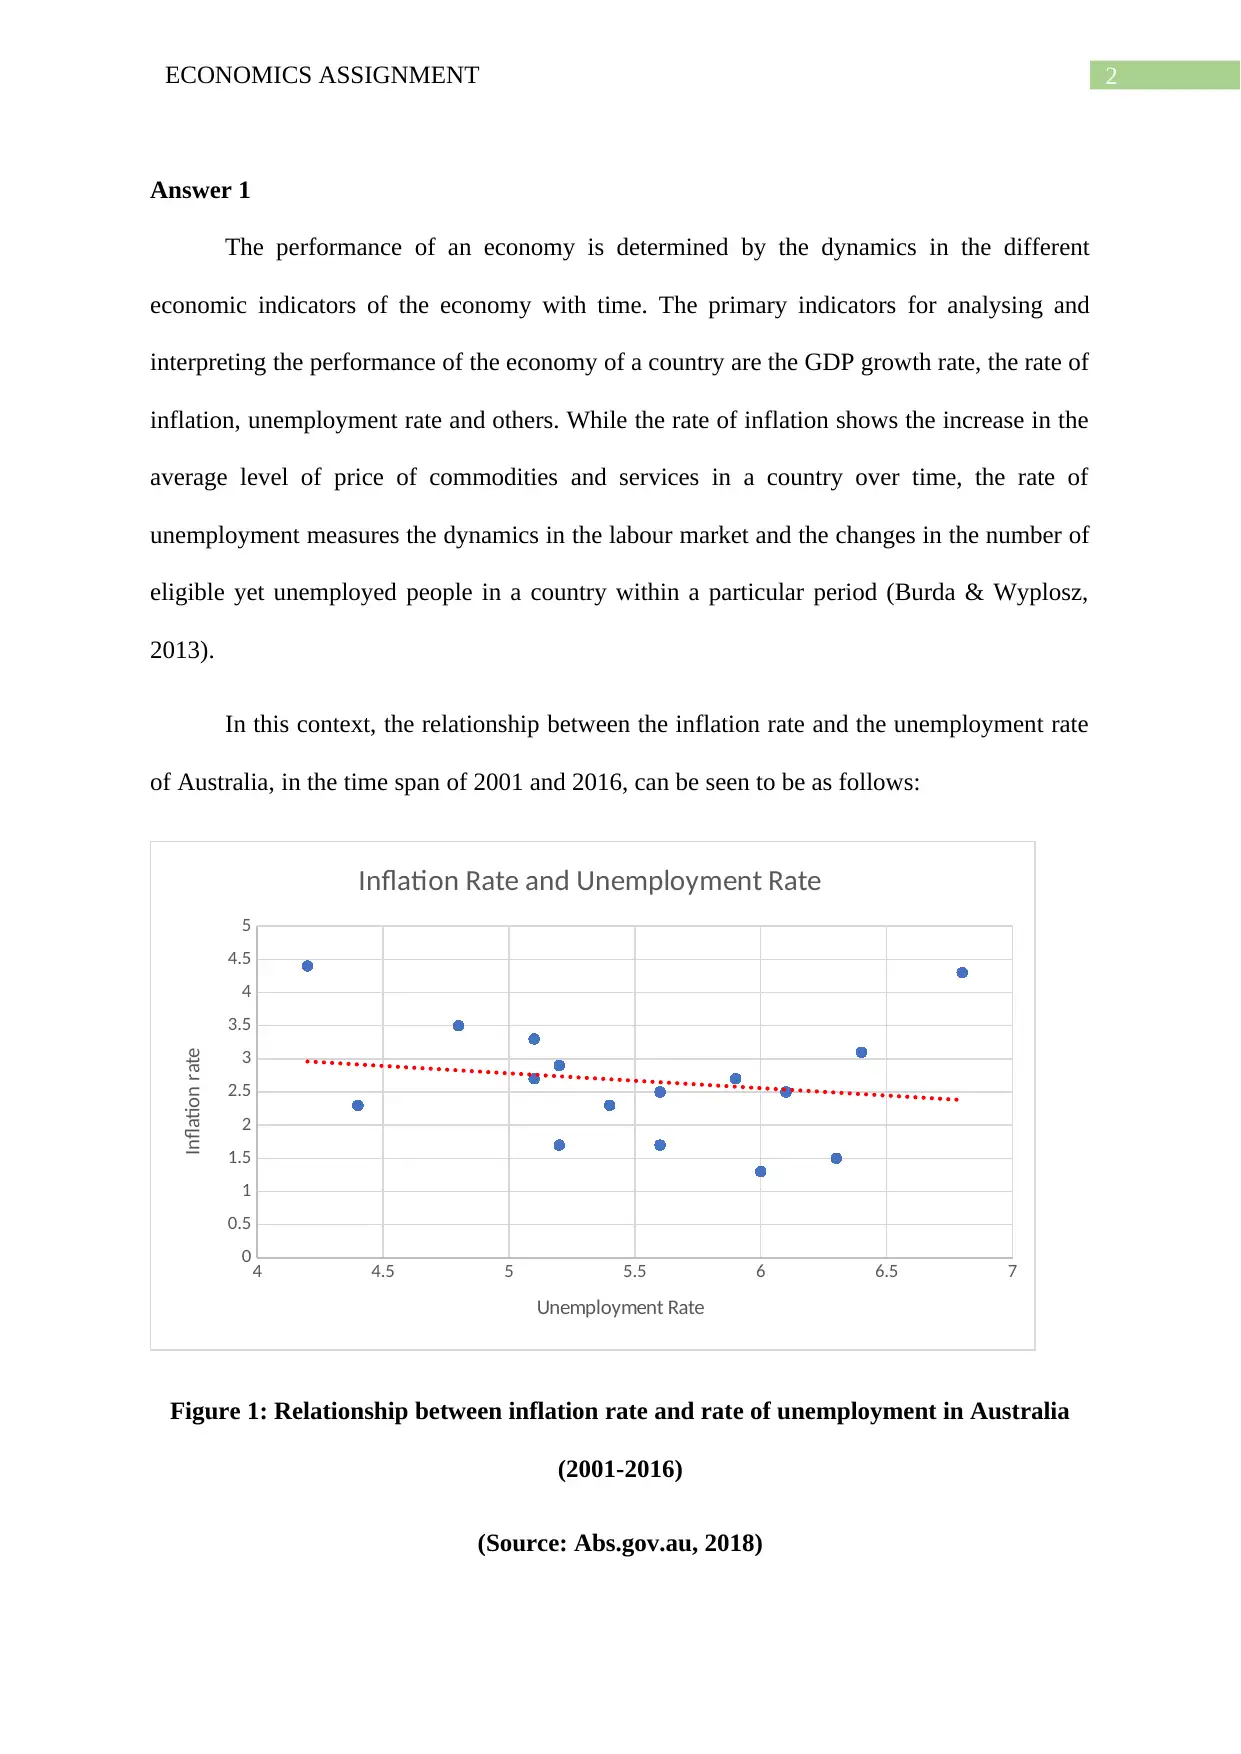
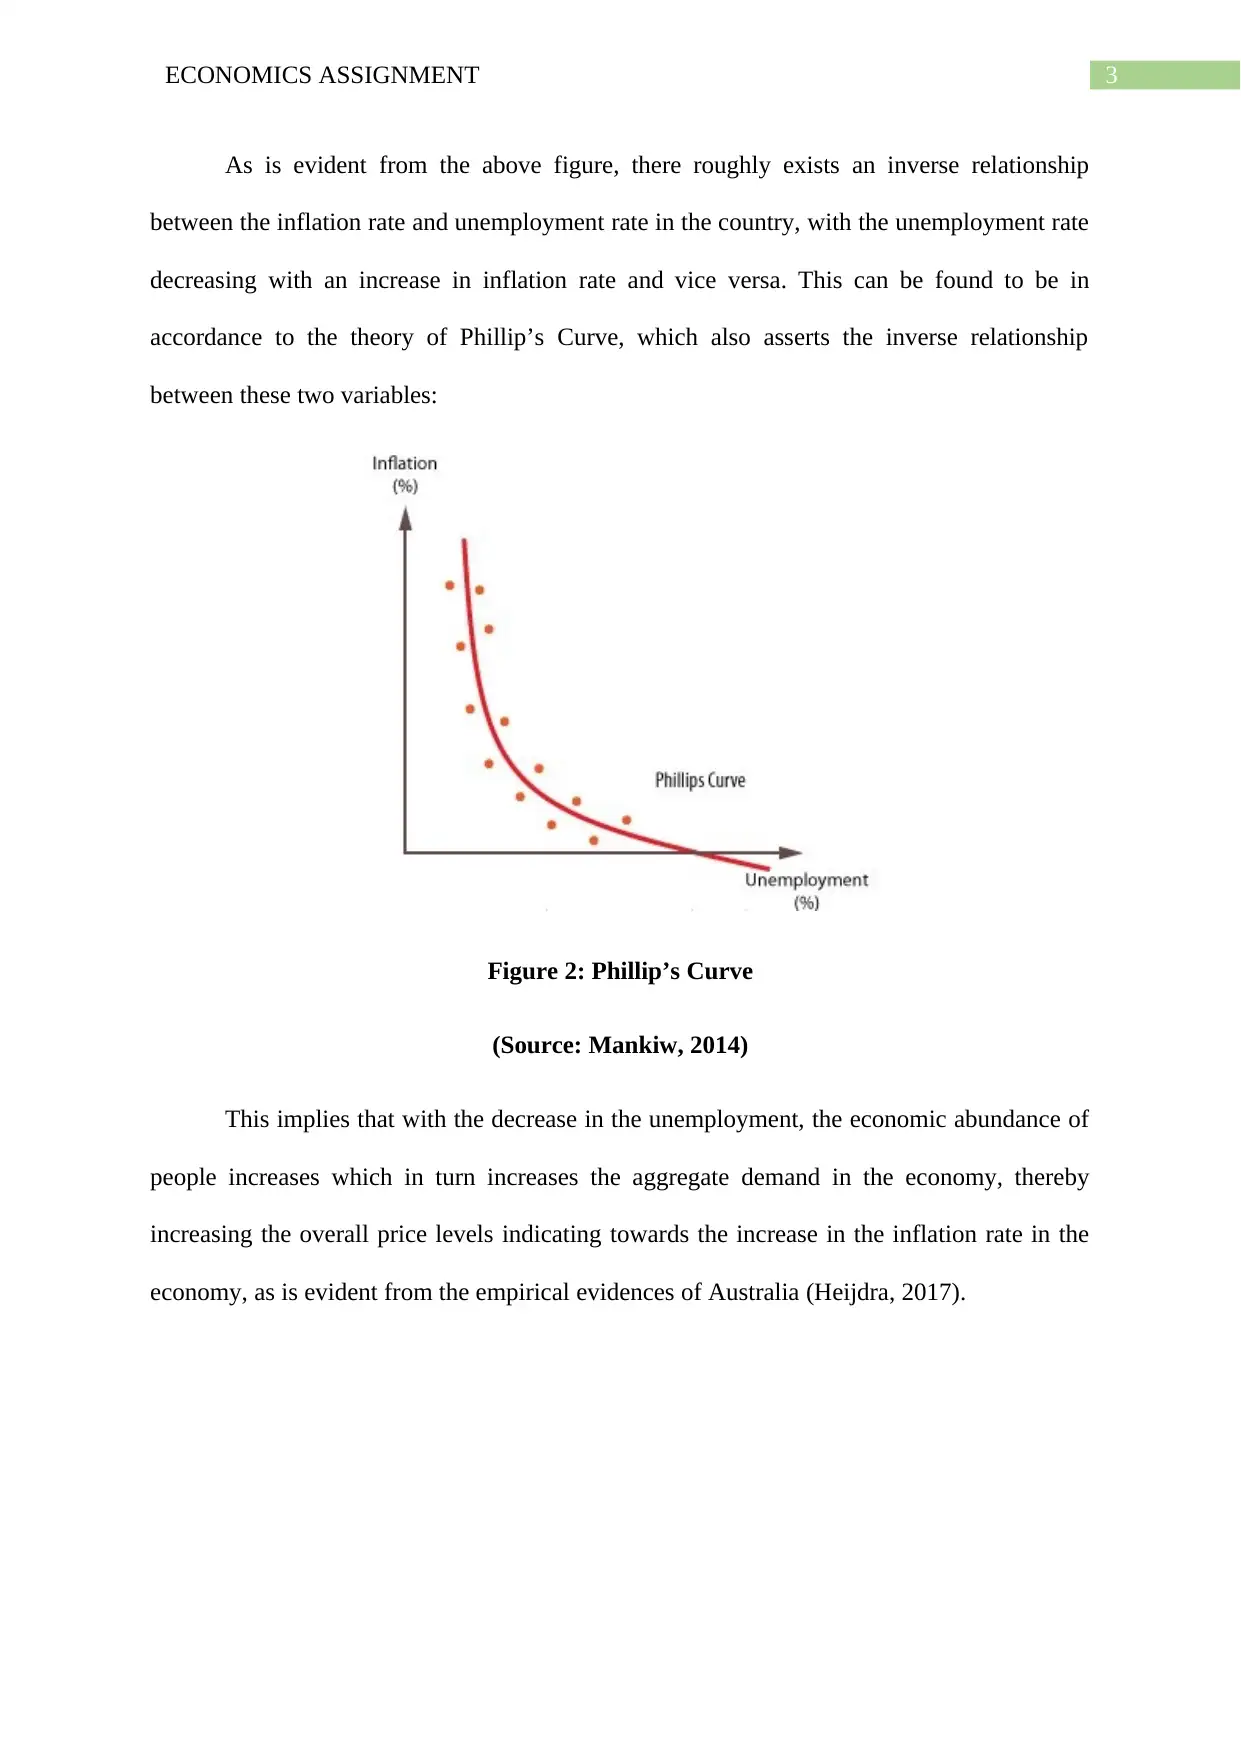
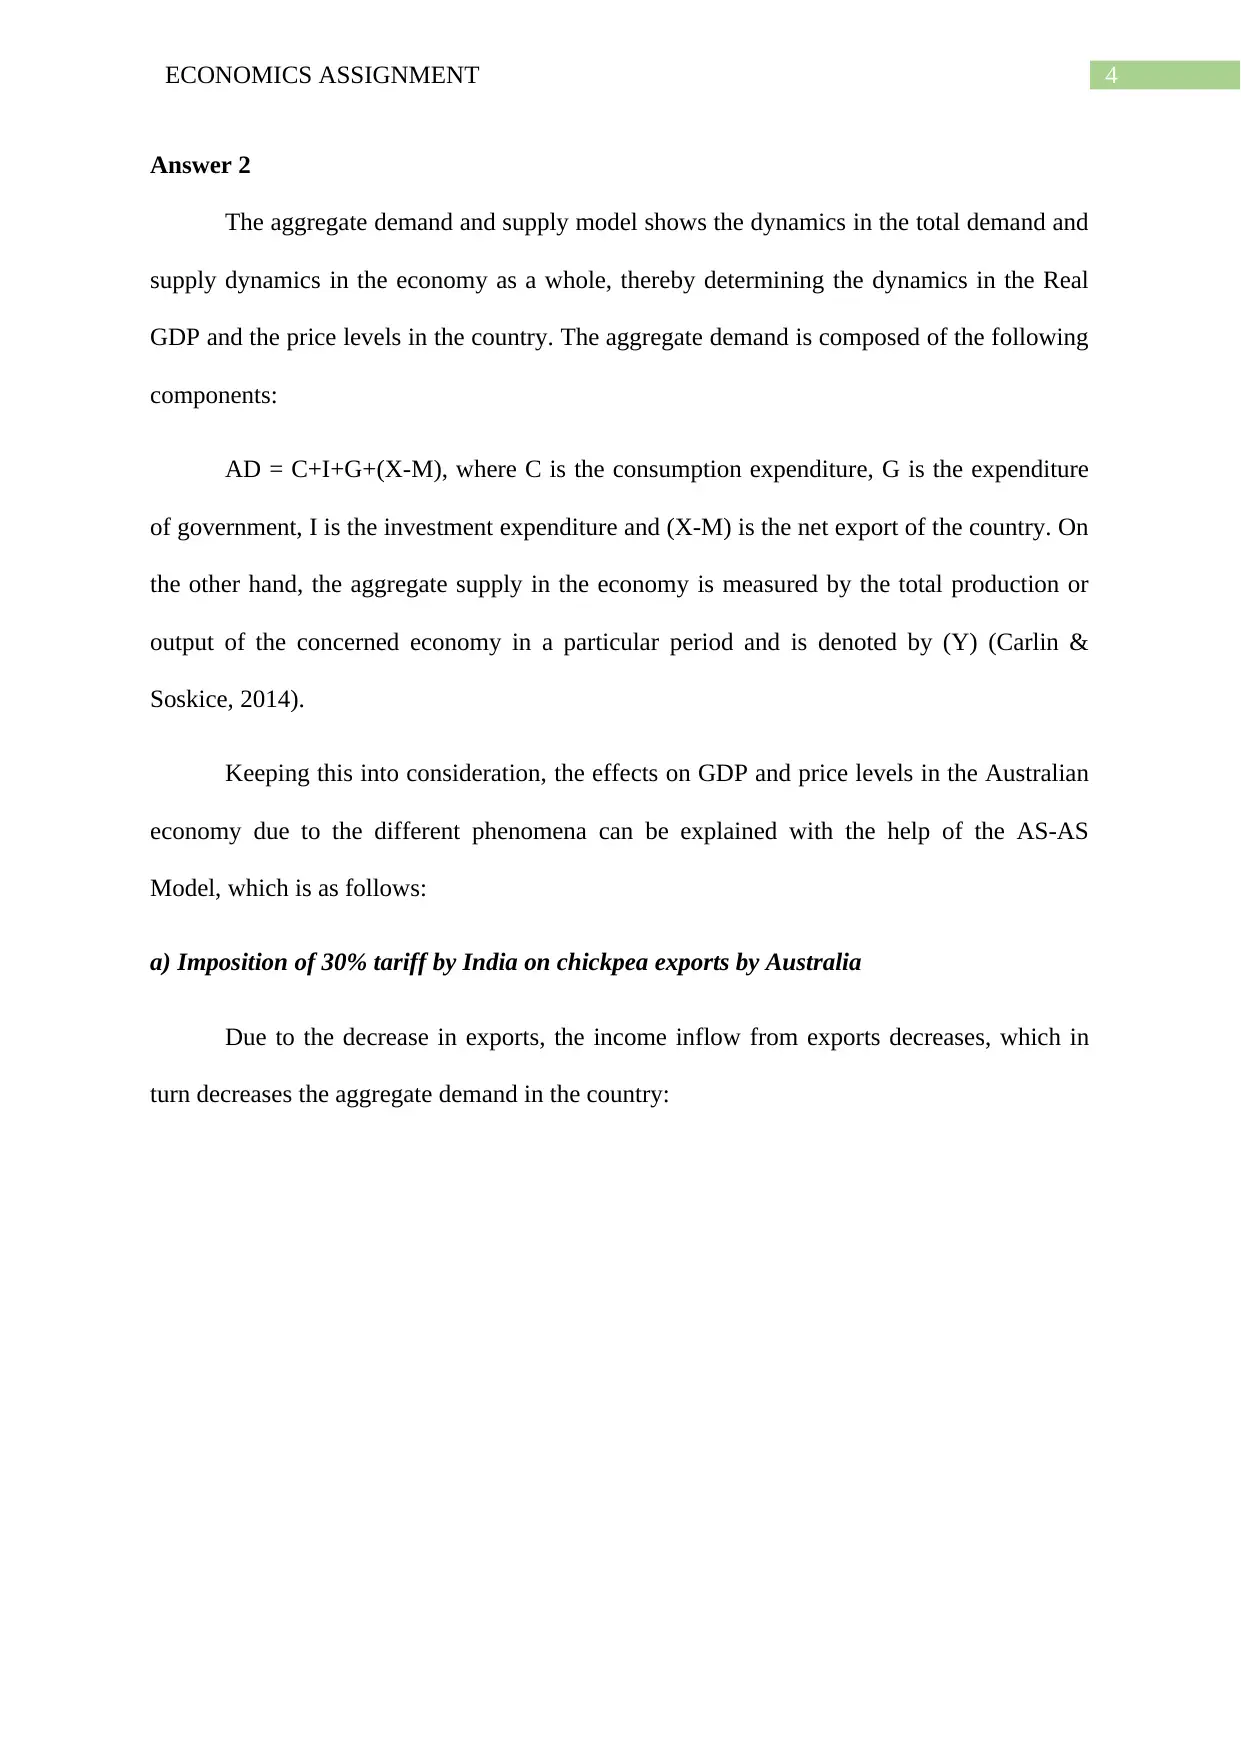
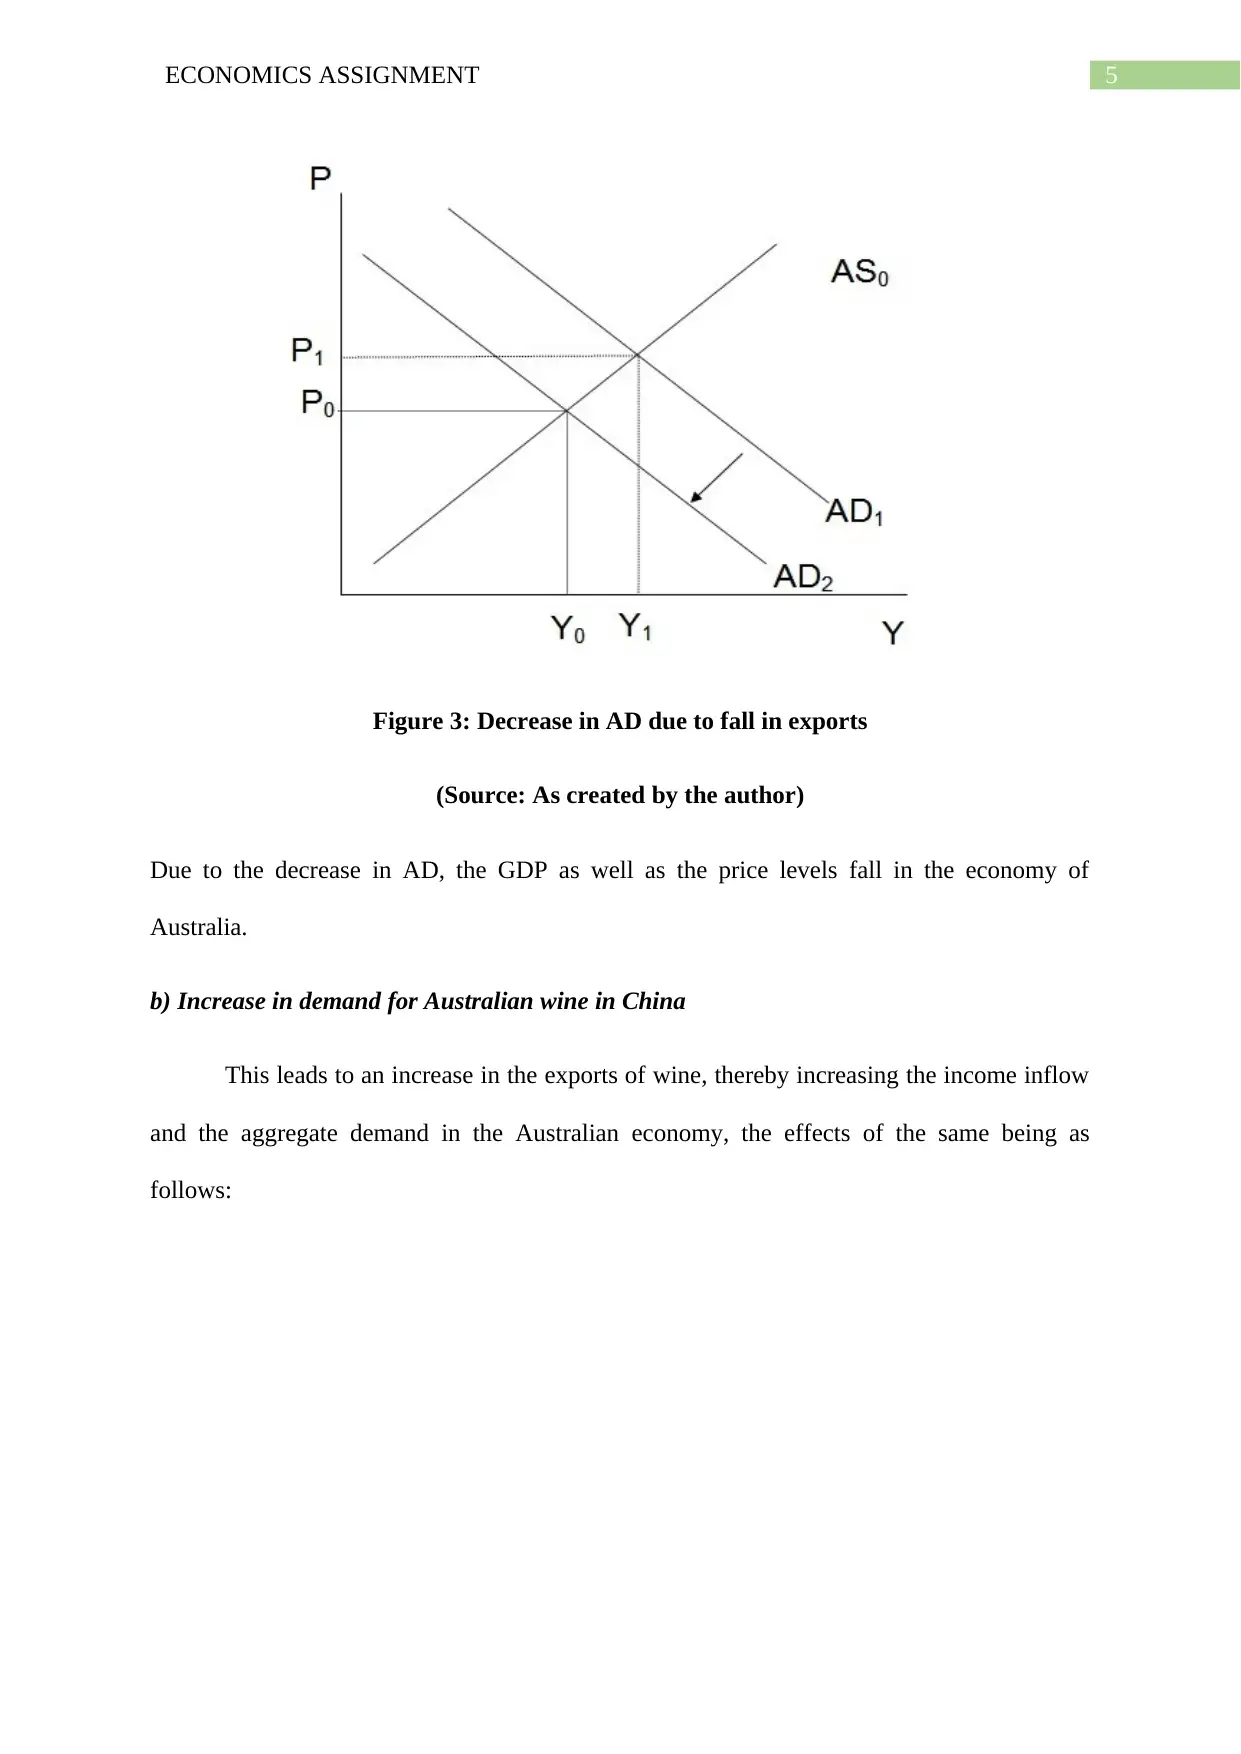
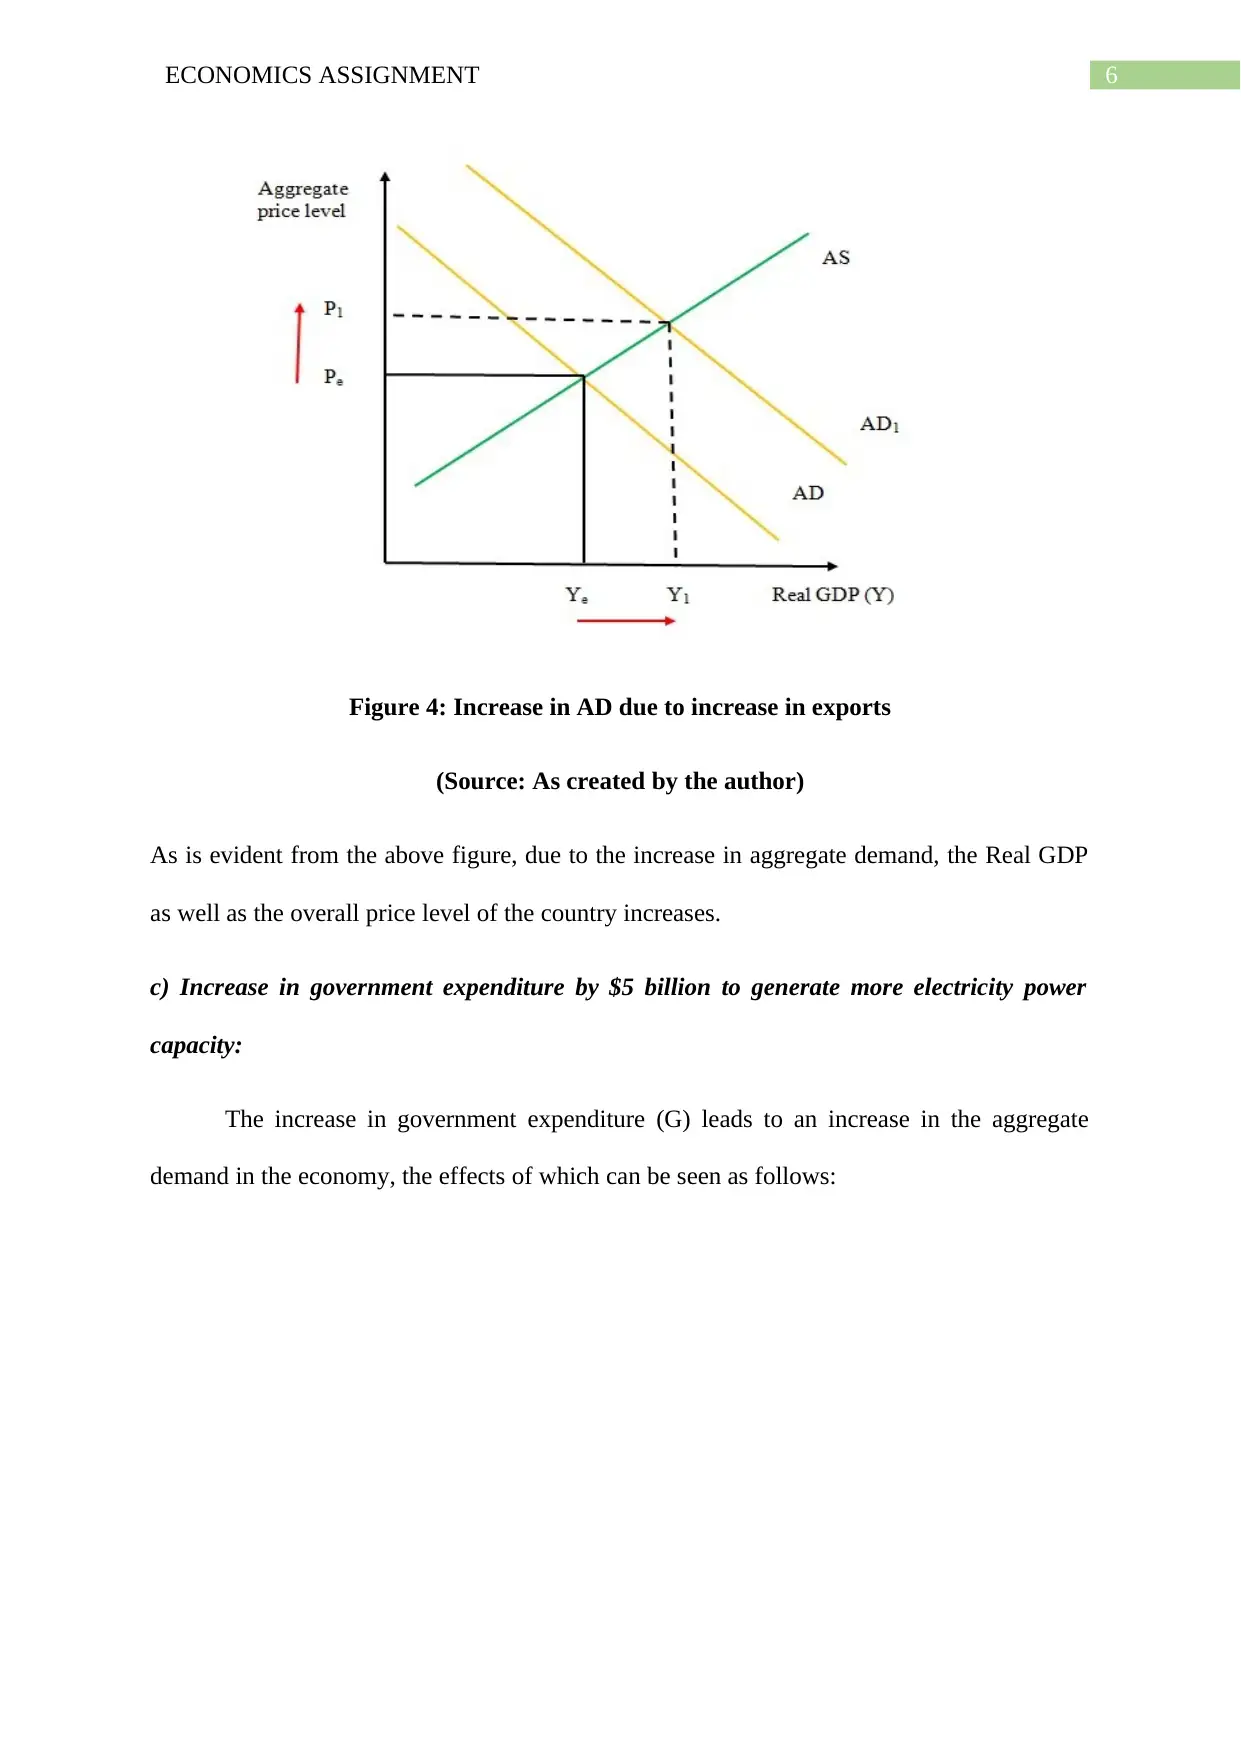
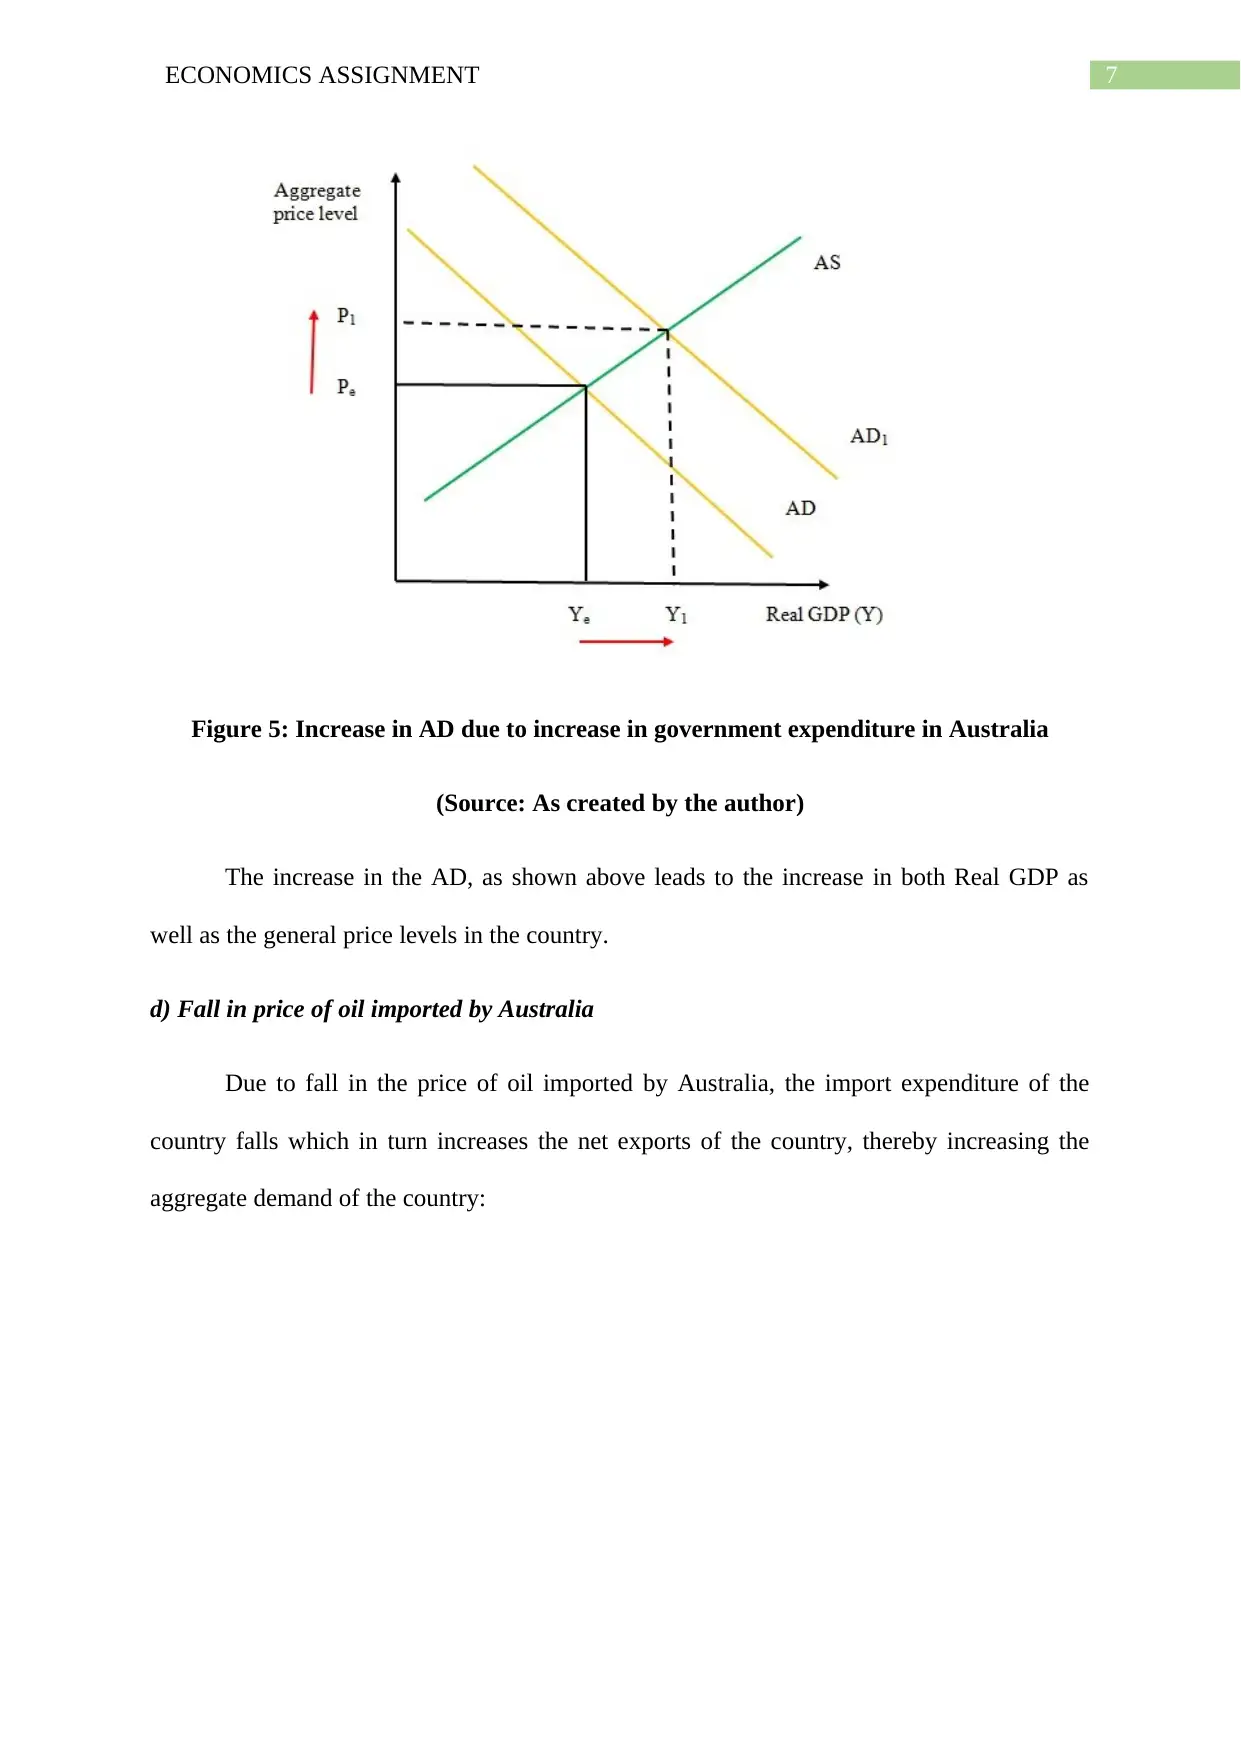
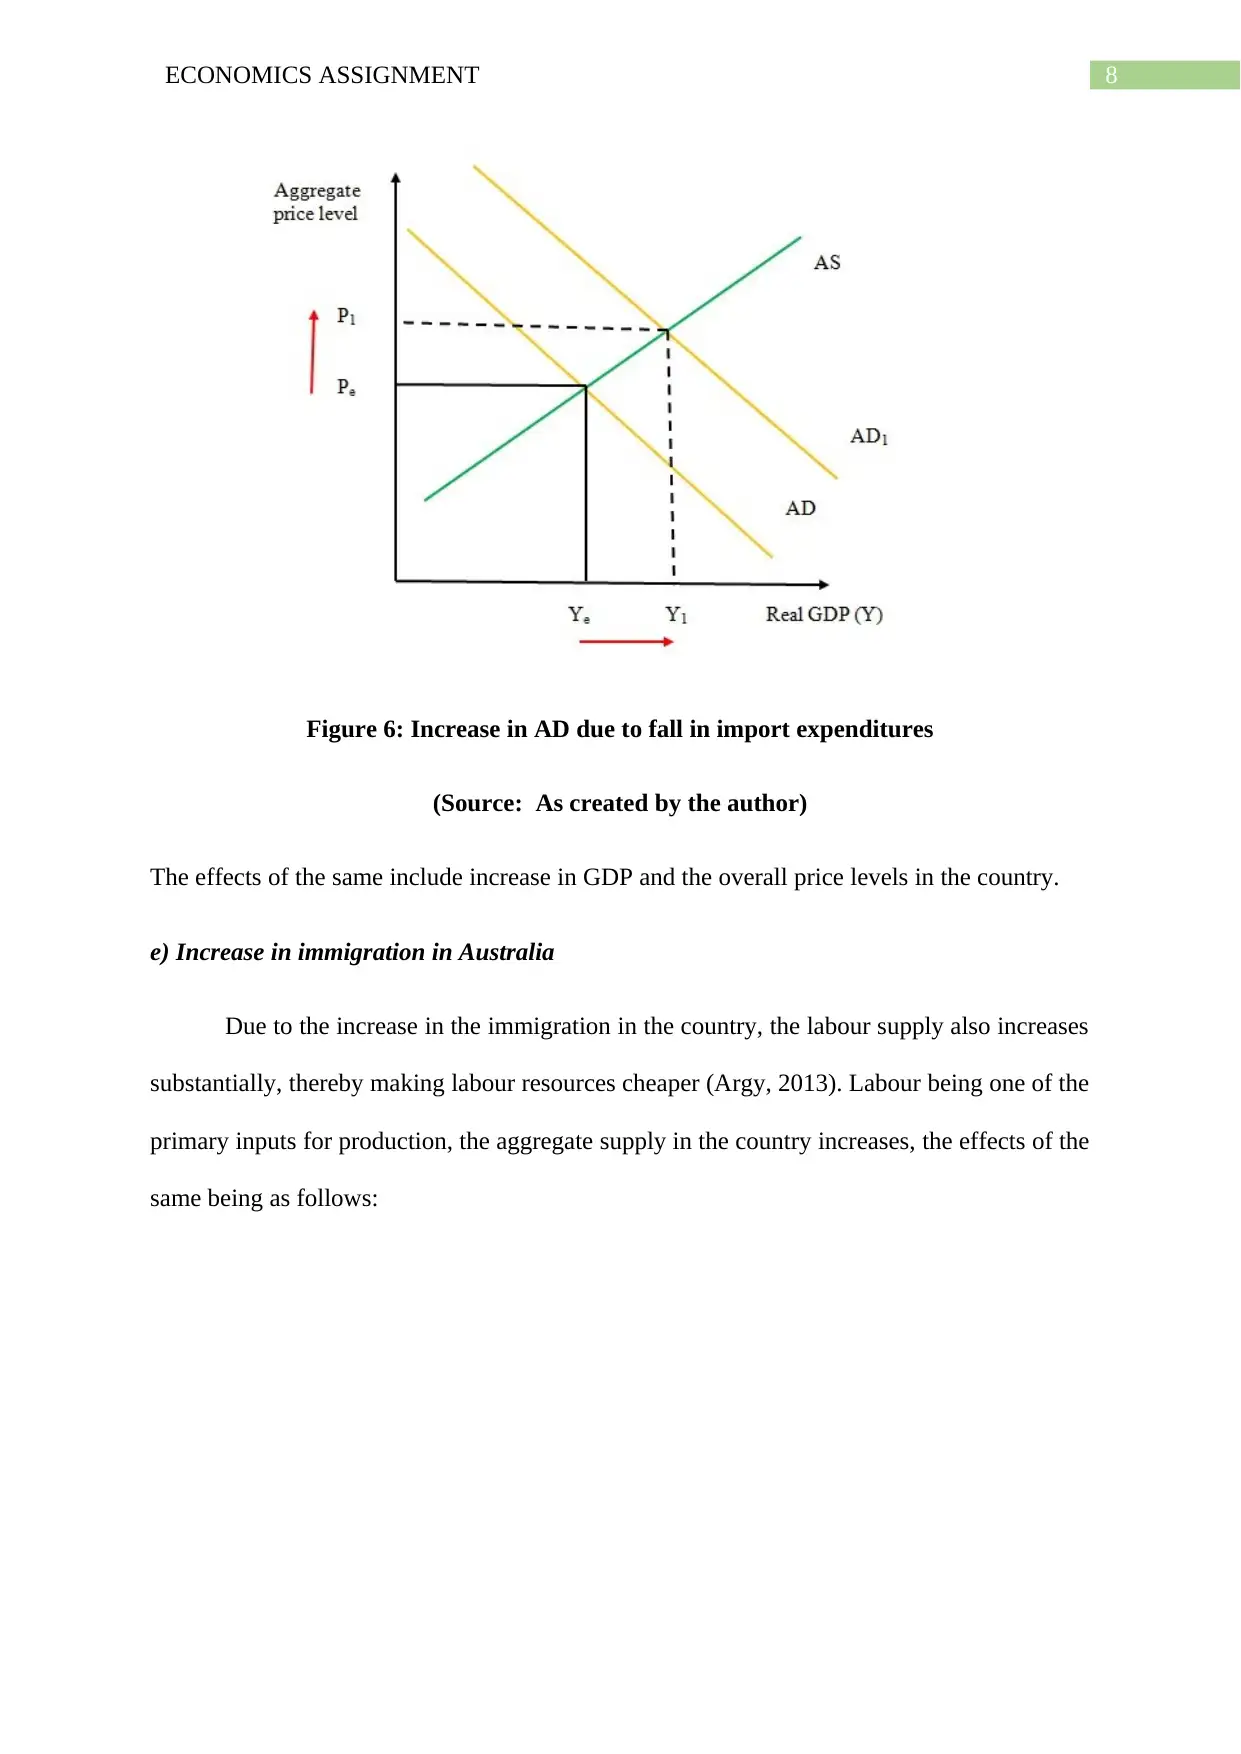
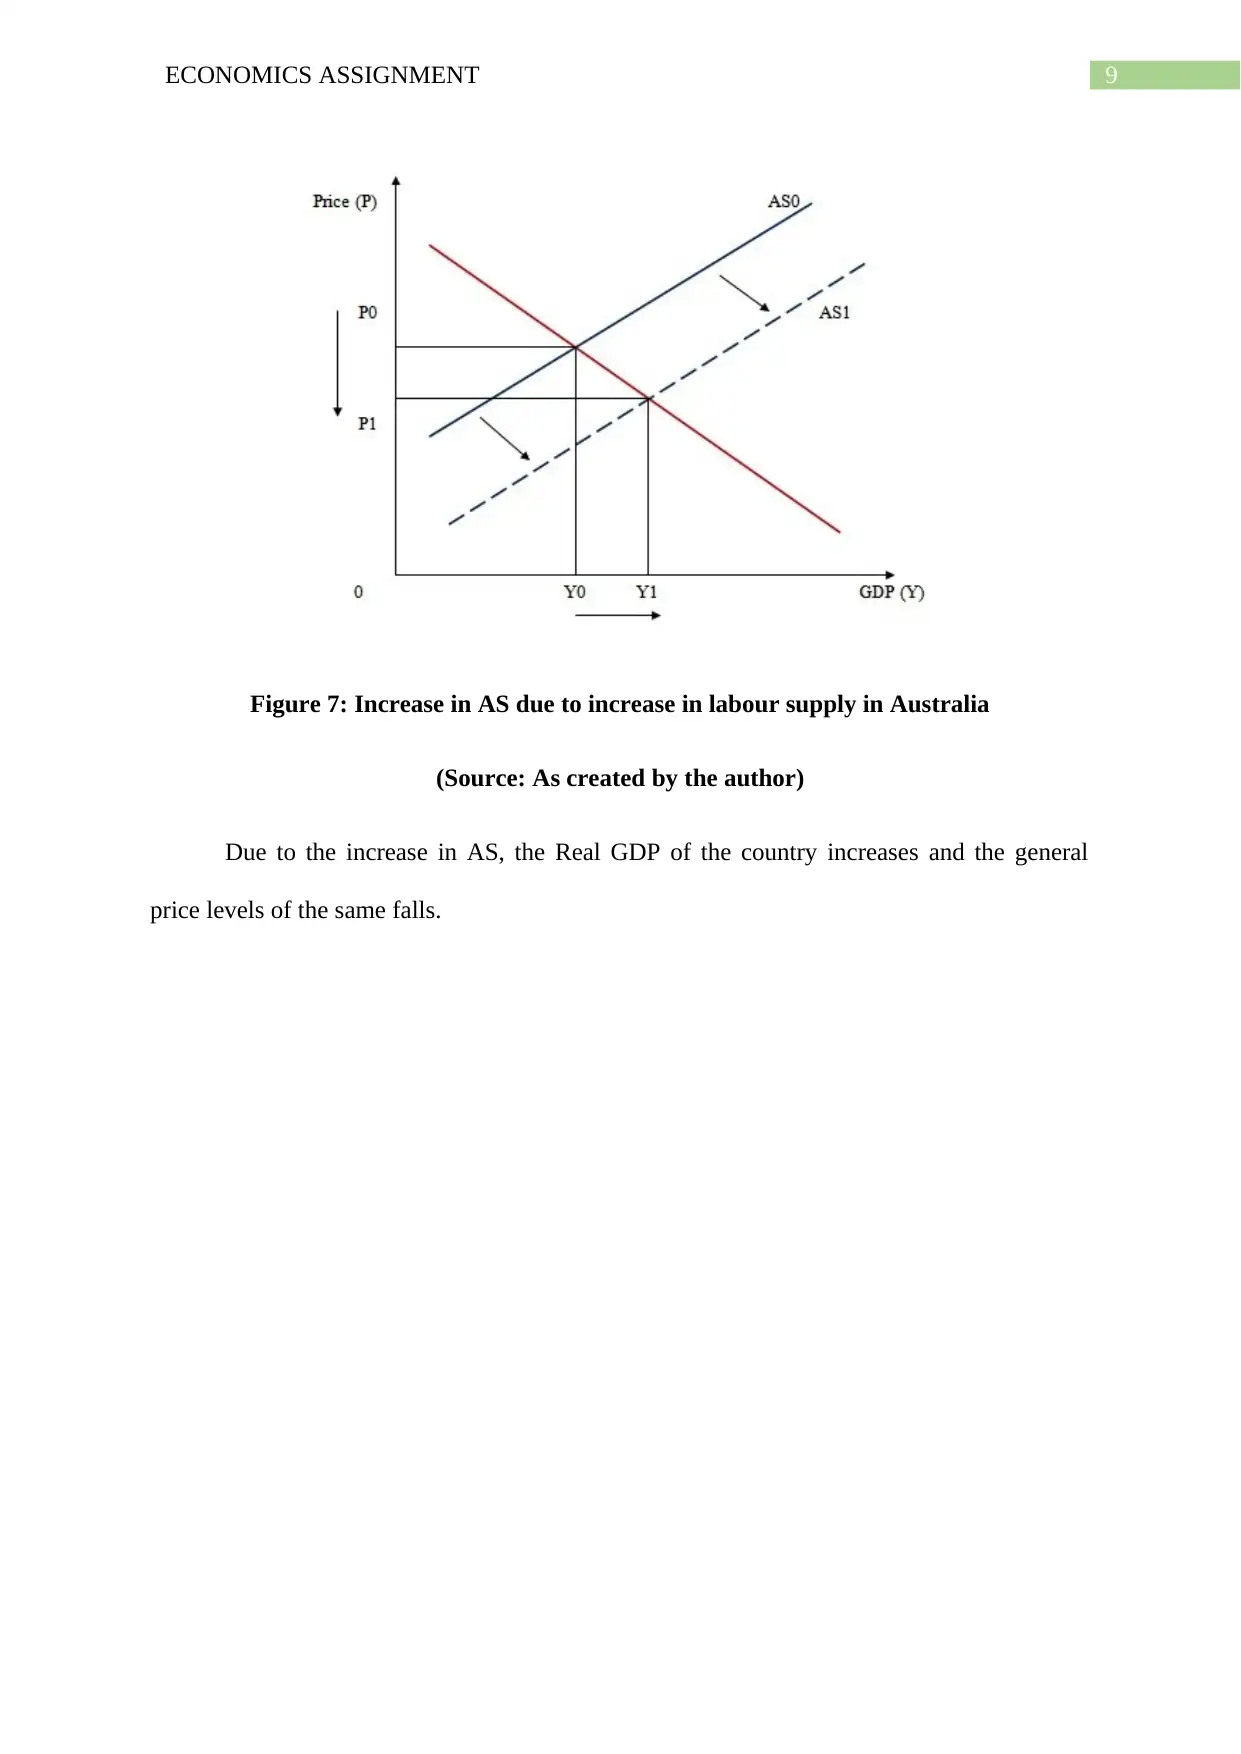
This economics assignment analyzes the performance of the Australian economy from 2001 to 2016, focusing on the relationship between inflation and unemployment, and the application of the Phillips Curve. The assignment further explores the aggregate demand and supply (AD-AS) model, examining the effects of various economic phenomena on GDP and price levels in Australia. These phenomena include the imposition of tariffs, changes in export demand, government expenditure, import prices, and immigration. The analysis utilizes graphical representations to illustrate the impacts of these factors on the Australian economy, offering a comprehensive understanding of macroeconomic principles and their practical application.
Document Page
Running head: ECONOMICS ASSIGNMENT
Economics Assignment
Name of the Student
Name of the University
Author Note
tabler-icon-diamond-filled.svg

Paraphrase This Document

Need a fresh take? Get an instant paraphrase of this document with our AI Paraphraser
Document Page
1ECONOMICS ASSIGNMENT
Table of Contents
Answer 1....................................................................................................................................2
Answer 2....................................................................................................................................4
References................................................................................................................................10
Document Page
2ECONOMICS ASSIGNMENT
Answer 1
The performance of an economy is determined by the dynamics in the different
economic indicators of the economy with time. The primary indicators for analysing and
interpreting the performance of the economy of a country are the GDP growth rate, the rate of
inflation, unemployment rate and others. While the rate of inflation shows the increase in the
average level of price of commodities and services in a country over time, the rate of
unemployment measures the dynamics in the labour market and the changes in the number of
eligible yet unemployed people in a country within a particular period (Burda & Wyplosz,
2013).
In this context, the relationship between the inflation rate and the unemployment rate
of Australia, in the time span of 2001 and 2016, can be seen to be as follows:
4 4.5 5 5.5 6 6.5 7
0
0.5
1
1.5
2
2.5
3
3.5
4
4.5
5
Inflation Rate and Unemployment Rate
Unemployment Rate
Inflation rate
Figure 1: Relationship between inflation rate and rate of unemployment in Australia
(2001-2016)
(Source: Abs.gov.au, 2018)
Document Page
3ECONOMICS ASSIGNMENT
As is evident from the above figure, there roughly exists an inverse relationship
between the inflation rate and unemployment rate in the country, with the unemployment rate
decreasing with an increase in inflation rate and vice versa. This can be found to be in
accordance to the theory of Phillip’s Curve, which also asserts the inverse relationship
between these two variables:
Figure 2: Phillip’s Curve
(Source: Mankiw, 2014)
This implies that with the decrease in the unemployment, the economic abundance of
people increases which in turn increases the aggregate demand in the economy, thereby
increasing the overall price levels indicating towards the increase in the inflation rate in the
economy, as is evident from the empirical evidences of Australia (Heijdra, 2017).
tabler-icon-diamond-filled.svg

Paraphrase This Document

Need a fresh take? Get an instant paraphrase of this document with our AI Paraphraser
Document Page
4ECONOMICS ASSIGNMENT
Answer 2
The aggregate demand and supply model shows the dynamics in the total demand and
supply dynamics in the economy as a whole, thereby determining the dynamics in the Real
GDP and the price levels in the country. The aggregate demand is composed of the following
components:
AD = C+I+G+(X-M), where C is the consumption expenditure, G is the expenditure
of government, I is the investment expenditure and (X-M) is the net export of the country. On
the other hand, the aggregate supply in the economy is measured by the total production or
output of the concerned economy in a particular period and is denoted by (Y) (Carlin &
Soskice, 2014).
Keeping this into consideration, the effects on GDP and price levels in the Australian
economy due to the different phenomena can be explained with the help of the AS-AS
Model, which is as follows:
a) Imposition of 30% tariff by India on chickpea exports by Australia
Due to the decrease in exports, the income inflow from exports decreases, which in
turn decreases the aggregate demand in the country:
Document Page
5ECONOMICS ASSIGNMENT
Figure 3: Decrease in AD due to fall in exports
(Source: As created by the author)
Due to the decrease in AD, the GDP as well as the price levels fall in the economy of
Australia.
b) Increase in demand for Australian wine in China
This leads to an increase in the exports of wine, thereby increasing the income inflow
and the aggregate demand in the Australian economy, the effects of the same being as
follows:
Document Page
6ECONOMICS ASSIGNMENT
Figure 4: Increase in AD due to increase in exports
(Source: As created by the author)
As is evident from the above figure, due to the increase in aggregate demand, the Real GDP
as well as the overall price level of the country increases.
c) Increase in government expenditure by $5 billion to generate more electricity power
capacity:
The increase in government expenditure (G) leads to an increase in the aggregate
demand in the economy, the effects of which can be seen as follows:
tabler-icon-diamond-filled.svg

Paraphrase This Document

Need a fresh take? Get an instant paraphrase of this document with our AI Paraphraser
Document Page
7ECONOMICS ASSIGNMENT
Figure 5: Increase in AD due to increase in government expenditure in Australia
(Source: As created by the author)
The increase in the AD, as shown above leads to the increase in both Real GDP as
well as the general price levels in the country.
d) Fall in price of oil imported by Australia
Due to fall in the price of oil imported by Australia, the import expenditure of the
country falls which in turn increases the net exports of the country, thereby increasing the
aggregate demand of the country:
Document Page
8ECONOMICS ASSIGNMENT
Figure 6: Increase in AD due to fall in import expenditures
(Source: As created by the author)
The effects of the same include increase in GDP and the overall price levels in the country.
e) Increase in immigration in Australia
Due to the increase in the immigration in the country, the labour supply also increases
substantially, thereby making labour resources cheaper (Argy, 2013). Labour being one of the
primary inputs for production, the aggregate supply in the country increases, the effects of the
same being as follows:
Document Page
9ECONOMICS ASSIGNMENT
Figure 7: Increase in AS due to increase in labour supply in Australia
(Source: As created by the author)
Due to the increase in AS, the Real GDP of the country increases and the general
price levels of the same falls.
tabler-icon-diamond-filled.svg

Paraphrase This Document

Need a fresh take? Get an instant paraphrase of this document with our AI Paraphraser
Document Page
10ECONOMICS ASSIGNMENT
References
Abs.gov.au. (2018). 6401.0 - Consumer Price Index, Australia, Mar 2018. Retrieved from
http://www.abs.gov.au/AUSSTATS/abs@.nsf/DetailsPage/6401.0Mar%202018?
OpenDocument
Argy, V., 2013. International macroeconomics: theory and policy. Routledge.
Burda, M., & Wyplosz, C. (2013). Macroeconomics: a European text. Oxford university
press.
Carlin, W., & Soskice, D. W. (2014). Macroeconomics: Institutions, instability, and the
financial system. Oxford University Press, USA.
Heijdra, B. J. (2017). Foundations of modern macroeconomics. Oxford university press.
Mankiw, N. G. (2014). Principles of macroeconomics. Cengage Learning.
chevron_up_icon
1 out of 11
circle_padding
hide_on_mobile
zoom_out_icon
[object Object]