Demand and Supply Analysis: A Case Study of Asda (BM533)
VerifiedAdded on 2023/01/13
|13
|3390
|64
Report
AI Summary
This report delves into the economic principles of demand and supply, using Asda as a case study to illustrate market dynamics. It examines the law of demand, analyzing movements along and shifts in the demand curve, considering factors like income, related goods, and consumer preferences. Similarly, the report explores the law of supply, detailing the relationship between price and quantity supplied, along with movements and shifts in the supply curve influenced by factors such as input costs, the number of sellers, technology, and external factors. The analysis incorporates real-world examples, such as the impact of Brexit and technological advancements, to provide a comprehensive understanding of how these forces shape Asda's business operations. The report also compares various economic theories and models relevant to the retail sector.
BM533 CONTEMPORARY
BUSINESS ECONOMICS
BUSINESS ECONOMICS
Paraphrase This Document
Need a fresh take? Get an instant paraphrase of this document with our AI Paraphraser
Table of Contents
INTRODUCTION
Economics can be termed as the filed through which the production or consumption and
lastly distribution of economic wealth in an economy is evaluated and measured (Marwala and
Hurwitz, 2017). The current report will undertake research on the demand and supply market
forces and evaluate it in context of Asda. Asda is an multinational retail store operating in UK
and in this report, the concept of the movement and shift in the demand and supply factors will
be evaluated on the company. The report further will also evaluate the various economic theories
and models that have been prevalent, and make a comparison of these theories.
MAIN BODY
TASK 1
Demand curve, Its movement and shift due to change in factors800
Demand is one of the major market force that governs or regulates the entire market. Law
of demand portrays the relationship that exists between the price of a particular commodity with
respect to its quantity demanded in the market at any given point of time. The relationship shared
between price of product and its respective quantity demanded is negative or inverse, i.e. with
the increase in the price of the product, consequently the demand for that product tends to
decrease at a given point of time and in case the price of the product falls, its demand
simultaneously rises. This can be seen in the buying tendency of the consumers at Asda where
the increase in the prices of the products leads to the decreased number of customers choosing to
buy products in Asda (Yoshii, 2017). The reason behind this inverse relations lies ion the
concept of diminishing marginal utility that states that customers satisfy their ardent needs first
and each successive unit is consumed only to satisfy the lower valued needs.
The demand curve is always downward sloping because of its inverse relationship with
the price and depicts the aggregate demand of all the consumers in the market of a commodity at
a given point of time.
⊘ This is a preview!⊘
Do you want full access?
Subscribe today to unlock all pages.
Trusted by 1+ million students worldwide
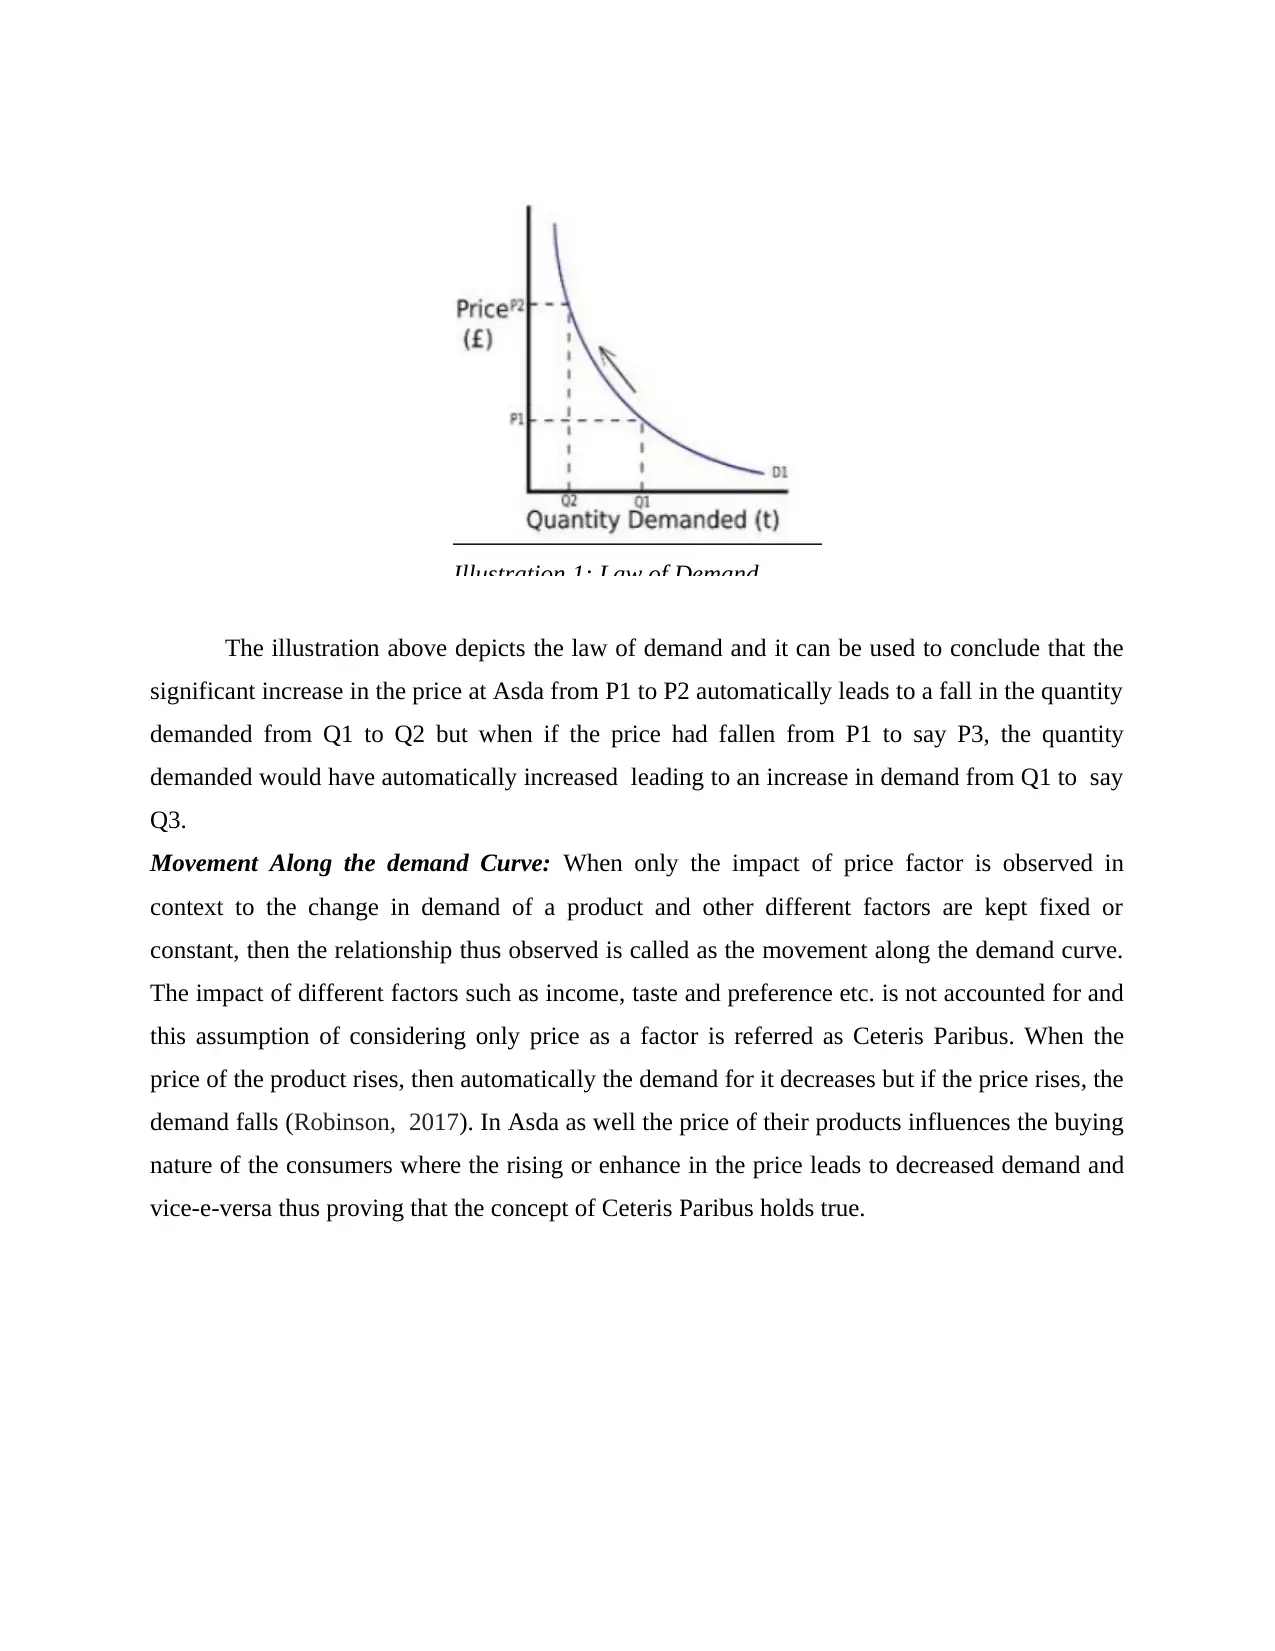
The illustration above depicts the law of demand and it can be used to conclude that the
significant increase in the price at Asda from P1 to P2 automatically leads to a fall in the quantity
demanded from Q1 to Q2 but when if the price had fallen from P1 to say P3, the quantity
demanded would have automatically increased leading to an increase in demand from Q1 to say
Q3.
Movement Along the demand Curve: When only the impact of price factor is observed in
context to the change in demand of a product and other different factors are kept fixed or
constant, then the relationship thus observed is called as the movement along the demand curve.
The impact of different factors such as income, taste and preference etc. is not accounted for and
this assumption of considering only price as a factor is referred as Ceteris Paribus. When the
price of the product rises, then automatically the demand for it decreases but if the price rises, the
demand falls (Robinson, 2017). In Asda as well the price of their products influences the buying
nature of the consumers where the rising or enhance in the price leads to decreased demand and
vice-e-versa thus proving that the concept of Ceteris Paribus holds true.
Illustration 1: Law of Demand
Paraphrase This Document
Need a fresh take? Get an instant paraphrase of this document with our AI Paraphraser
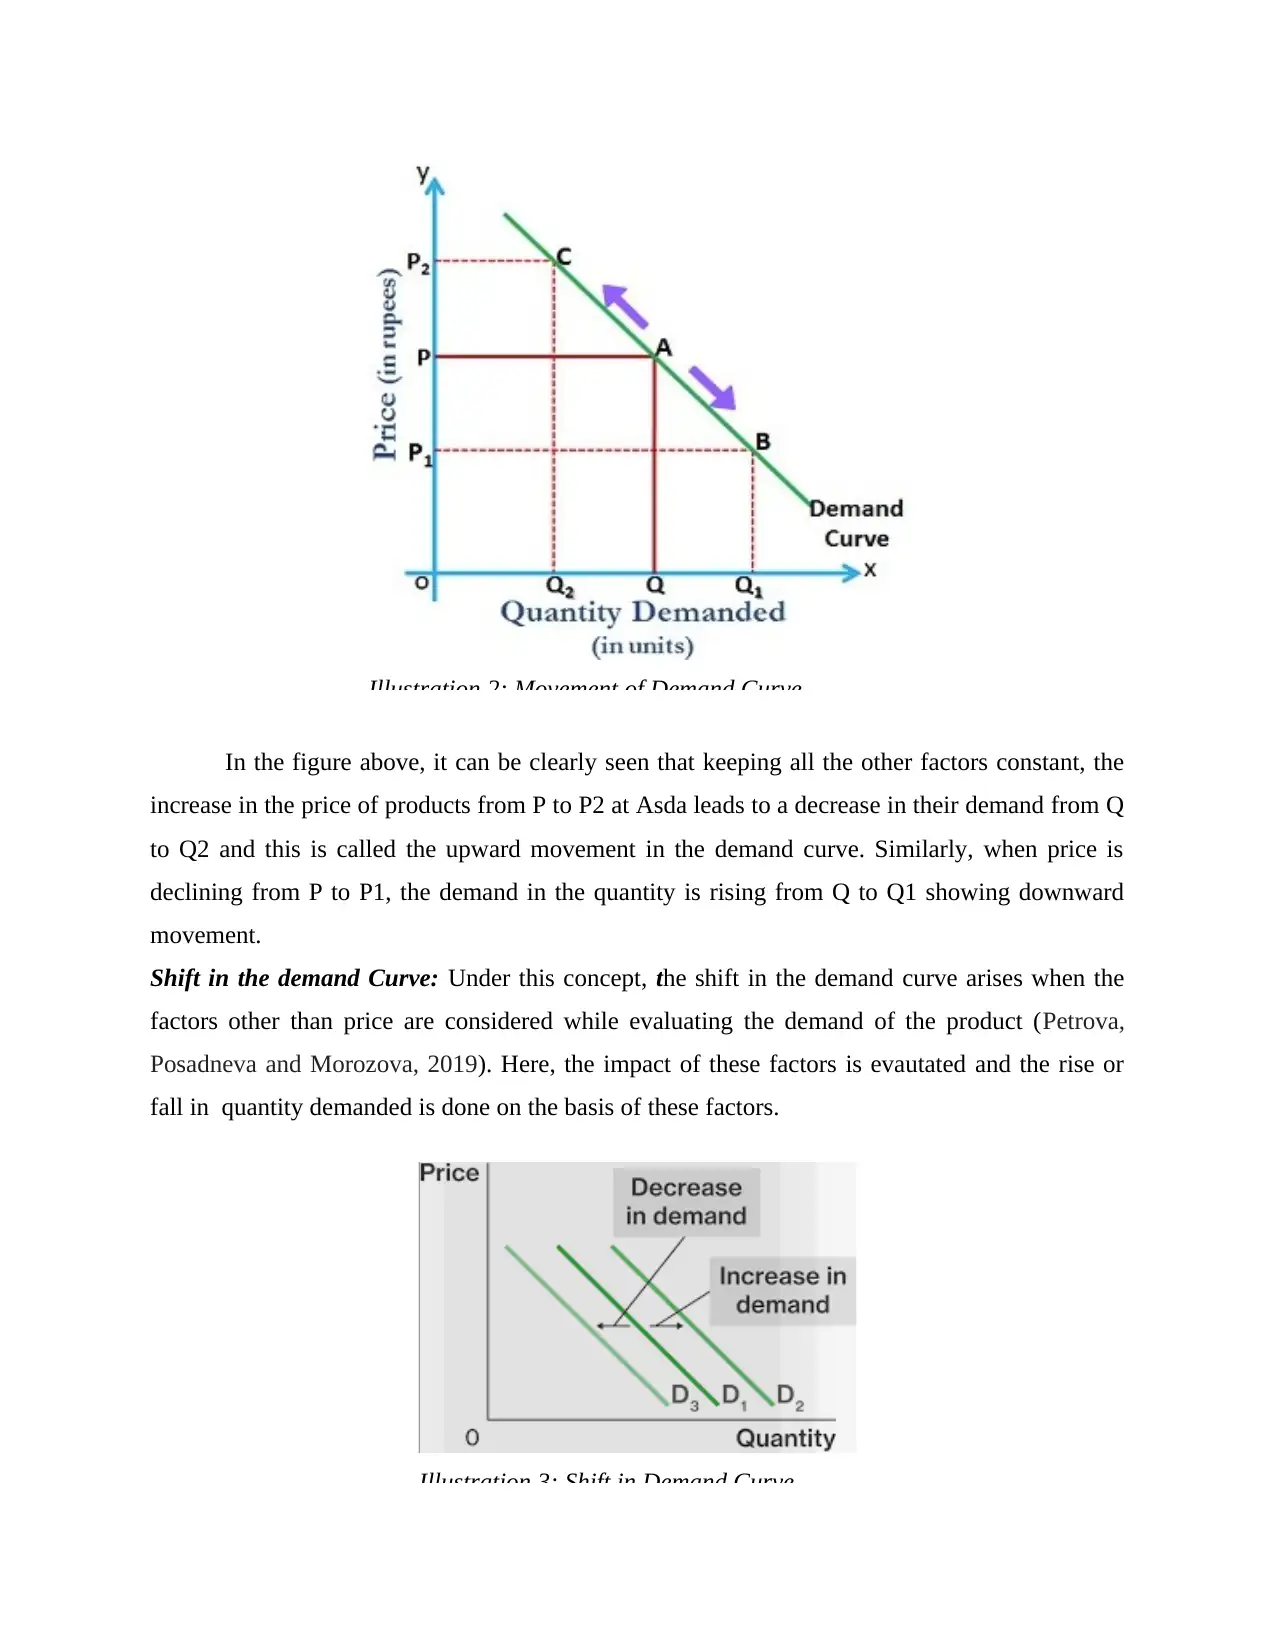
In the figure above, it can be clearly seen that keeping all the other factors constant, the
increase in the price of products from P to P2 at Asda leads to a decrease in their demand from Q
to Q2 and this is called the upward movement in the demand curve. Similarly, when price is
declining from P to P1, the demand in the quantity is rising from Q to Q1 showing downward
movement.
Shift in the demand Curve: Under this concept, the shift in the demand curve arises when the
factors other than price are considered while evaluating the demand of the product (Petrova,
Posadneva and Morozova, 2019). Here, the impact of these factors is evautated and the rise or
fall in quantity demanded is done on the basis of these factors.
Illustration 2: Movement of Demand Curve
Illustration 3: Shift in Demand Curve
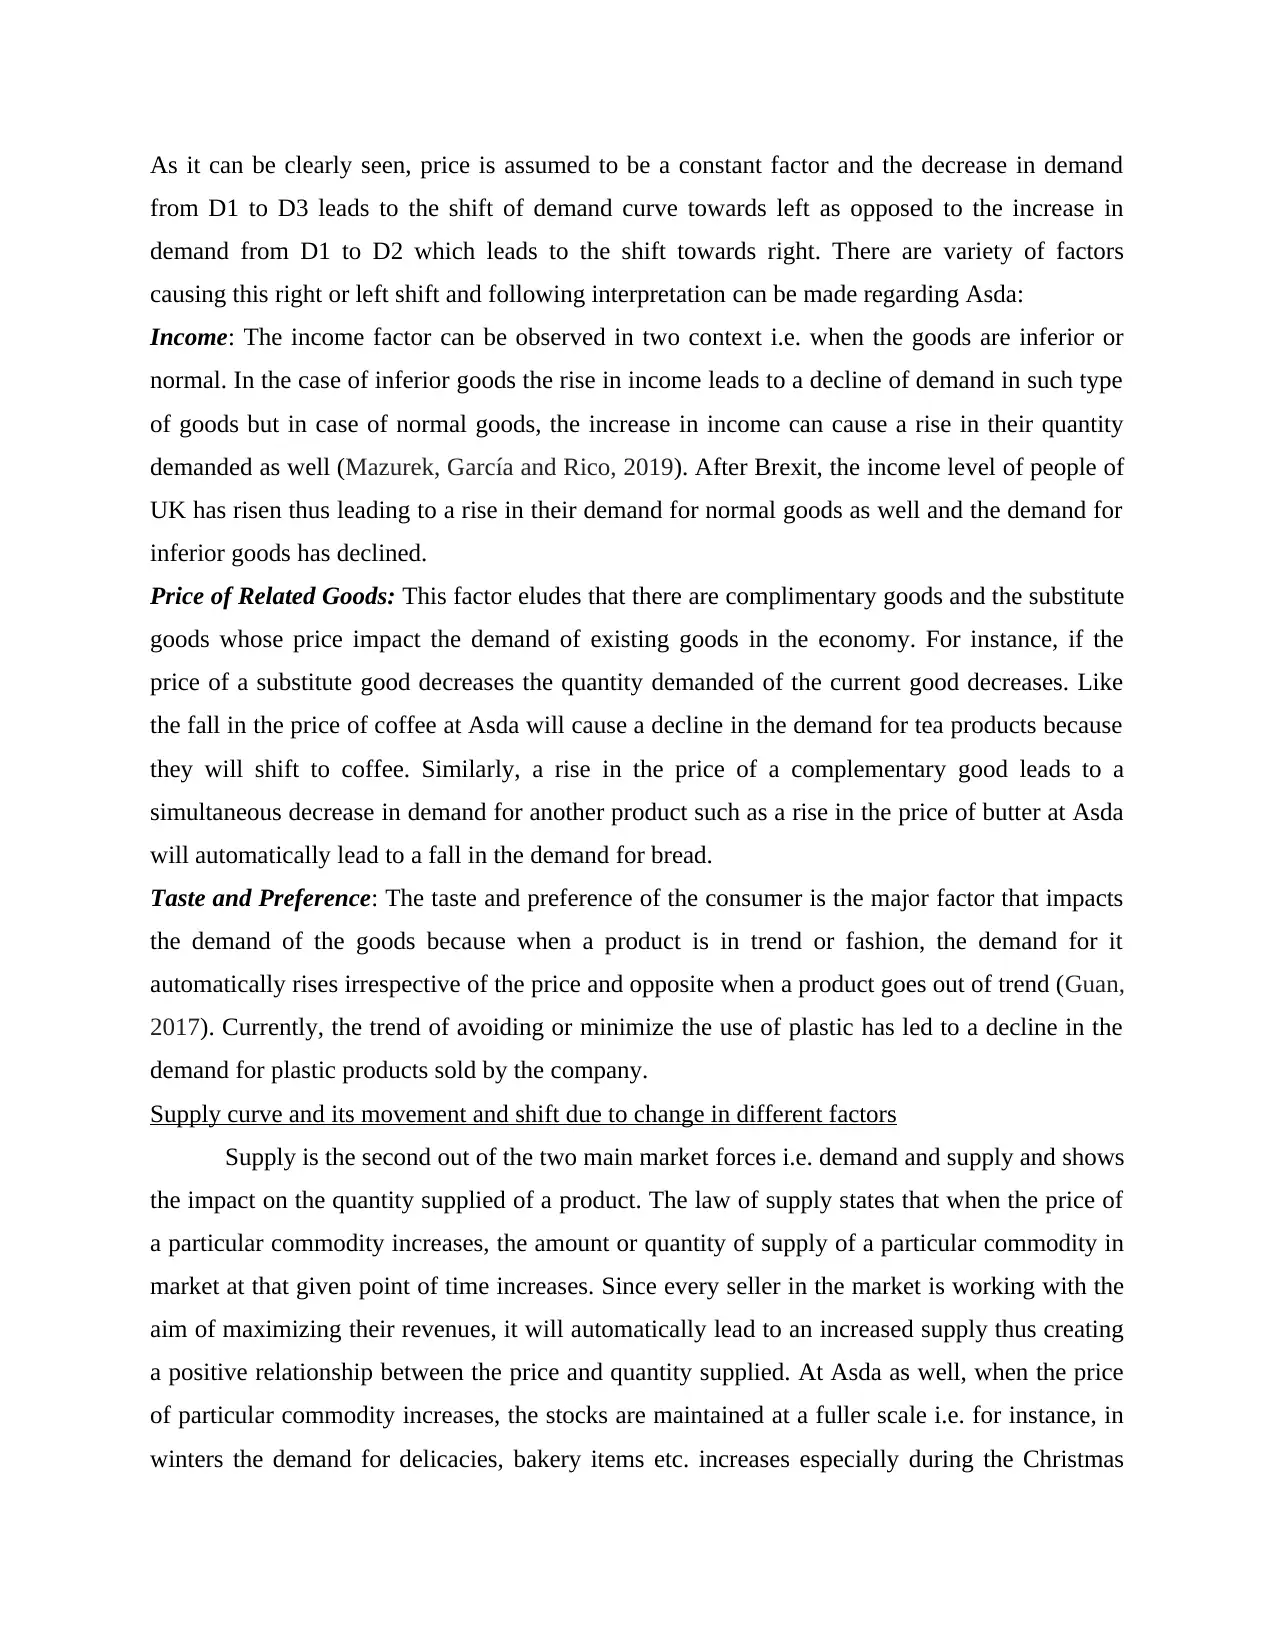
As it can be clearly seen, price is assumed to be a constant factor and the decrease in demand
from D1 to D3 leads to the shift of demand curve towards left as opposed to the increase in
demand from D1 to D2 which leads to the shift towards right. There are variety of factors
causing this right or left shift and following interpretation can be made regarding Asda:
Income: The income factor can be observed in two context i.e. when the goods are inferior or
normal. In the case of inferior goods the rise in income leads to a decline of demand in such type
of goods but in case of normal goods, the increase in income can cause a rise in their quantity
demanded as well (Mazurek, García and Rico, 2019). After Brexit, the income level of people of
UK has risen thus leading to a rise in their demand for normal goods as well and the demand for
inferior goods has declined.
Price of Related Goods: This factor eludes that there are complimentary goods and the substitute
goods whose price impact the demand of existing goods in the economy. For instance, if the
price of a substitute good decreases the quantity demanded of the current good decreases. Like
the fall in the price of coffee at Asda will cause a decline in the demand for tea products because
they will shift to coffee. Similarly, a rise in the price of a complementary good leads to a
simultaneous decrease in demand for another product such as a rise in the price of butter at Asda
will automatically lead to a fall in the demand for bread.
Taste and Preference: The taste and preference of the consumer is the major factor that impacts
the demand of the goods because when a product is in trend or fashion, the demand for it
automatically rises irrespective of the price and opposite when a product goes out of trend (Guan,
2017). Currently, the trend of avoiding or minimize the use of plastic has led to a decline in the
demand for plastic products sold by the company.
Supply curve and its movement and shift due to change in different factors
Supply is the second out of the two main market forces i.e. demand and supply and shows
the impact on the quantity supplied of a product. The law of supply states that when the price of
a particular commodity increases, the amount or quantity of supply of a particular commodity in
market at that given point of time increases. Since every seller in the market is working with the
aim of maximizing their revenues, it will automatically lead to an increased supply thus creating
a positive relationship between the price and quantity supplied. At Asda as well, when the price
of particular commodity increases, the stocks are maintained at a fuller scale i.e. for instance, in
winters the demand for delicacies, bakery items etc. increases especially during the Christmas
⊘ This is a preview!⊘
Do you want full access?
Subscribe today to unlock all pages.
Trusted by 1+ million students worldwide
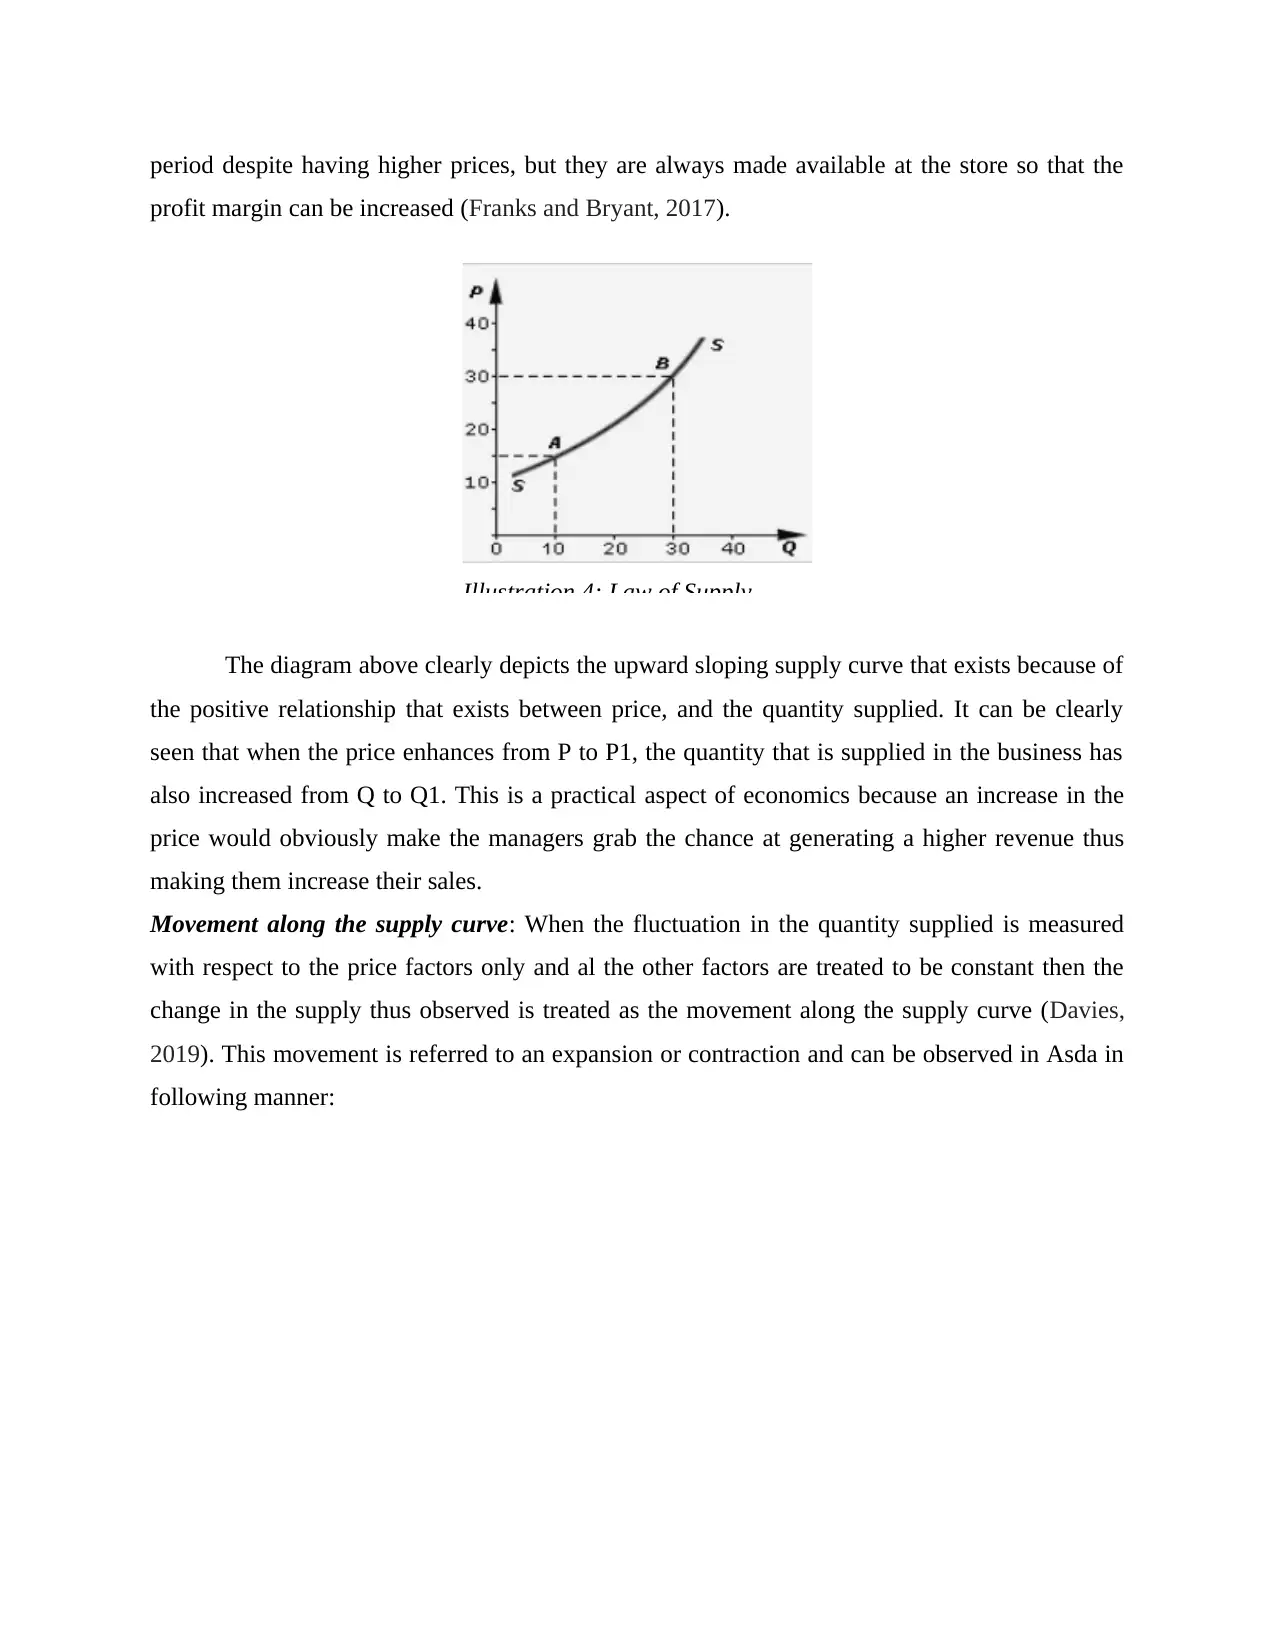
period despite having higher prices, but they are always made available at the store so that the
profit margin can be increased (Franks and Bryant, 2017).
The diagram above clearly depicts the upward sloping supply curve that exists because of
the positive relationship that exists between price, and the quantity supplied. It can be clearly
seen that when the price enhances from P to P1, the quantity that is supplied in the business has
also increased from Q to Q1. This is a practical aspect of economics because an increase in the
price would obviously make the managers grab the chance at generating a higher revenue thus
making them increase their sales.
Movement along the supply curve: When the fluctuation in the quantity supplied is measured
with respect to the price factors only and al the other factors are treated to be constant then the
change in the supply thus observed is treated as the movement along the supply curve (Davies,
2019). This movement is referred to an expansion or contraction and can be observed in Asda in
following manner:
Illustration 4: Law of Supply
Paraphrase This Document
Need a fresh take? Get an instant paraphrase of this document with our AI Paraphraser
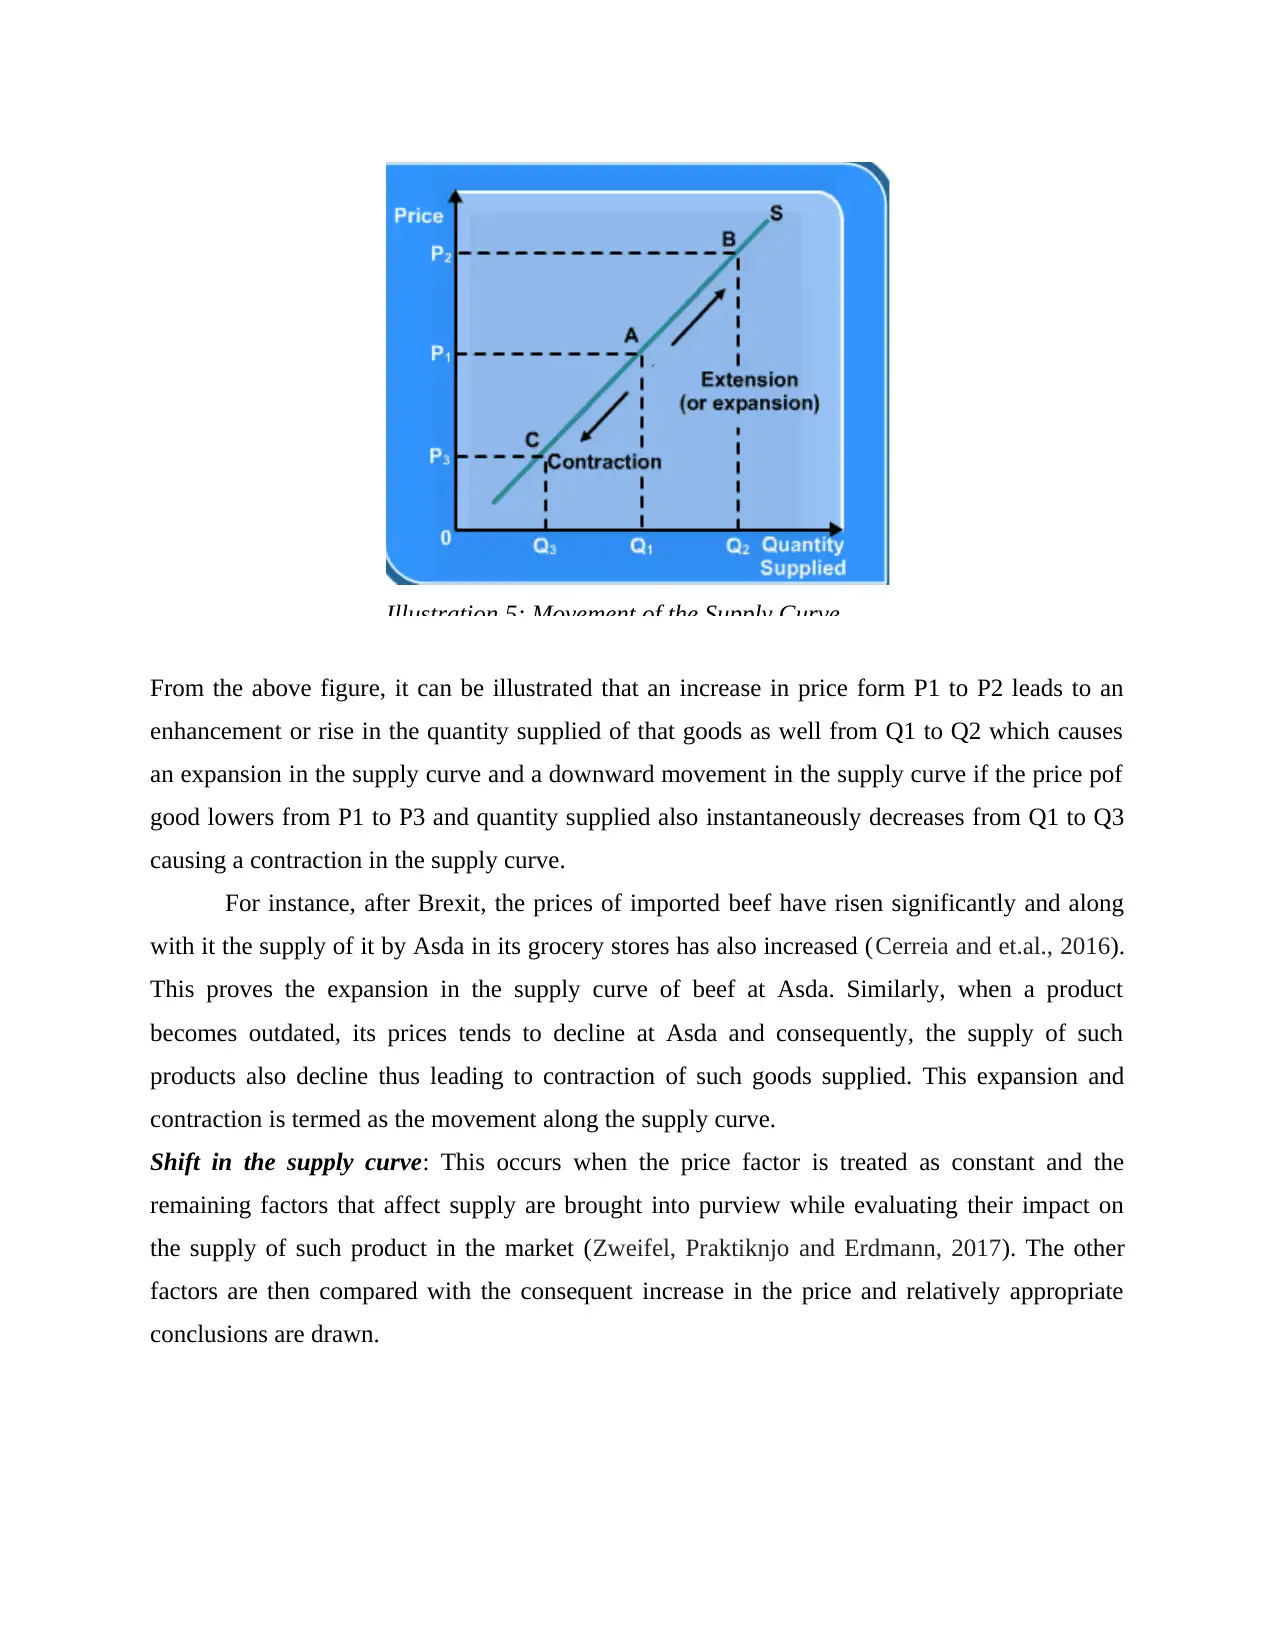
From the above figure, it can be illustrated that an increase in price form P1 to P2 leads to an
enhancement or rise in the quantity supplied of that goods as well from Q1 to Q2 which causes
an expansion in the supply curve and a downward movement in the supply curve if the price pof
good lowers from P1 to P3 and quantity supplied also instantaneously decreases from Q1 to Q3
causing a contraction in the supply curve.
For instance, after Brexit, the prices of imported beef have risen significantly and along
with it the supply of it by Asda in its grocery stores has also increased (Cerreia and et.al., 2016).
This proves the expansion in the supply curve of beef at Asda. Similarly, when a product
becomes outdated, its prices tends to decline at Asda and consequently, the supply of such
products also decline thus leading to contraction of such goods supplied. This expansion and
contraction is termed as the movement along the supply curve.
Shift in the supply curve: This occurs when the price factor is treated as constant and the
remaining factors that affect supply are brought into purview while evaluating their impact on
the supply of such product in the market (Zweifel, Praktiknjo and Erdmann, 2017). The other
factors are then compared with the consequent increase in the price and relatively appropriate
conclusions are drawn.
Illustration 5: Movement of the Supply Curve
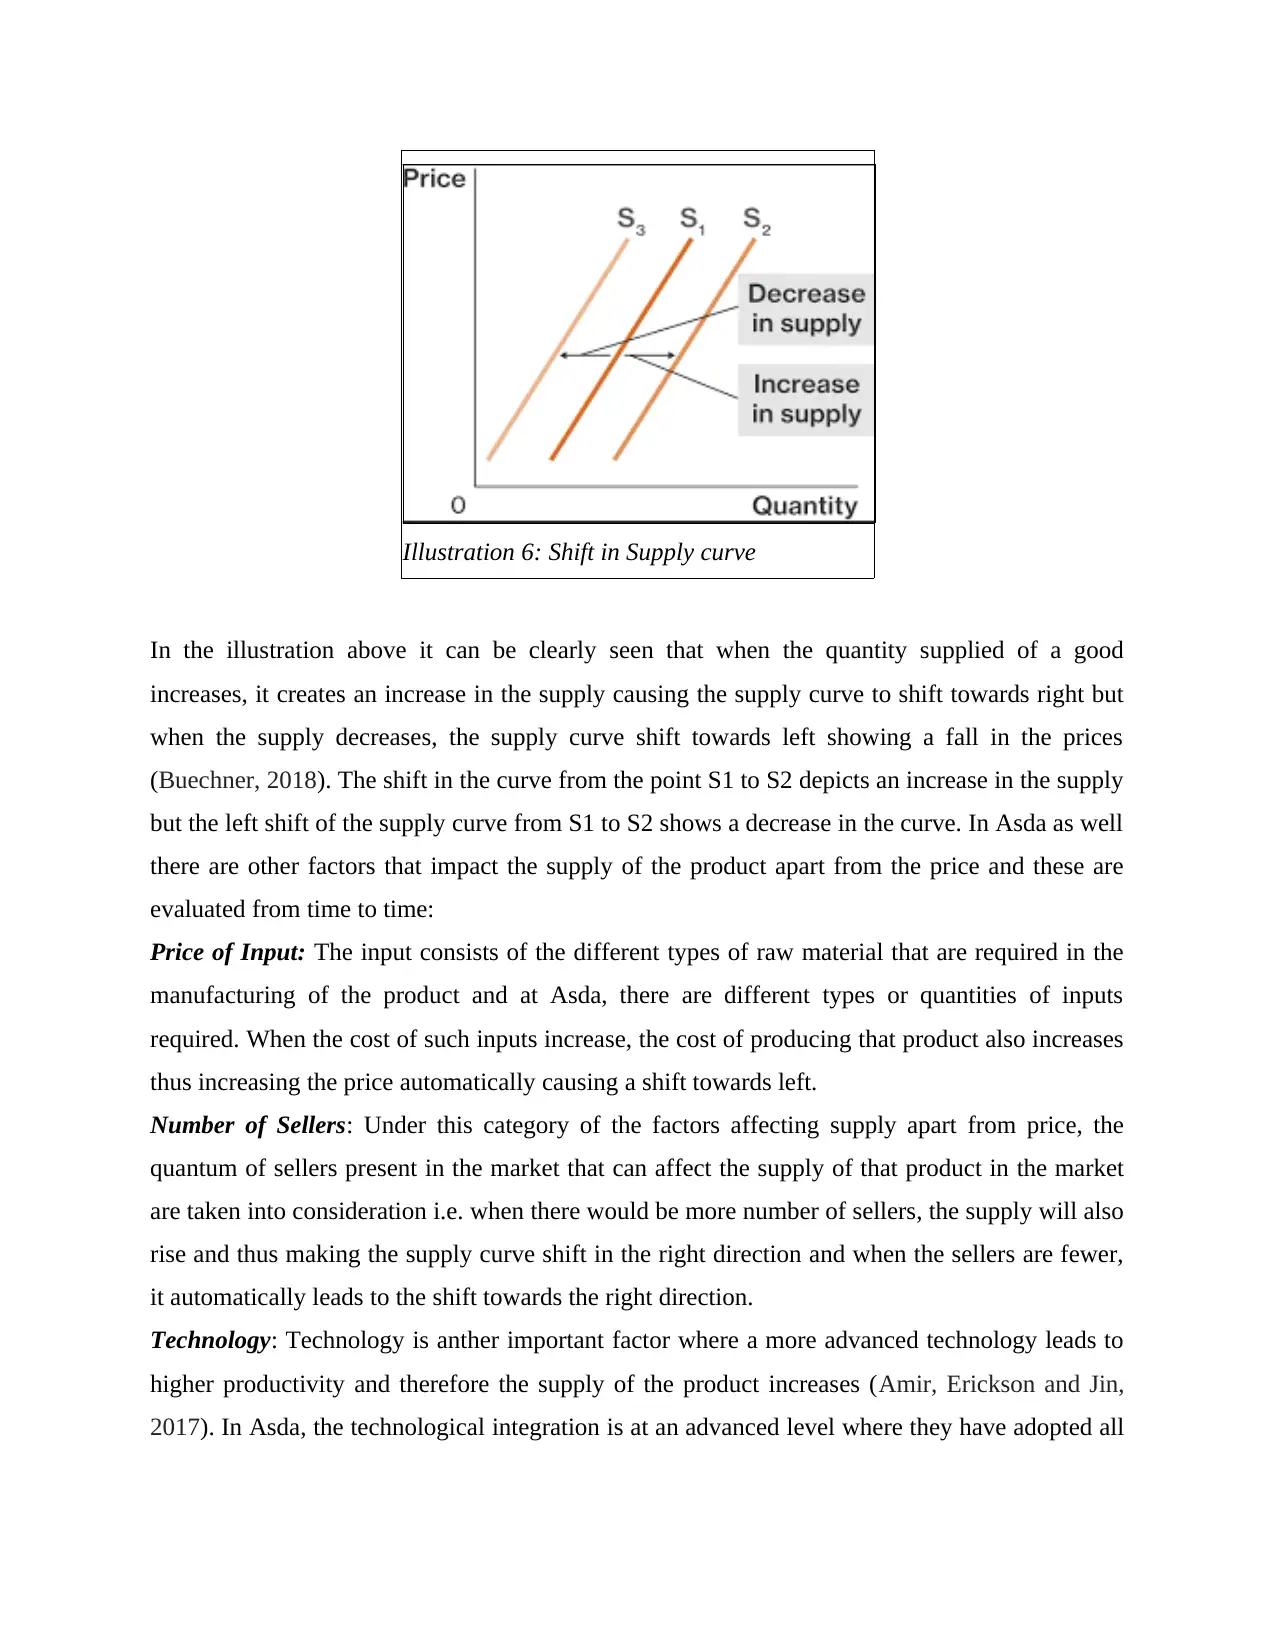
In the illustration above it can be clearly seen that when the quantity supplied of a good
increases, it creates an increase in the supply causing the supply curve to shift towards right but
when the supply decreases, the supply curve shift towards left showing a fall in the prices
(Buechner, 2018). The shift in the curve from the point S1 to S2 depicts an increase in the supply
but the left shift of the supply curve from S1 to S2 shows a decrease in the curve. In Asda as well
there are other factors that impact the supply of the product apart from the price and these are
evaluated from time to time:
Price of Input: The input consists of the different types of raw material that are required in the
manufacturing of the product and at Asda, there are different types or quantities of inputs
required. When the cost of such inputs increase, the cost of producing that product also increases
thus increasing the price automatically causing a shift towards left.
Number of Sellers: Under this category of the factors affecting supply apart from price, the
quantum of sellers present in the market that can affect the supply of that product in the market
are taken into consideration i.e. when there would be more number of sellers, the supply will also
rise and thus making the supply curve shift in the right direction and when the sellers are fewer,
it automatically leads to the shift towards the right direction.
Technology: Technology is anther important factor where a more advanced technology leads to
higher productivity and therefore the supply of the product increases (Amir, Erickson and Jin,
2017). In Asda, the technological integration is at an advanced level where they have adopted all
Illustration 6: Shift in Supply curve
⊘ This is a preview!⊘
Do you want full access?
Subscribe today to unlock all pages.
Trusted by 1+ million students worldwide
the latest innovations in the retail industry. This has caused enhanced supply in their organization
and therefore, the curve tends to shift towards right.
Natural or social Factors: Natural causes such as droughts, floods, rains etc. and the social
causes such as societal norms etc. often impacts the supply in the market. This can impact the
supply in a positive or negative manner and therefore causes a shift in the supply curve.
Market expectations: the market can be expected to be either bullish trend or bearish trend and
hence, the sellers perceive how the market would be in future and take decisions accordingly
regarding increase or decrease in the supply.
TASK 2
Contrast and comparison of the economic theories
The economists and the theory that have been presented by them have regularly evolved with
time and newer and better concepts have arisen regularly (Rosenblatt, 2018). In the field of
economics, the three major theories that have played a key role in developing the economics that
is prevalent currently:
Keynesian Theory: John Maynard Keynes gave this theory in the 21st century and this theory
highlighted the impact of the Great depression at macro or micro level in an economy. This
theory illustrated that the aggregate spending is directly associated with the inflation in the
economy and after evaluation of the impact of different governmental policies, it was concluded
that the fiscal and monetary policies play an important role in addressing the different issues
prevalent in an economy. It was also argued that a market can never return to its equilibrium
state of equal demand and supply on its own and it was necessary to develop such fiscal and
monetary interventions that would assist in regulating the depression in the economy.
This theory was criticized heavily where the free theorists argued that the market is self-
regulating and demand or supply forces are sufficient to make the economy return to equilibrium
position.
Friedman Theory: Under this theory also called the Monetarism theory, it was developed to
meet the inefficiencies of the Keynesian theory and it was argued that the monetary levers in an
economy should be given more power so that they can regulate the market accordingly
(Makowski, Piotrowski, Sładkowski and Syska, 2017). The equation of MV=PQ was given in
this theory where,
Paraphrase This Document
Need a fresh take? Get an instant paraphrase of this document with our AI Paraphraser
M was the money supply, secondly, V was the velocity of the spending of euro per year, P
denoted the price of goods and services and lastly Q signified the quantity of such goods that
were demanded. It was presented that when the monetary aspect will be more emphasized the
policies such developed would be a better tool and in regulating the market and bringing it back
to the position of equilibrium.
But, when the recession hit again, the economy in the year 2007-08, the incapability of
this theory became cognizant where the need for implementing fiscal measures as well along
with the monetary measured was highlighted and therefore, the heavy criticism of this theory
paved way ultimately for the Fisherian Theory.
Fisherian Theory: The Fisherian theory given by Irving Fisher signified that the inflation level
in an economy can be controlled by the real and nominal interest rate. This was given in the 21st
century and the concept of real interest and nominal interest was illustrated. Real interest rate can
be ascertained by taking current nominal interest rate and then deducting the expected rate of
inflation from such rate (Chu, Huang and Zhou, 2018). This theory claimed that when the rate at
which the inflation in the economy is increasing in an economy is equivalent to the rate at which
the current nominal rate is, then it can be concluded that inflation is rising and real interest rate is
declining in an economy.
This theory was extremely successful and was later developed further into an
International Fisher Effect model that is used while conducting international transaction and
dealing in foreign currency or exchange. It was widely supported and was categorized as an
appropriate solution to regulate and control the movement of market forces in an economy.
CONCLUSION
The facts stated in above report conclude that the two market forces i.e. demand and
supply can be termed as major controllers of the market. The report involved application of the
law of demand law of supply in Asda and how the company gets affected was evaluated and
highlighted in the report. The movement and shift in supply and demand curve was also studied
regarding the Asda company and its applicability was discussed. Lastly, the report made a
comparison between the past and existing economic theories that were prevalent in the market.
REFERENCES
Books and journals
Amir, R., Erickson, P. and Jin, J., 2017. On the microeconomic foundations of linear demand for
differentiated products. Journal of Economic Theory. 169. pp.641-665.
Buechner, M. N., 2018. A comment on the law of supply and demand. Journal of Philosophical
Economics. 11(2). pp.67-80.
Cerreia, S and et.al., 2016. Law of Demand and Forced Choice.
Chu, C.N., Huang, T.Y. and Zhou, W., 2018, June. The Pricier the Merrier: How the Law of
Demand Informs Value-Based Pricing: An Abstract. In Academy of Marketing Science
World Marketing Congress (pp. 909-909). Springer, Cham.
Davies, R. E., 2019. Laws of Demand and Supply.
Franks, E. and Bryant, W. D., 2017. The Uncompensated Law of Demand: A ‘Revealed
Preference’approach. Economics Letters. 152. pp.105-111.
Guan, D. X., 2017. Transaction Cost and the Law of Demand.
Makowski, M., Piotrowski, E.W., Sładkowski, J. and Syska, J., 2017. Profit intensity and cases
of non-compliance with the law of demand/supply. Physica A: Statistical Mechanics
and its Applications. 473. pp.53-59.
Marwala, T. and Hurwitz, E., 2017. Supply and Demand. In Artificial Intelligence and Economic
Theory: Skynet in the Market (pp. 15-25). Springer, Cham.
Mazurek, J., García, C. F. and Rico, C. P., 2019. The law of demand and the loss of confidence
effect: An experimental study. Heliyon. 5(11). p.e02685.
Petrova, G., Posadneva, E. and Morozova, T., 2019. Leading the Labour Market by the Laws of
Supply and Demand. In Sustainable Leadership for Entrepreneurs and Academics (pp.
263-271). Springer, Cham.
Robinson, T. J., 2017. Economic theories of exhaustible resources. Routledge.
Rosenblatt, E.L., 2018. Creativity Without Law: Challenging the Assumptions of Intellectual
Property. Intellectual Property Journal. 30(3). pp.407-420.
Yoshii, S., 2017. An Extinction of Adjustment Time and an Introduction of Stability Condition
in Economics through Misunderstandings to JS Mill’s Law of Supply and Demand and
International Value Theory. In A new construction of Ricardian theory of international
values (pp. 245-263). Springer, Singapore.
1
⊘ This is a preview!⊘
Do you want full access?
Subscribe today to unlock all pages.
Trusted by 1+ million students worldwide
1 out of 13
Related Documents


Your All-in-One AI-Powered Toolkit for Academic Success.
+13062052269
info@desklib.com
Available 24*7 on WhatsApp / Email
![[object Object]](/_next/static/media/star-bottom.7253800d.svg)
Unlock your academic potential
Copyright © 2020–2026 A2Z Services. All Rights Reserved. Developed and managed by ZUCOL.