Business Economics Assignment - University Course: Semester 1 Analysis

Verified

Added on  2022/11/24

|9
|1014
|217
Homework Assignment
AI Summary
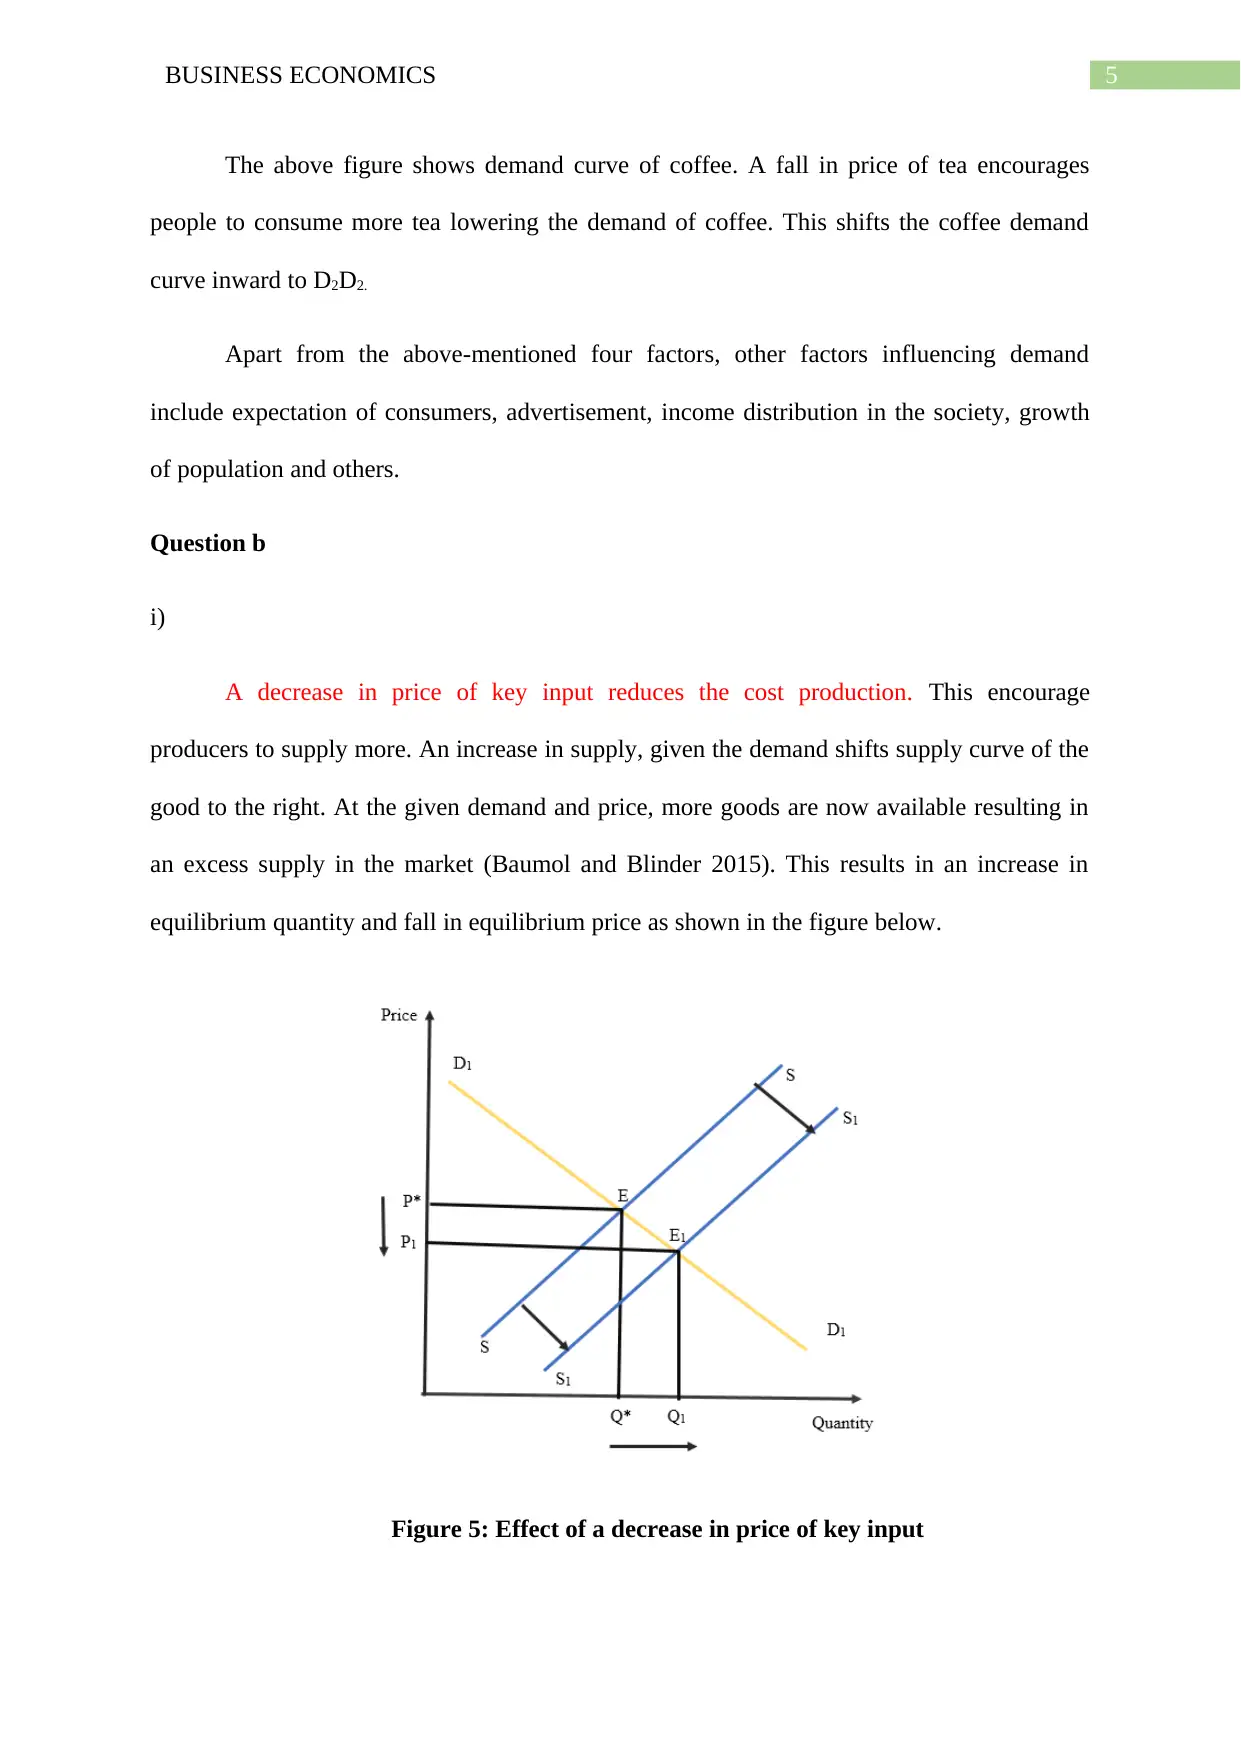
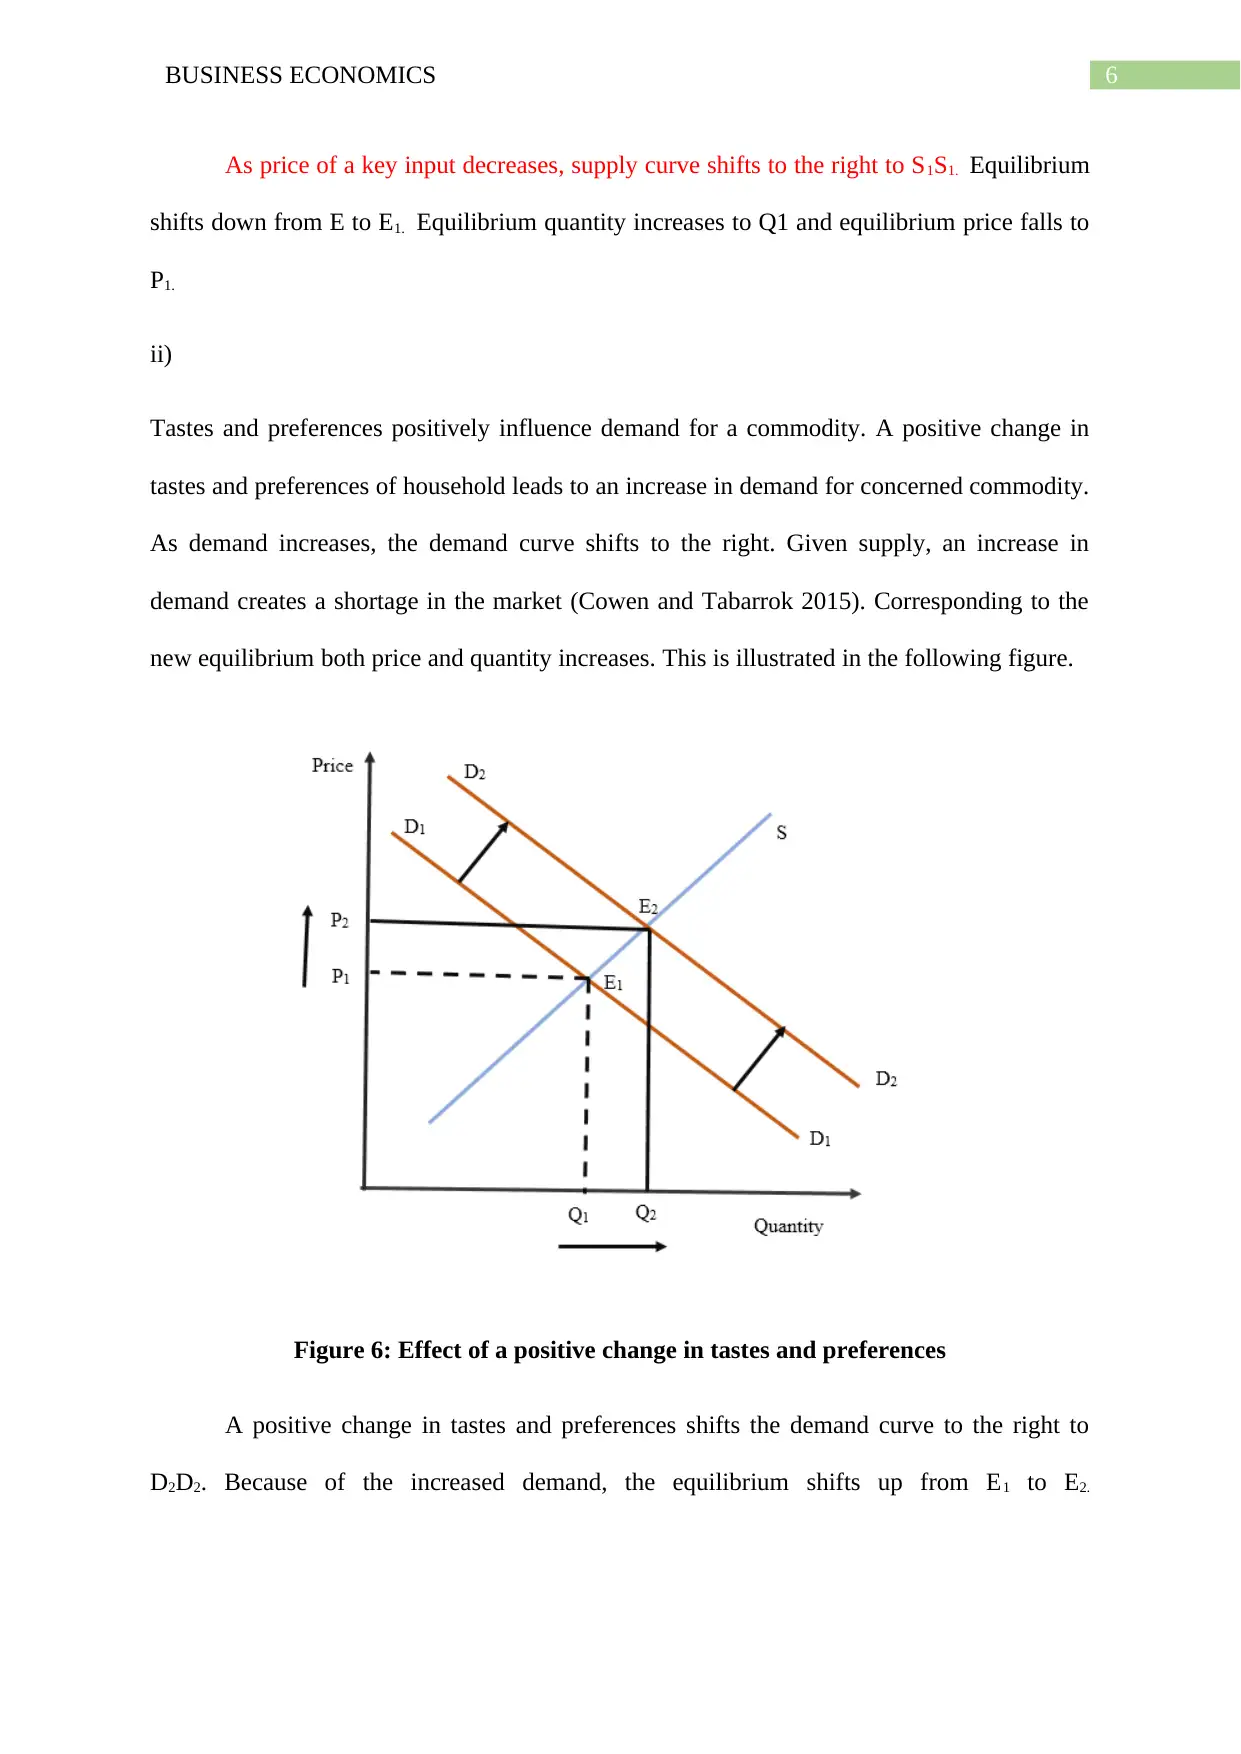
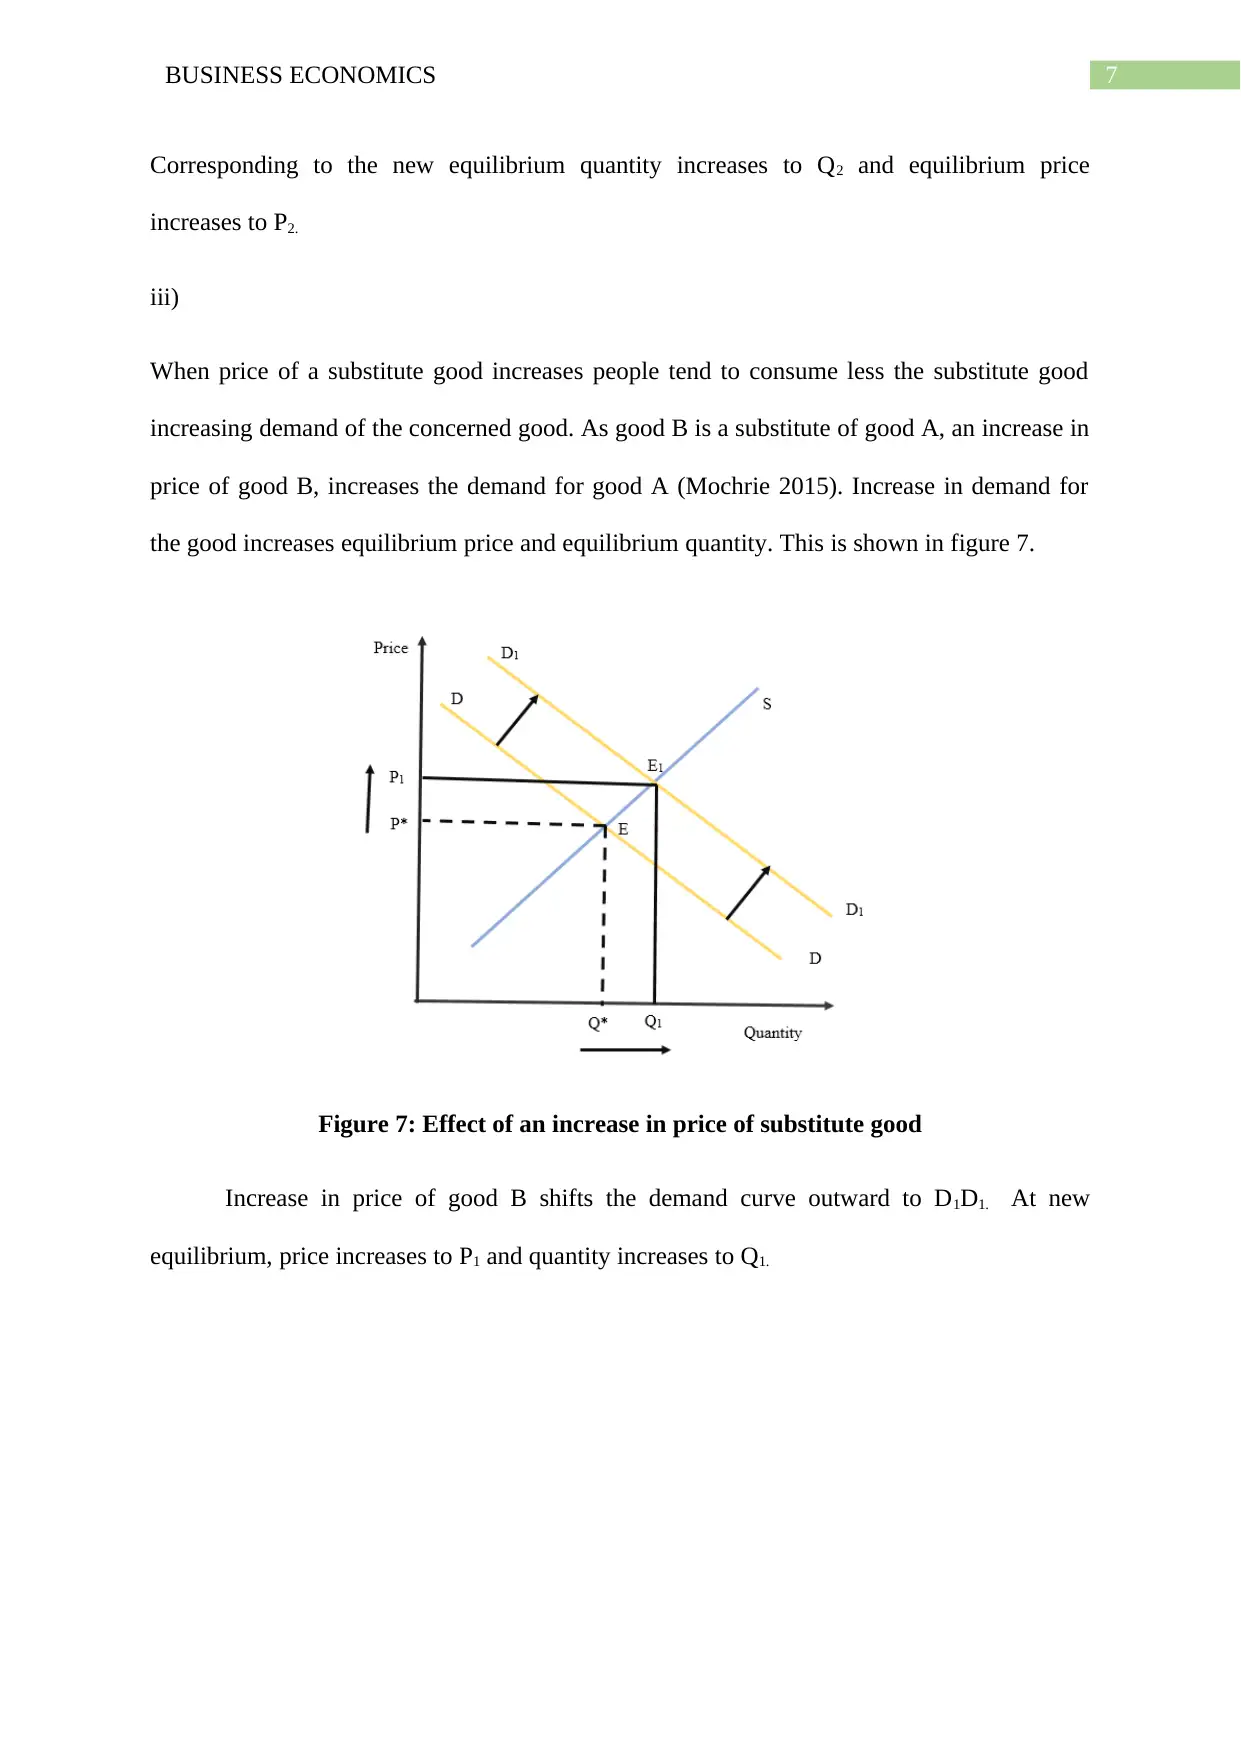
This business economics assignment delves into the core concepts of demand and supply, examining the factors that influence market dynamics. The assignment begins by exploring the determinants of demand, including price, income, tastes and preferences, and the prices of related goods, providing graphical representations to illustrate their effects. It then analyzes how changes in key economic factors, such as the price of key inputs, shifts in tastes and preferences, and changes in the price of substitute goods, impact supply, demand, and market equilibrium. The analysis includes detailed explanations and figures illustrating the shifts in supply and demand curves and their effects on equilibrium price and quantity. The assignment concludes with a comprehensive list of references, supporting the analysis presented.
Document Page
Running head: BUSINESS ECONOMICS
Business Economics
Name of the Student
Name of the University
Course ID
tabler-icon-diamond-filled.svg

Paraphrase This Document

Need a fresh take? Get an instant paraphrase of this document with our AI Paraphraser
Document Page
1BUSINESS ECONOMICS
Table of Contents
Question 1..................................................................................................................................2
Question a...............................................................................................................................2
Question b..............................................................................................................................5
References..................................................................................................................................8
Document Page
2BUSINESS ECONOMICS
Question 1
Question a
Determinants of demand
Several factors influence demand of a product. Some of the important factors
affecting demand or quantity demanded of a good are as follows.
Price
The most important determinant of demand is own price of the good. Given all other
factors affecting demand, there is an inverse relation between price and quantity demanded of
the good (Kreps 2019). That is an increase in price reduce demand and vice-versa. Demand
thus changes in the opposite direction of price. A movement along the demand curve shows
change in demand here.
Figure 1: Impact of price change on quantity demand
As shown in the above figure an increase in price from P1 to P2 reduces quantity
demanded from Q1 to Q2.
Document Page
3BUSINESS ECONOMICS
Income
After price, the next important determinant of demand is income. Income of a buyer
determines purchasing power, which in turn affects demand for the product. For a normal
good income has a direct relation with demand that is demand increases with increase in
income and vice-versa.
Figure 2: Effect of an increase in income
An increase in income of consumer increases demand for a good shifting the demand
curve to the right to D2D2.
Tastes and preferences
Tastes and preferences plays an important role in determining demand of a product.
Tastes and preferences are influenced by different factors such as life style, customs, habits,
living standard, fashion, age and gender (Cowell 2018). An increase in taste and preferences
towards a good increases demand for the good.
tabler-icon-diamond-filled.svg

Paraphrase This Document

Need a fresh take? Get an instant paraphrase of this document with our AI Paraphraser
Document Page
4BUSINESS ECONOMICS
Figure 3: Effect of a tastes and preferences on demand
In the above figure, the initial demand cure is given as DD. An increase in taste and
preference shifts the demand curve outward to D1D1.
Price of related goods
Demand of a good not only depends on own price but also depends on price of related
goods. The related goods include substitute and complementary good. In case of substitute
goods (tea and coffee), an increase in price of a good increases demand for the substitute
good (Friedman 2017). For complementary good (car and petrol), an increase in price of a
good reduces demand for its complement.
Figure 4: Impact of a change in price of related good on demand
Document Page
5BUSINESS ECONOMICS
The above figure shows demand curve of coffee. A fall in price of tea encourages
people to consume more tea lowering the demand of coffee. This shifts the coffee demand
curve inward to D2D2.
Apart from the above-mentioned four factors, other factors influencing demand
include expectation of consumers, advertisement, income distribution in the society, growth
of population and others.
Question b
i)
A decrease in price of key input reduces the cost production. This encourage
producers to supply more. An increase in supply, given the demand shifts supply curve of the
good to the right. At the given demand and price, more goods are now available resulting in
an excess supply in the market (Baumol and Blinder 2015). This results in an increase in
equilibrium quantity and fall in equilibrium price as shown in the figure below.
Figure 5: Effect of a decrease in price of key input
Document Page
6BUSINESS ECONOMICS
As price of a key input decreases, supply curve shifts to the right to S1S1. Equilibrium
shifts down from E to E1. Equilibrium quantity increases to Q1 and equilibrium price falls to
P1.
ii)
Tastes and preferences positively influence demand for a commodity. A positive change in
tastes and preferences of household leads to an increase in demand for concerned commodity.
As demand increases, the demand curve shifts to the right. Given supply, an increase in
demand creates a shortage in the market (Cowen and Tabarrok 2015). Corresponding to the
new equilibrium both price and quantity increases. This is illustrated in the following figure.
Figure 6: Effect of a positive change in tastes and preferences
A positive change in tastes and preferences shifts the demand curve to the right to
D2D2. Because of the increased demand, the equilibrium shifts up from E1 to E2.
tabler-icon-diamond-filled.svg

Paraphrase This Document

Need a fresh take? Get an instant paraphrase of this document with our AI Paraphraser
Document Page
7BUSINESS ECONOMICS
Corresponding to the new equilibrium quantity increases to Q2 and equilibrium price
increases to P2.
iii)
When price of a substitute good increases people tend to consume less the substitute good
increasing demand of the concerned good. As good B is a substitute of good A, an increase in
price of good B, increases the demand for good A (Mochrie 2015). Increase in demand for
the good increases equilibrium price and equilibrium quantity. This is shown in figure 7.
Figure 7: Effect of an increase in price of substitute good
Increase in price of good B shifts the demand curve outward to D1D1. At new
equilibrium, price increases to P1 and quantity increases to Q1.
Document Page
8BUSINESS ECONOMICS
References
Baumol, W.J. and Blinder, A.S., 2015. Microeconomics: Principles and policy. Nelson
Education.
Cowell, F., 2018. Microeconomics: principles and analysis. Oxford University Press.
Cowen, T. and Tabarrok, A., 2015. Modern principles of microeconomics. Macmillan
International Higher Education.
Friedman, L.S., 2017. The microeconomics of public policy analysis. Princeton University
Press.
Kreps, D.M., 2019. Microeconomics for managers. Princeton University Press.
Mochrie, R., 2015. Intermediate microeconomics. Macmillan International Higher Education.
chevron_up_icon
1 out of 9
circle_padding
hide_on_mobile
zoom_out_icon
[object Object]