Managerial Economics: Demand Analysis and Elasticity Assignment

Verified

Added on  2020/02/19

|2
|384
|262
Homework Assignment
AI Summary
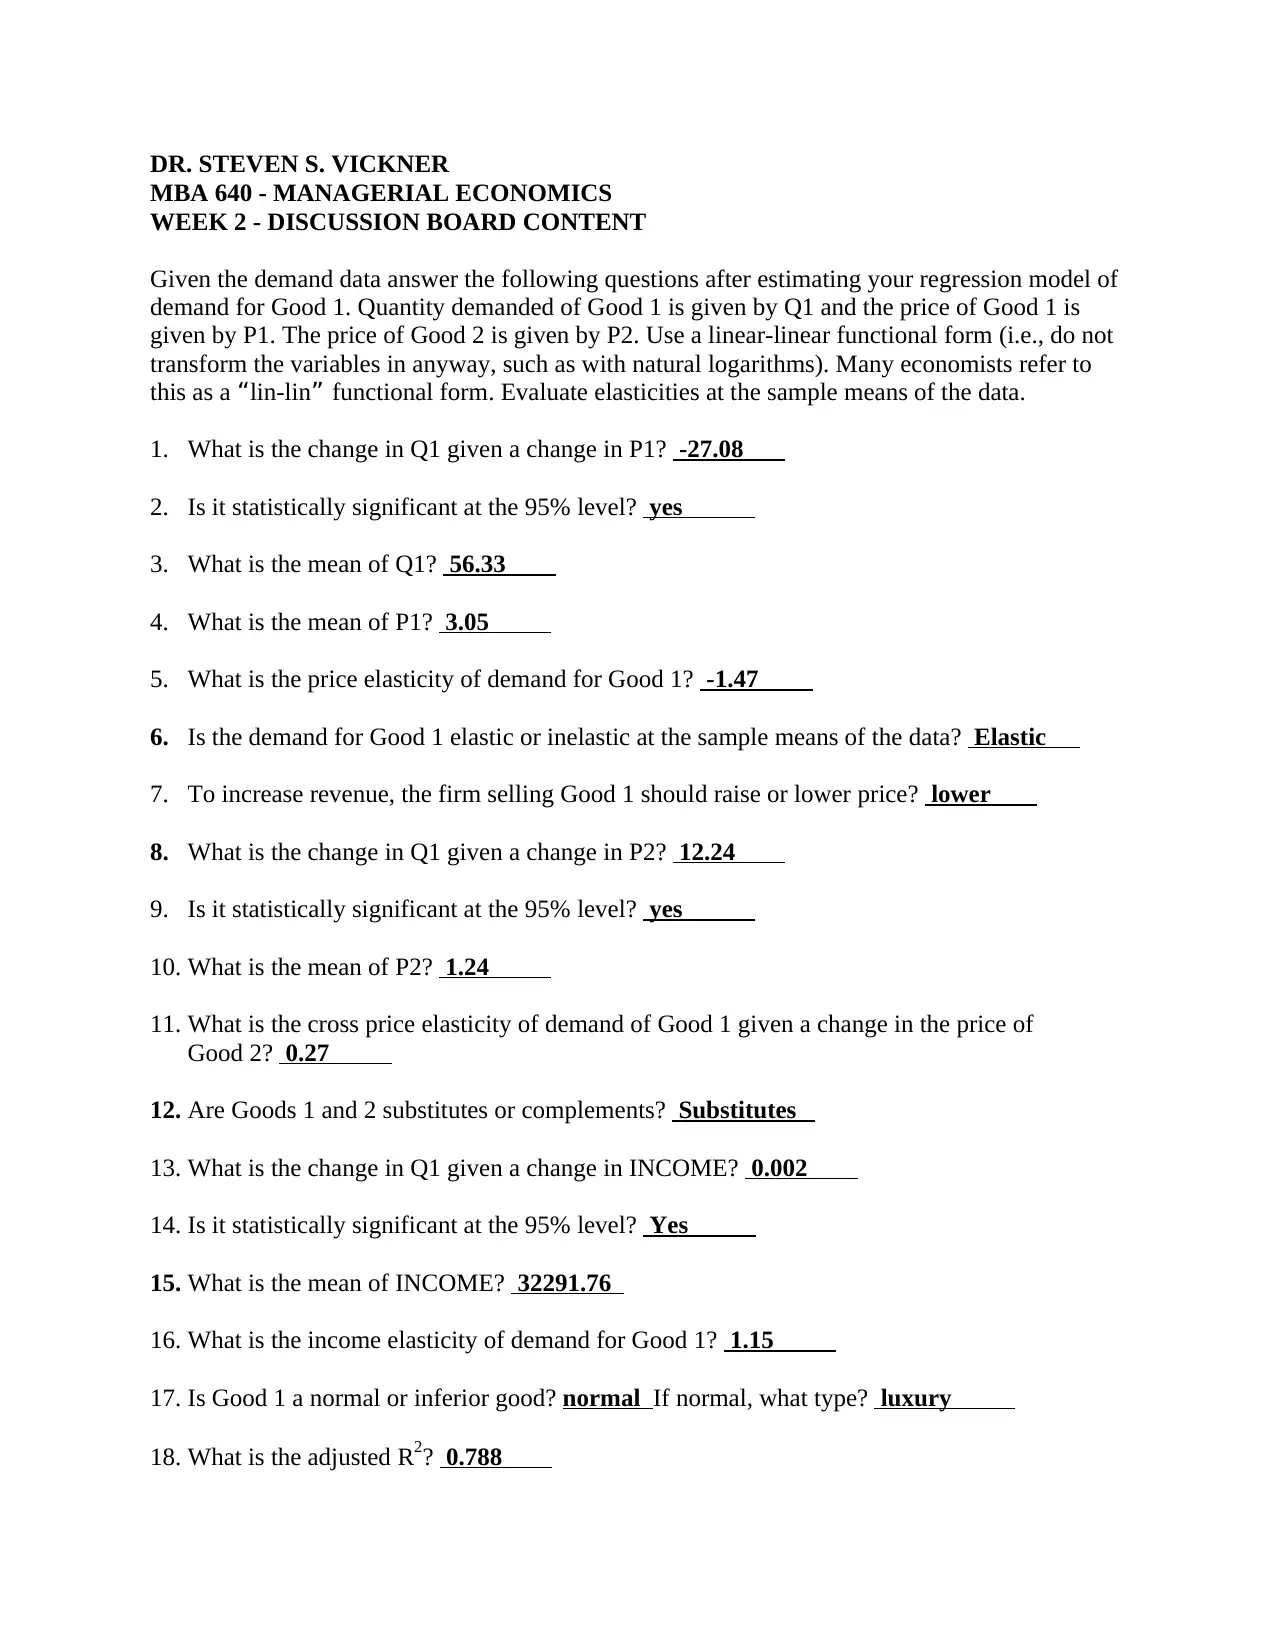
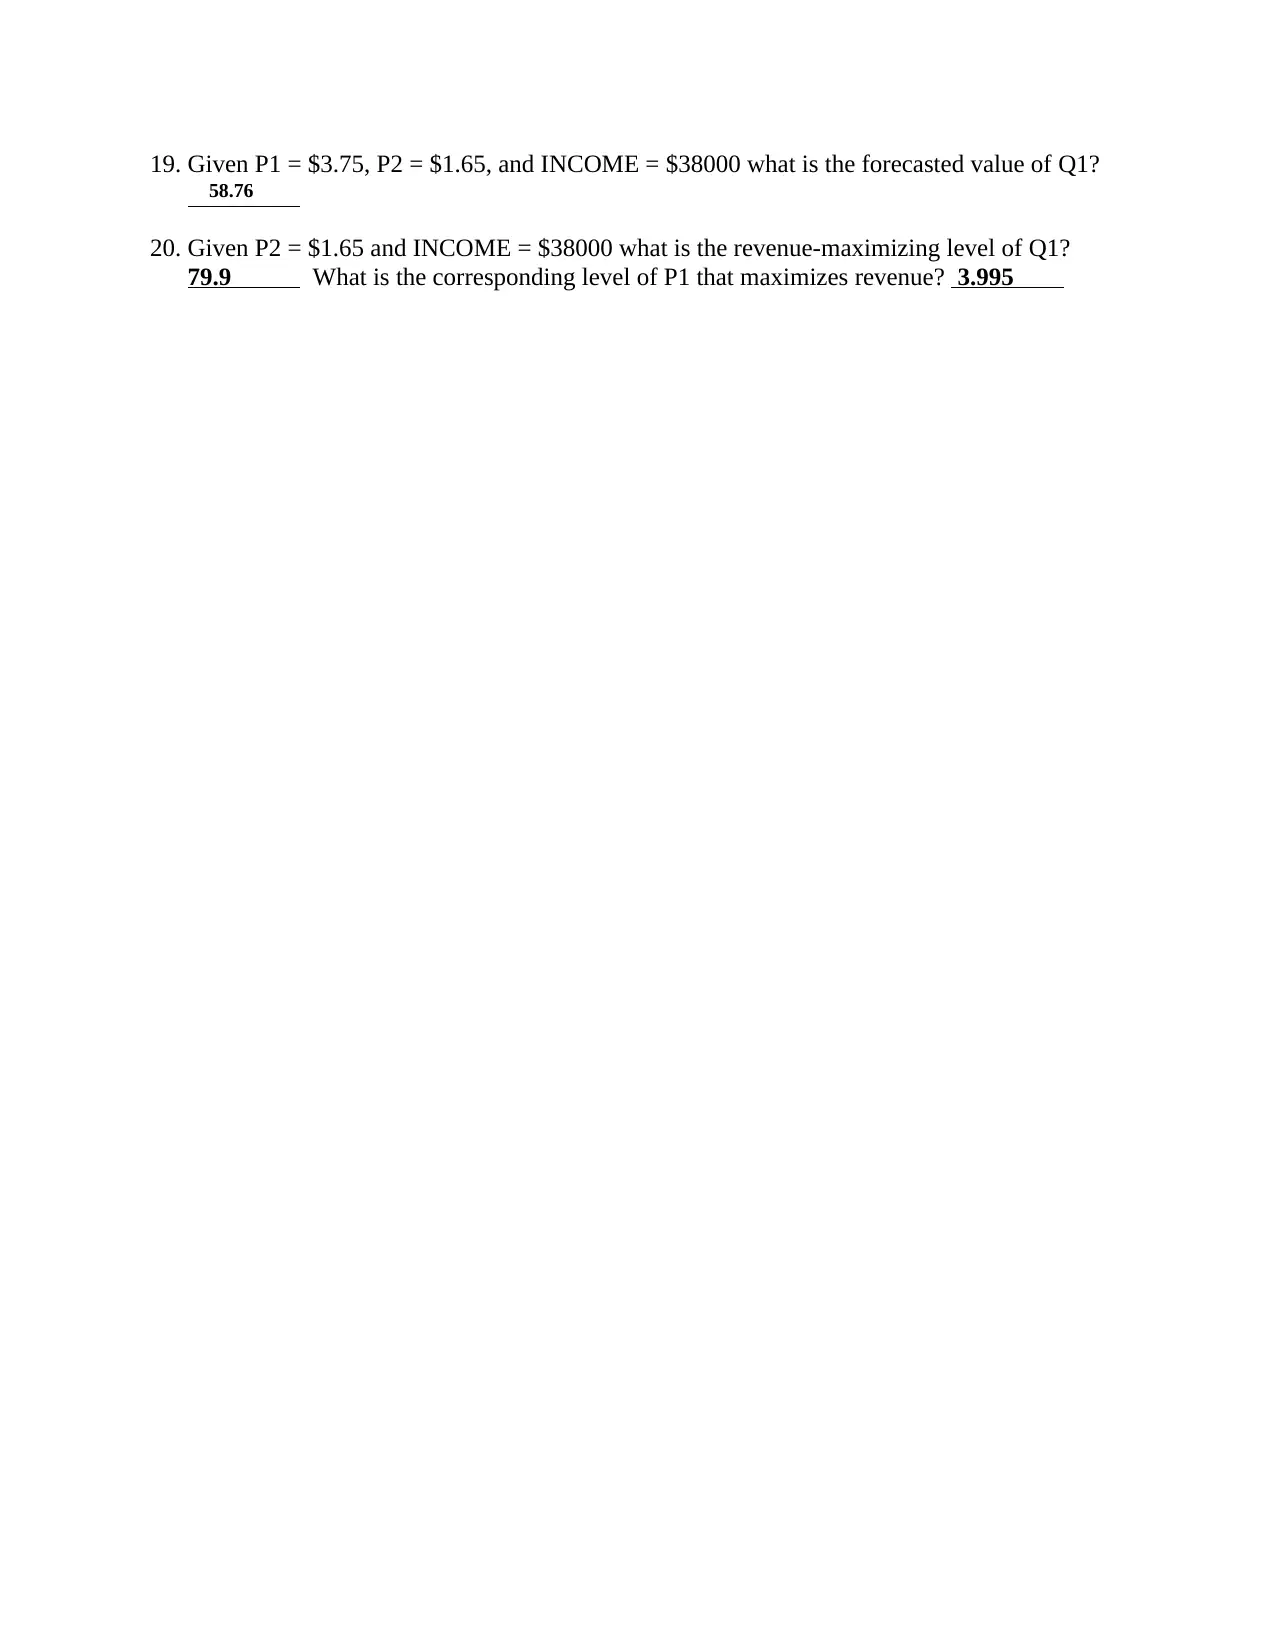
This assignment analyzes the demand for Good 1 using a linear-linear functional form, examining the impact of its own price (P1), the price of a related good (P2), and income on quantity demanded (Q1). The solution calculates and interprets key metrics, including the price elasticity of demand, cross-price elasticity, and income elasticity. It determines whether Goods 1 and 2 are substitutes or complements and whether Good 1 is a normal or inferior good. The assignment also forecasts Q1 given specific values for P1, P2, and income, and it determines the revenue-maximizing level of Q1 and its corresponding price. The analysis is statistically significant at the 95% level for most variables.
Document Page
DR. STEVEN S. VICKNER
MBA 640 - MANAGERIAL ECONOMICS
WEEK 2 - DISCUSSION BOARD CONTENT
Given the demand data answer the following questions after estimating your regression model of
demand for Good 1. Quantity demanded of Good 1 is given by Q1 and the price of Good 1 is
given by P1. The price of Good 2 is given by P2. Use a linear-linear functional form (i.e., do not
transform the variables in anyway, such as with natural logarithms). Many economists refer to
this as a lin-lin functional form. Evaluate elasticities at the sample means of the data.
1. What is the change in Q1 given a change in P1? -27.08
2. Is it statistically significant at the 95% level? yes
3. What is the mean of Q1? 56.33
4. What is the mean of P1? 3.05
5. What is the price elasticity of demand for Good 1? -1.47
6. Is the demand for Good 1 elastic or inelastic at the sample means of the data? Elastic
7. To increase revenue, the firm selling Good 1 should raise or lower price? lower
8. What is the change in Q1 given a change in P2? 12.24
9. Is it statistically significant at the 95% level? yes
10. What is the mean of P2? 1.24
11. What is the cross price elasticity of demand of Good 1 given a change in the price of
Good 2? 0.27
12. Are Goods 1 and 2 substitutes or complements? Substitutes
13. What is the change in Q1 given a change in INCOME? 0.002
14. Is it statistically significant at the 95% level? Yes
15. What is the mean of INCOME? 32291.76
16. What is the income elasticity of demand for Good 1? 1.15
17. Is Good 1 a normal or inferior good? normal If normal, what type? luxury
18. What is the adjusted R2? 0.788
tabler-icon-diamond-filled.svg

Paraphrase This Document

Need a fresh take? Get an instant paraphrase of this document with our AI Paraphraser
Document Page
19. Given P1 = $3.75, P2 = $1.65, and INCOME = $38000 what is the forecasted value of Q1?
58.76
20. Given P2 = $1.65 and INCOME = $38000 what is the revenue-maximizing level of Q1?
79.9 What is the corresponding level of P1 that maximizes revenue? 3.995
chevron_up_icon
1 out of 2
circle_padding
hide_on_mobile
zoom_out_icon
[object Object]