Economics Assignment: Analysis of Hula-Hoop Market Dynamics

Verified

Added on  2020/05/16

|4
|333
|149
Homework Assignment
AI Summary
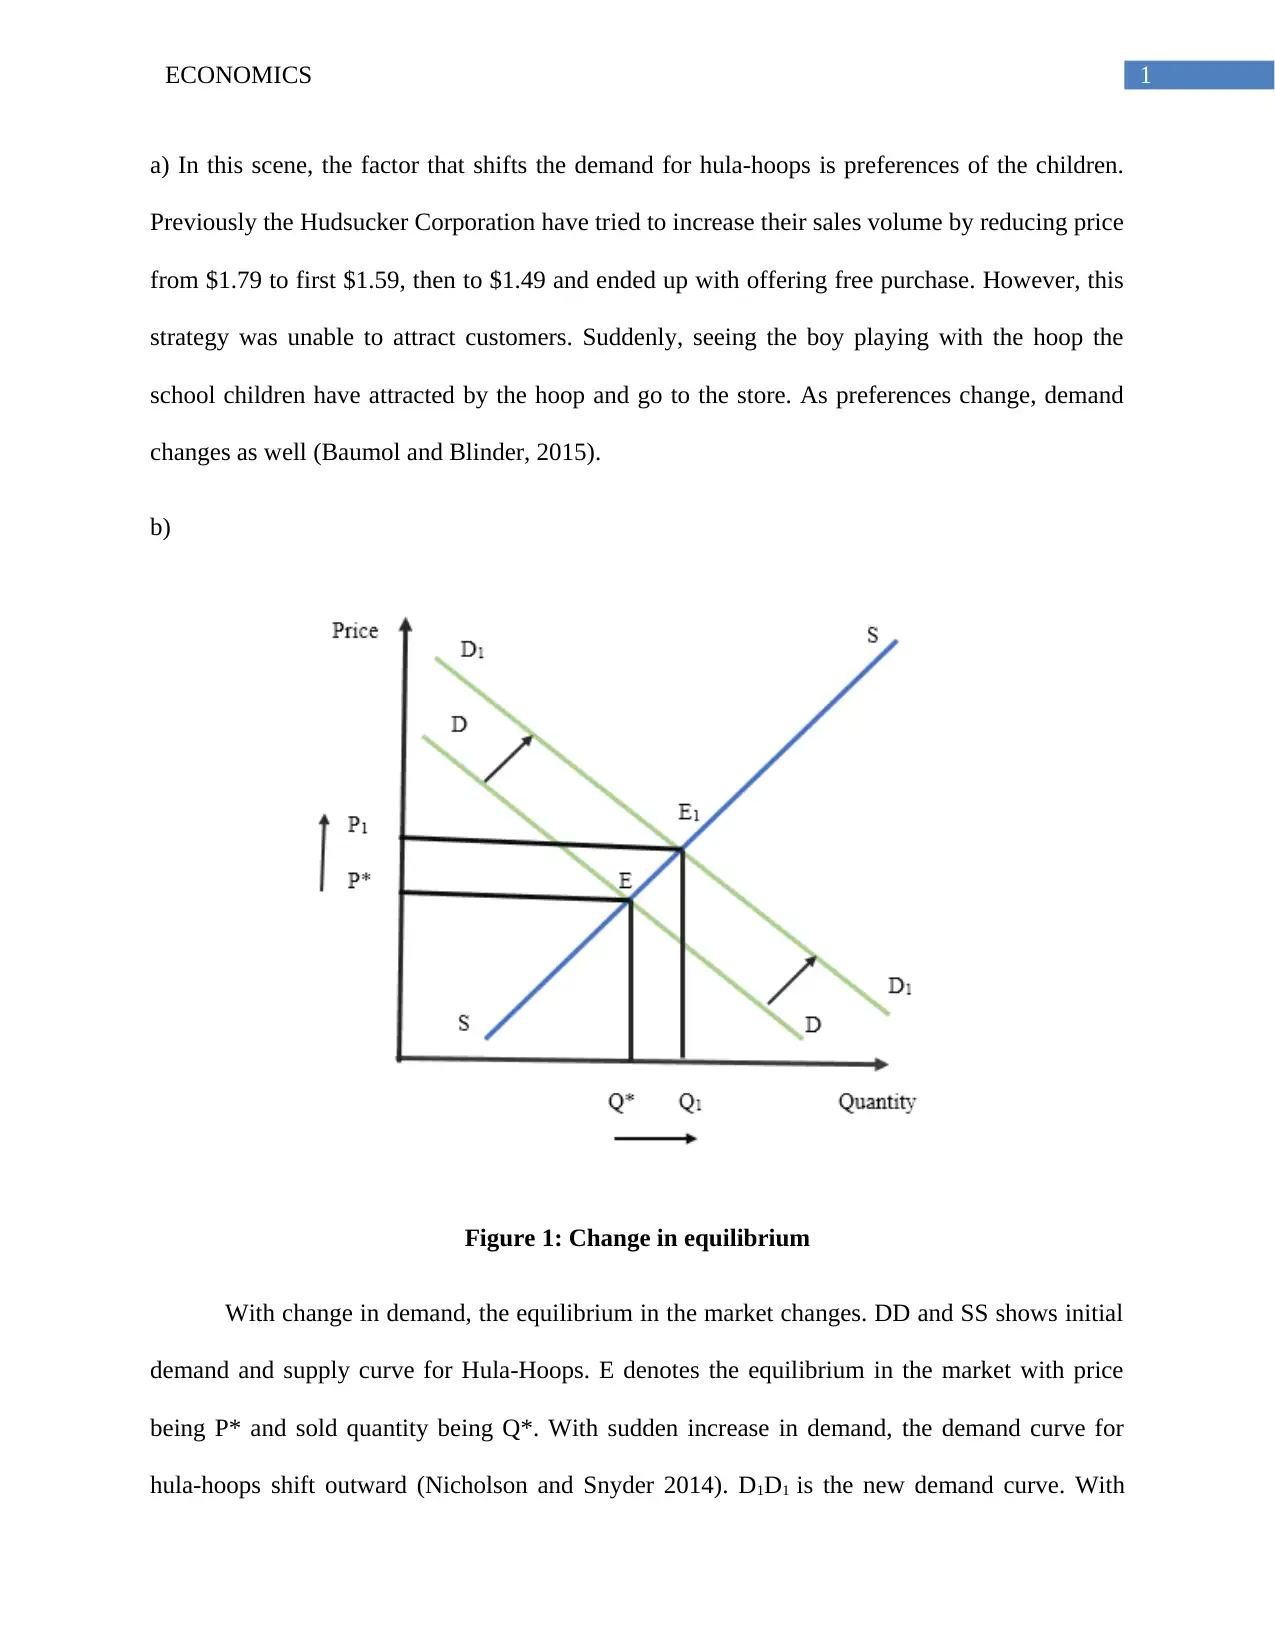
This economics assignment delves into the market dynamics of hula-hoops, examining how shifts in demand, influenced by factors such as consumer preferences, impact market equilibrium. The assignment uses a case study of the Hudsucker Corporation to illustrate these concepts. It explains how an initial attempt to increase sales through price reductions failed to boost demand until a change in consumer preferences, specifically children's interest, led to a significant increase in demand. The solution includes a graphical representation of the demand and supply curves, showing the shift in the demand curve and the resulting changes in equilibrium price and quantity. The assignment also provides a personal example, demonstrating how increased pocket money led to increased demand for gaming parlor visits. The references used in the assignment are Baumol and Blinder's 'Microeconomics: Principles and Policy' and Nicholson and Snyder's 'Intermediate Microeconomics and its Application'. This assignment provides a clear understanding of demand and supply principles and their application in real-world scenarios.
Document Page
Running Head: ECONOMICS
Economics
Name of the Student
Name of the University
Author note
tabler-icon-diamond-filled.svg

Paraphrase This Document

Need a fresh take? Get an instant paraphrase of this document with our AI Paraphraser
Document Page
1ECONOMICS
a) In this scene, the factor that shifts the demand for hula-hoops is preferences of the children.
Previously the Hudsucker Corporation have tried to increase their sales volume by reducing price
from $1.79 to first $1.59, then to $1.49 and ended up with offering free purchase. However, this
strategy was unable to attract customers. Suddenly, seeing the boy playing with the hoop the
school children have attracted by the hoop and go to the store. As preferences change, demand
changes as well (Baumol and Blinder, 2015).
b)
Figure 1: Change in equilibrium
With change in demand, the equilibrium in the market changes. DD and SS shows initial
demand and supply curve for Hula-Hoops. E denotes the equilibrium in the market with price
being P* and sold quantity being Q*. With sudden increase in demand, the demand curve for
hula-hoops shift outward (Nicholson and Snyder 2014). D1D1 is the new demand curve. With
Document Page
2ECONOMICS
increased demand, the equilibrium shifts from E to E1. At E1, price increases to P1 and quantity
increases to Q1.
c)
A few months ago, my father has received a salary hike and as a result, he increased my pocket
money on my demand. Previously, I could afford to go gaming parlor only once in a month.
With increased pocket money, I can now afford to go to the game parlor more than once and this
shifts my demand for playing games.
Document Page
3ECONOMICS
Reference
Baumol, W.J. and Blinder, A.S., 2015. Microeconomics: Principles and policy. Cengage
Learning.
Nicholson, W. and Snyder, C.M., 2014. Intermediate microeconomics and its application.
Cengage Learning.
chevron_up_icon
1 out of 4
circle_padding
hide_on_mobile
zoom_out_icon
[object Object]