Economics Assignment: GDP, Inflation, and Fiscal Policy
VerifiedAdded on 2020/05/11
|9
|1323
|45
Homework Assignment
AI Summary
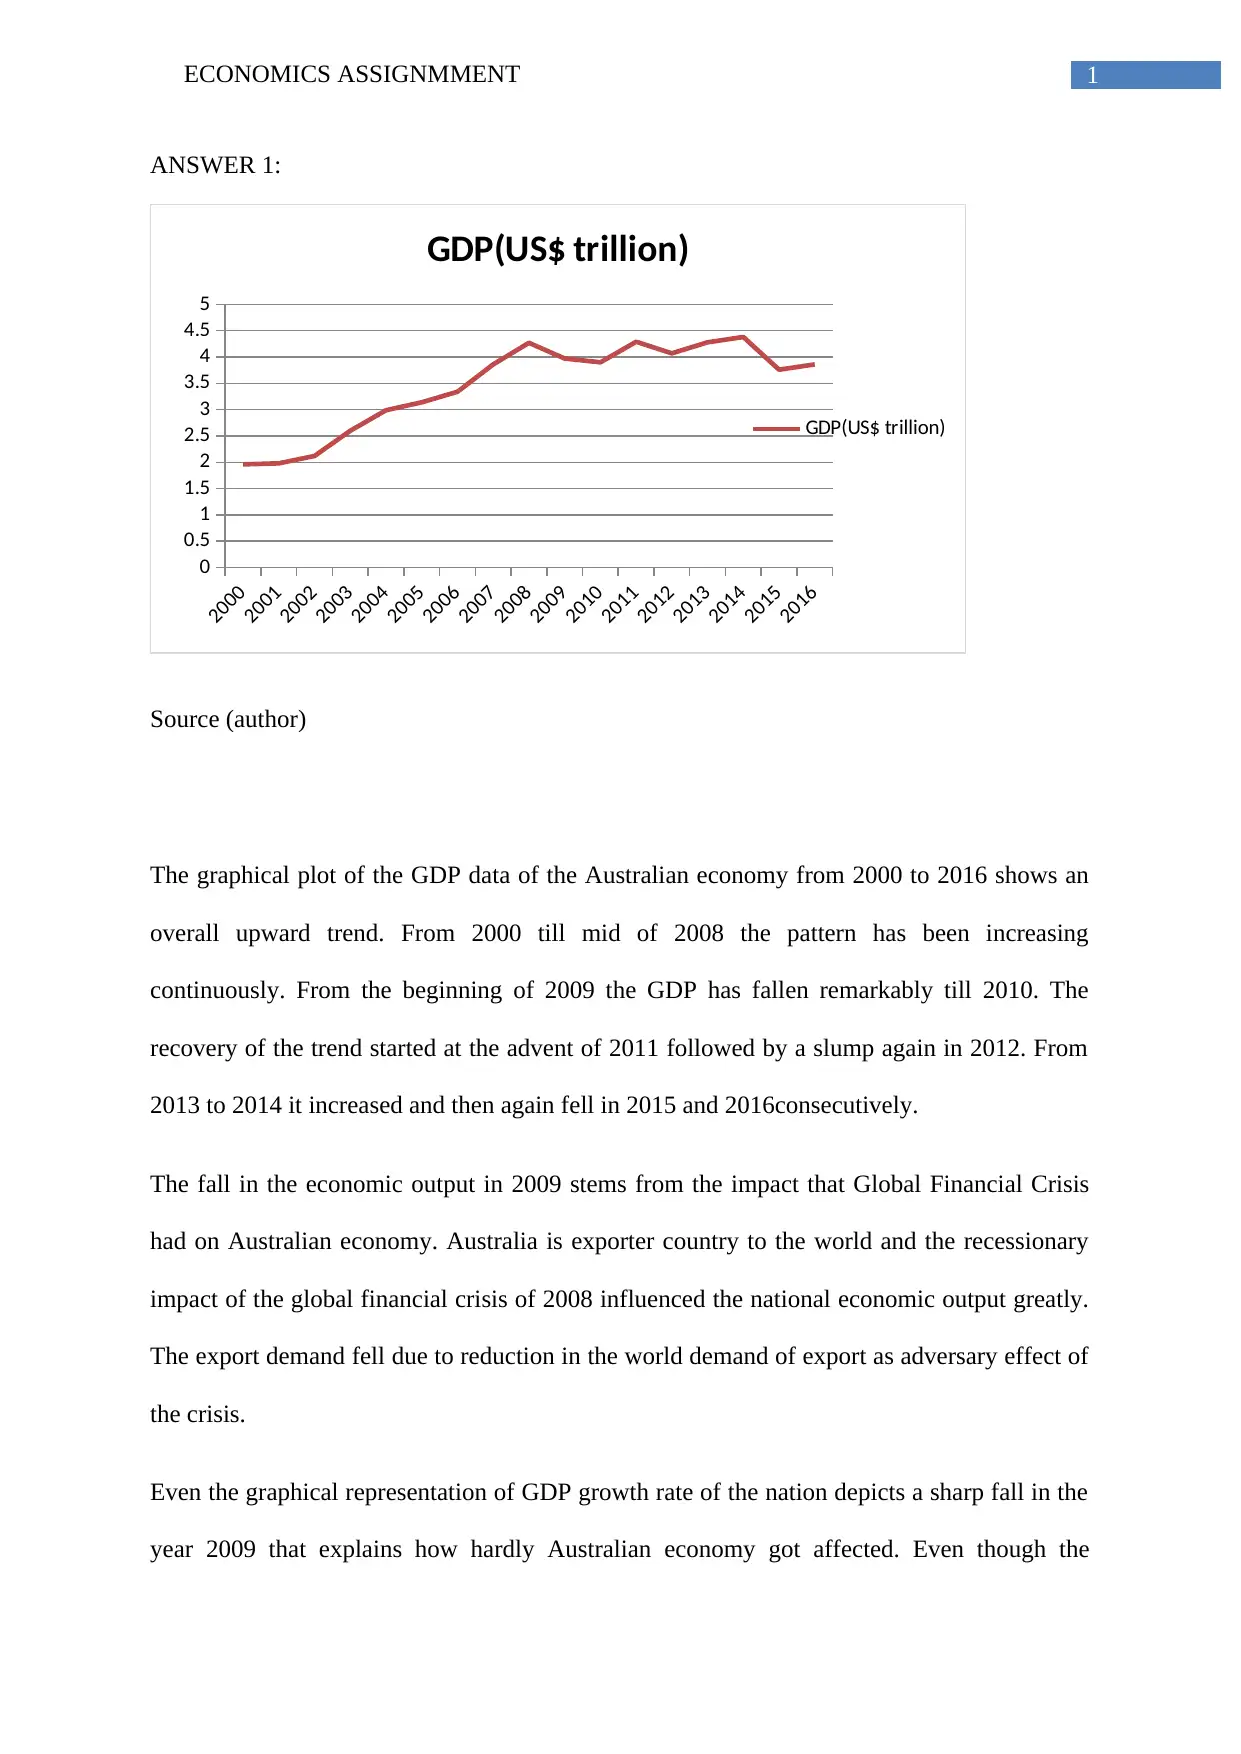
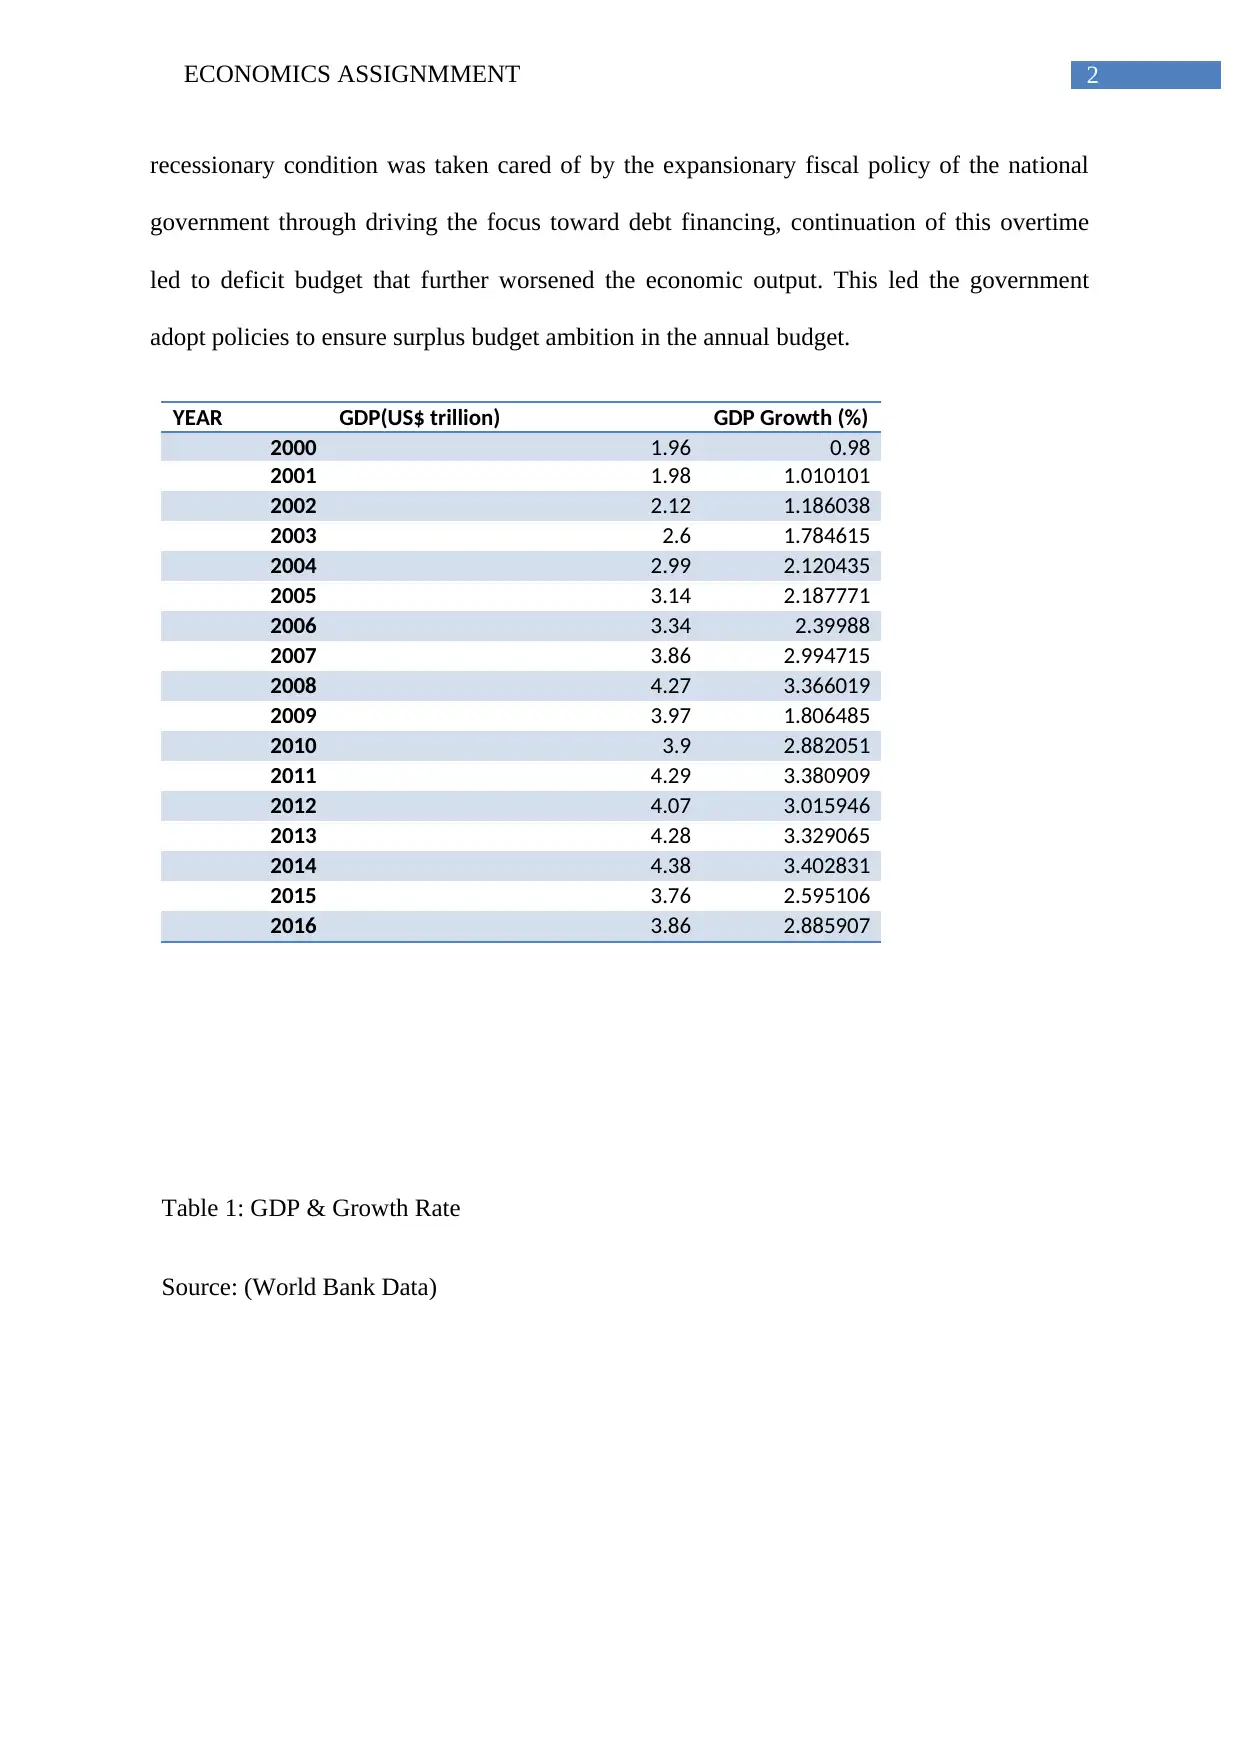
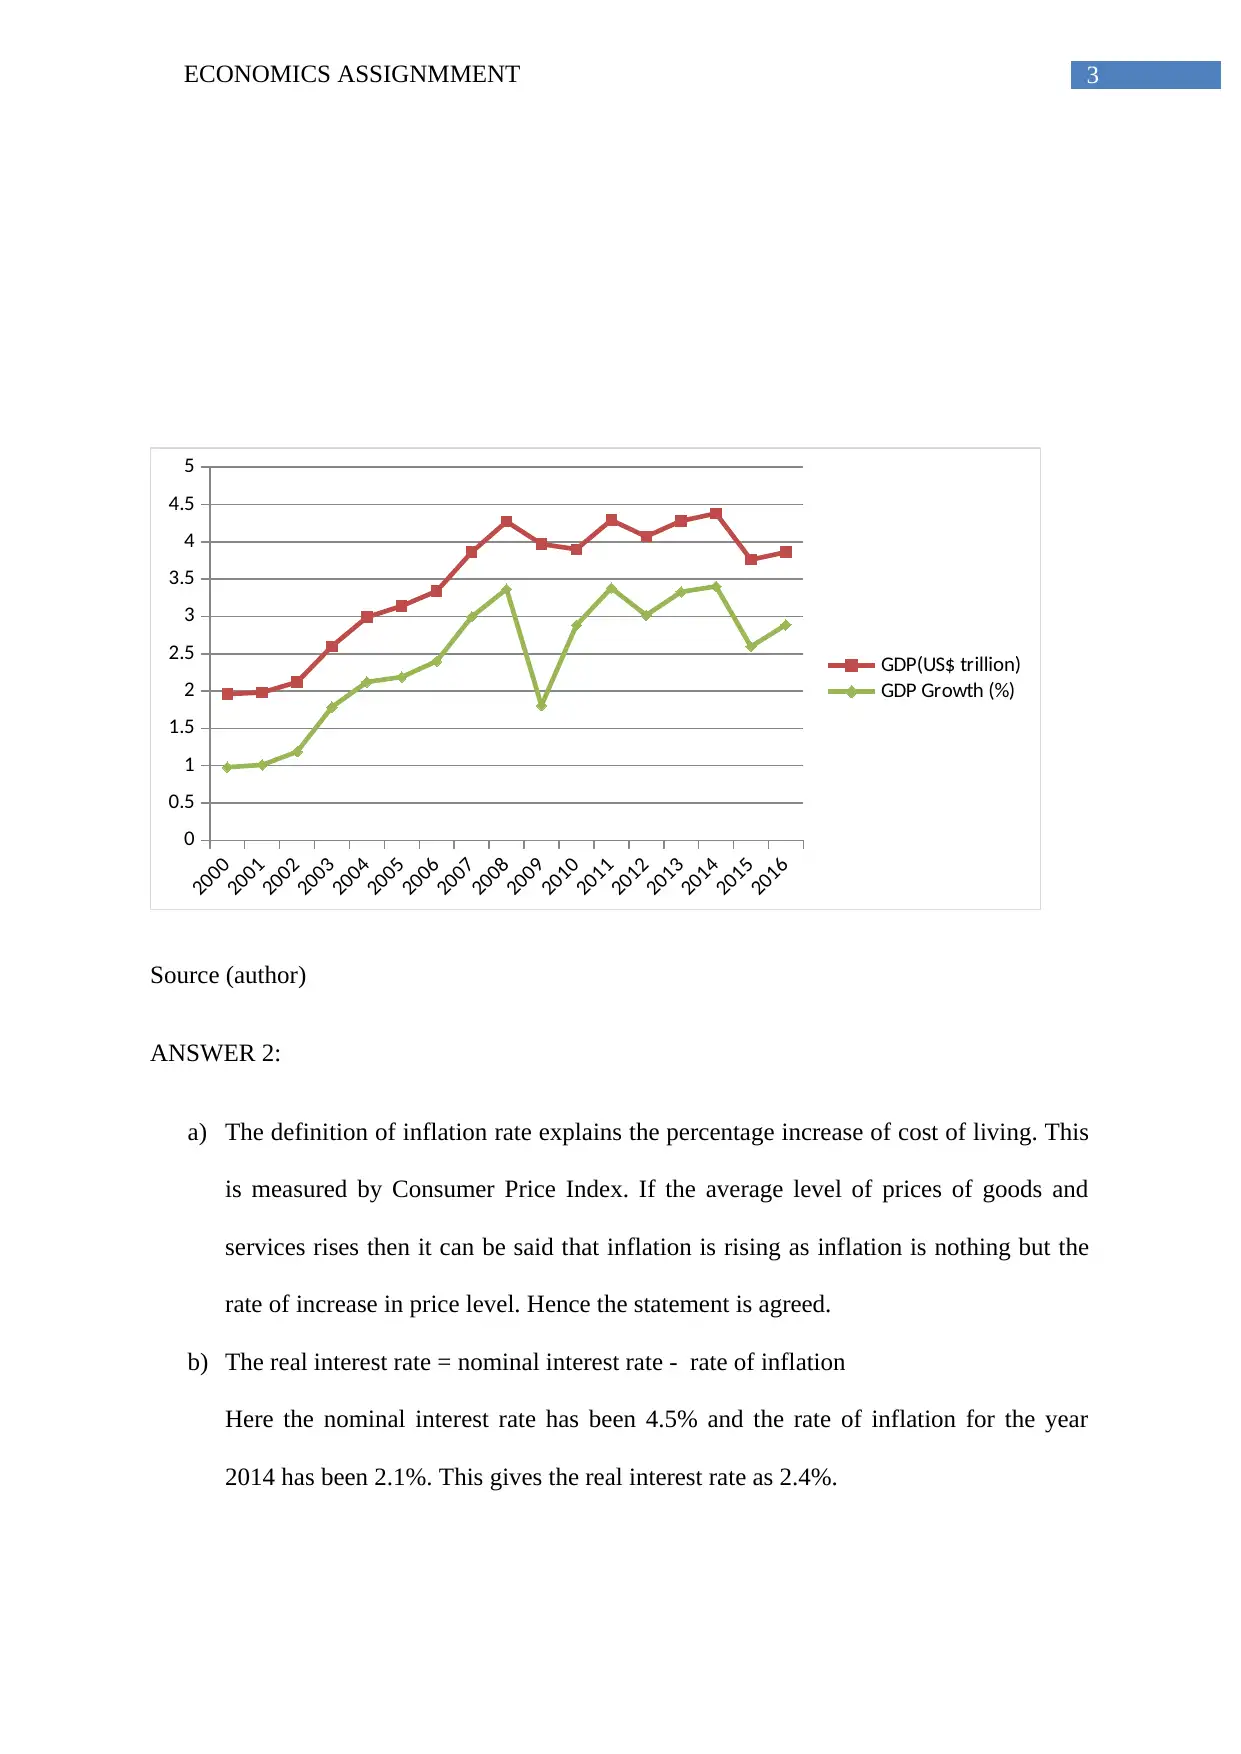
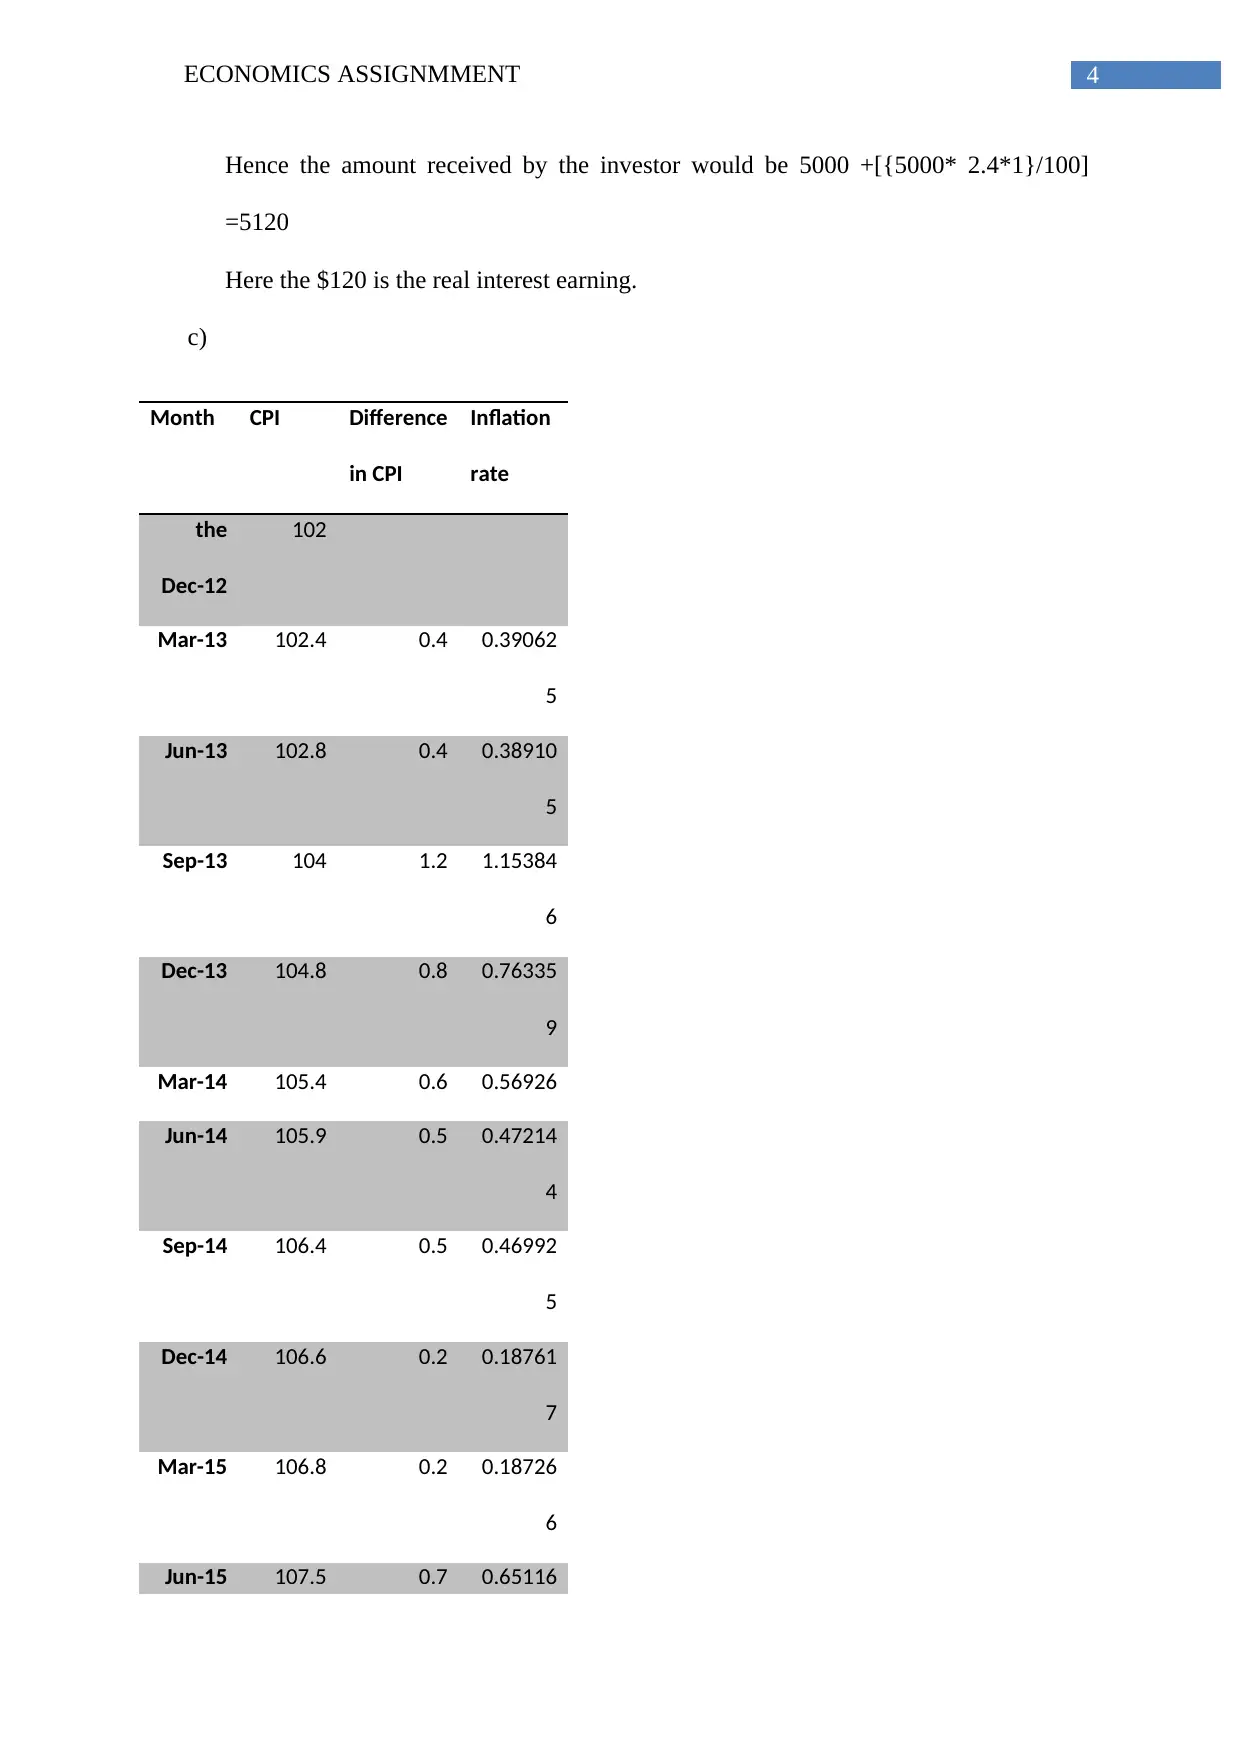
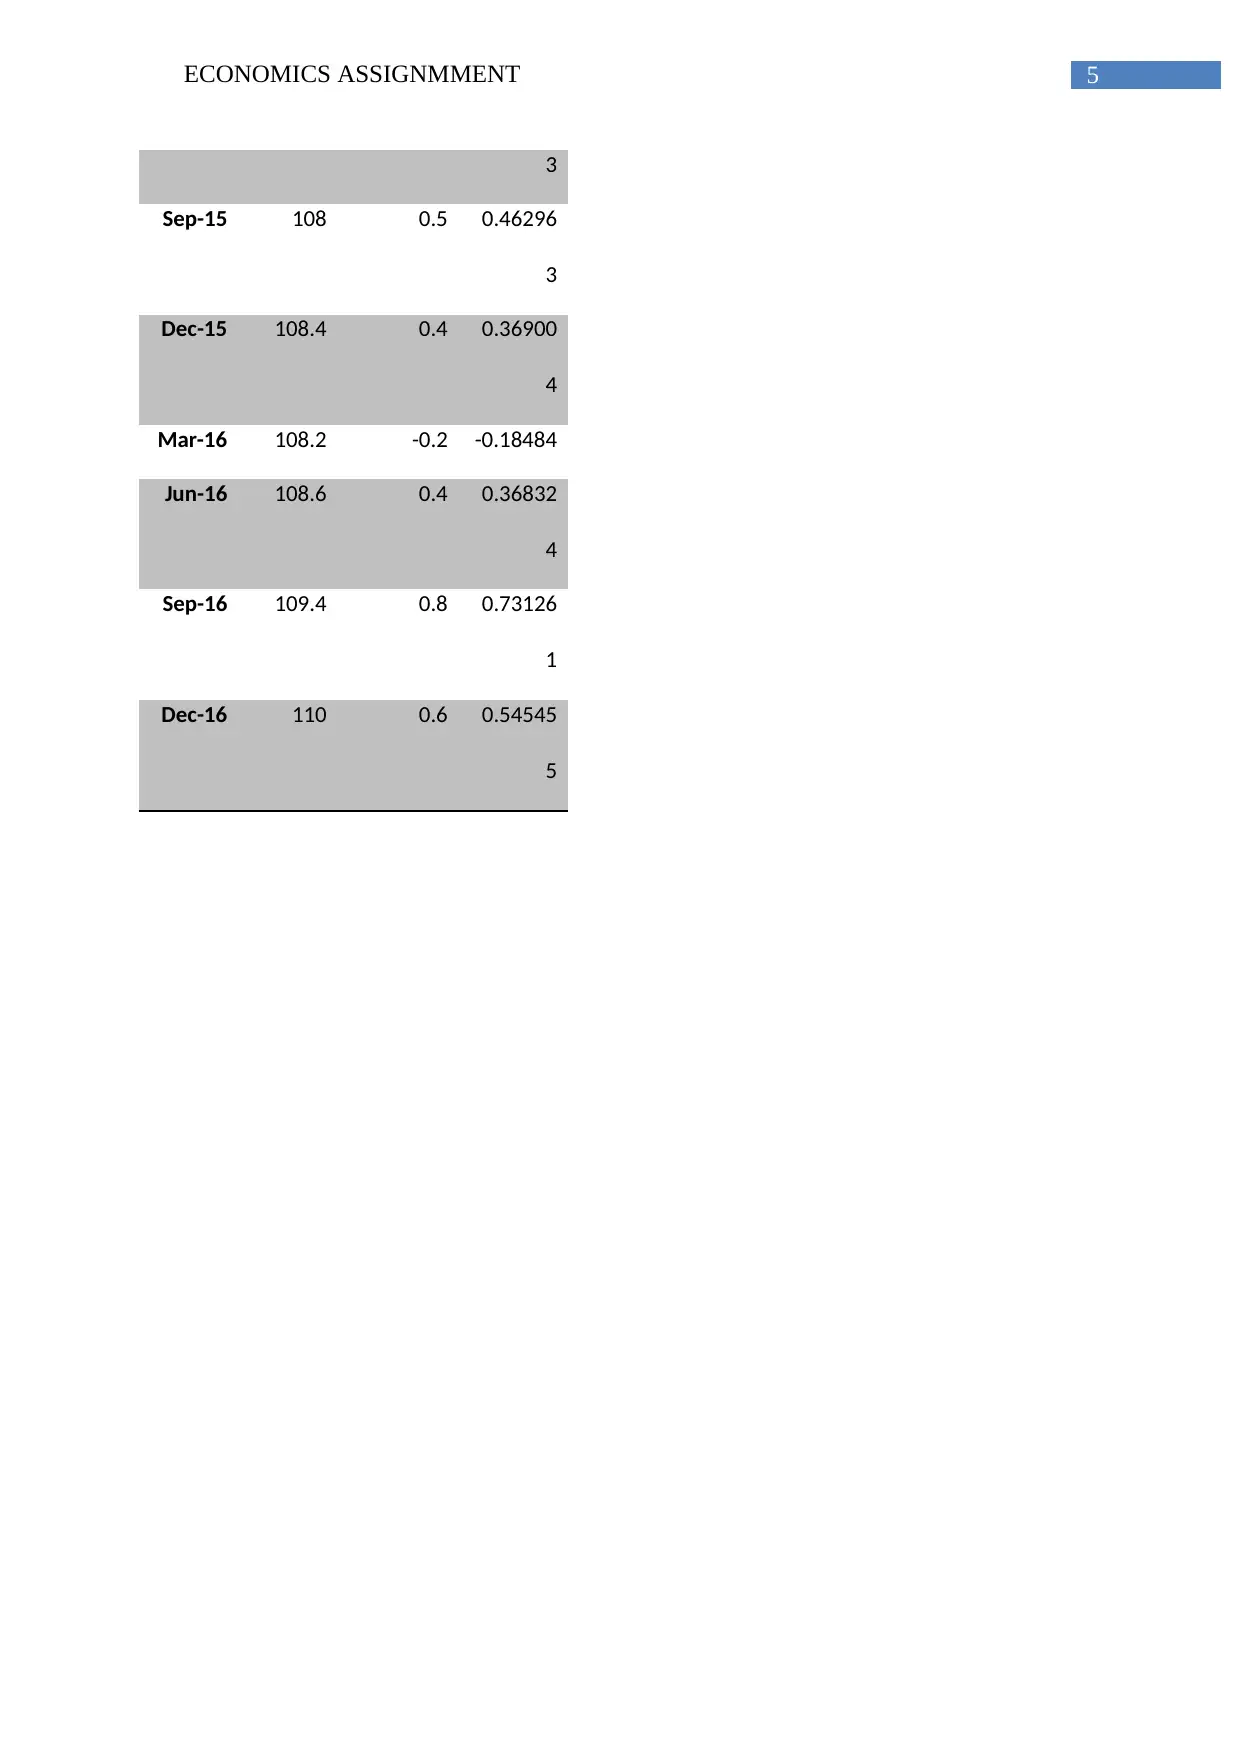
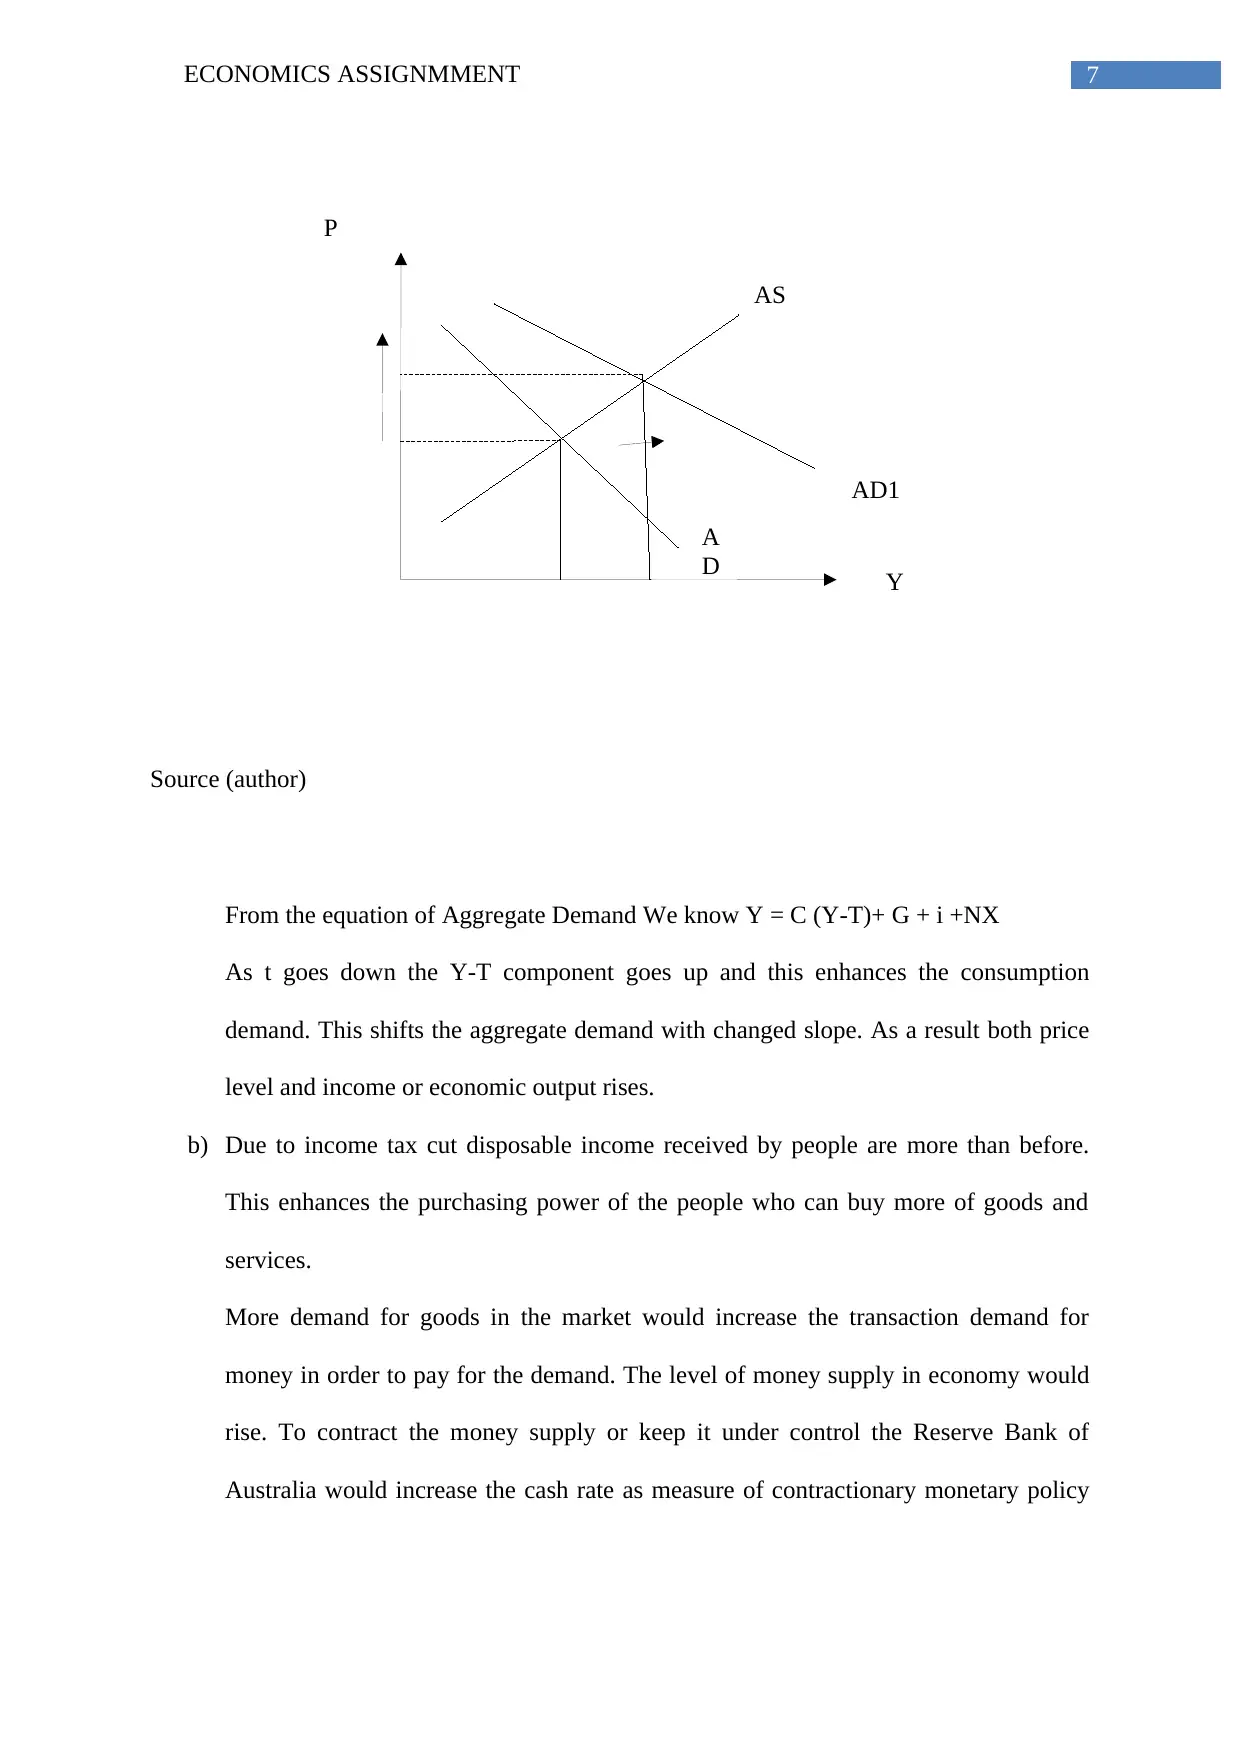
This economics assignment analyzes the Australian economy from 2000 to 2016, examining GDP trends, inflation rates, and the impact of fiscal policy. The assignment includes calculations of real interest rates and inflation, using CPI data. It explores the effects of an income tax cut, considered an ex...

Running head: ECONOMICS ASSIGNMMENT
ECONOMICS ASSIGNMMENT
Name of Student:
Name of University:
Author Note:
ECONOMICS ASSIGNMMENT
Name of Student:
Name of University:
Author Note:
Paraphrase This Document
Need a fresh take? Get an instant paraphrase of this document with our AI Paraphraser

1ECONOMICS ASSIGNMMENT
ANSWER 1:
2000
2001
2002
2003
2004
2005
2006
2007
2008
2009
2010
2011
2012
2013
2014
2015
2016
0
0.5
1
1.5
2
2.5
3
3.5
4
4.5
5
GDP(US$ trillion)
GDP(US$ trillion)
Source (author)
The graphical plot of the GDP data of the Australian economy from 2000 to 2016 shows an
overall upward trend. From 2000 till mid of 2008 the pattern has been increasing
continuously. From the beginning of 2009 the GDP has fallen remarkably till 2010. The
recovery of the trend started at the advent of 2011 followed by a slump again in 2012. From
2013 to 2014 it increased and then again fell in 2015 and 2016consecutively.
The fall in the economic output in 2009 stems from the impact that Global Financial Crisis
had on Australian economy. Australia is exporter country to the world and the recessionary
impact of the global financial crisis of 2008 influenced the national economic output greatly.
The export demand fell due to reduction in the world demand of export as adversary effect of
the crisis.
Even the graphical representation of GDP growth rate of the nation depicts a sharp fall in the
year 2009 that explains how hardly Australian economy got affected. Even though the

2ECONOMICS ASSIGNMMENT
recessionary condition was taken cared of by the expansionary fiscal policy of the national
government through driving the focus toward debt financing, continuation of this overtime
led to deficit budget that further worsened the economic output. This led the government
adopt policies to ensure surplus budget ambition in the annual budget.
YEAR GDP(US$ trillion) GDP Growth (%)
2000 1.96 0.98
2001 1.98 1.010101
2002 2.12 1.186038
2003 2.6 1.784615
2004 2.99 2.120435
2005 3.14 2.187771
2006 3.34 2.39988
2007 3.86 2.994715
2008 4.27 3.366019
2009 3.97 1.806485
2010 3.9 2.882051
2011 4.29 3.380909
2012 4.07 3.015946
2013 4.28 3.329065
2014 4.38 3.402831
2015 3.76 2.595106
2016 3.86 2.885907
Table 1: GDP & Growth Rate
Source: (World Bank Data)
⊘ This is a preview!⊘
Do you want full access?
Subscribe today to unlock all pages.

Trusted by 1+ million students worldwide

3ECONOMICS ASSIGNMMENT
2000
2001
2002
2003
2004
2005
2006
2007
2008
2009
2010
2011
2012
2013
2014
2015
2016
0
0.5
1
1.5
2
2.5
3
3.5
4
4.5
5
GDP(US$ trillion)
GDP Growth (%)
Source (author)
ANSWER 2:
a) The definition of inflation rate explains the percentage increase of cost of living. This
is measured by Consumer Price Index. If the average level of prices of goods and
services rises then it can be said that inflation is rising as inflation is nothing but the
rate of increase in price level. Hence the statement is agreed.
b) The real interest rate = nominal interest rate - rate of inflation
Here the nominal interest rate has been 4.5% and the rate of inflation for the year
2014 has been 2.1%. This gives the real interest rate as 2.4%.
Paraphrase This Document
Need a fresh take? Get an instant paraphrase of this document with our AI Paraphraser

4ECONOMICS ASSIGNMMENT
Hence the amount received by the investor would be 5000 +[{5000* 2.4*1}/100]
=5120
Here the $120 is the real interest earning.
c)
Month CPI Difference
in CPI
Inflation
rate
the
Dec-12
102
Mar-13 102.4 0.4 0.39062
5
Jun-13 102.8 0.4 0.38910
5
Sep-13 104 1.2 1.15384
6
Dec-13 104.8 0.8 0.76335
9
Mar-14 105.4 0.6 0.56926
Jun-14 105.9 0.5 0.47214
4
Sep-14 106.4 0.5 0.46992
5
Dec-14 106.6 0.2 0.18761
7
Mar-15 106.8 0.2 0.18726
6
Jun-15 107.5 0.7 0.65116

5ECONOMICS ASSIGNMMENT
3
Sep-15 108 0.5 0.46296
3
Dec-15 108.4 0.4 0.36900
4
Mar-16 108.2 -0.2 -0.18484
Jun-16 108.6 0.4 0.36832
4
Sep-16 109.4 0.8 0.73126
1
Dec-16 110 0.6 0.54545
5
3
Sep-15 108 0.5 0.46296
3
Dec-15 108.4 0.4 0.36900
4
Mar-16 108.2 -0.2 -0.18484
Jun-16 108.6 0.4 0.36832
4
Sep-16 109.4 0.8 0.73126
1
Dec-16 110 0.6 0.54545
5
⊘ This is a preview!⊘
Do you want full access?
Subscribe today to unlock all pages.

Trusted by 1+ million students worldwide

6ECONOMICS ASSIGNMMENT
The inflation rate in 2013 fell in the second quarter from the first quarter by insignificant
amount. In The third quarter the rate increased significantly and then again fell in the fourth
quarter. The year 2014 faced inflation rate at a decreasing rate. The rate of inflation decreased
from March to December. In 2015, the inflation rate was increasing in June from march and
after that it followed a decreasing pattern. The first quarter of 2016 faced negative inflation
and increased till September and in the last quarter the inflation rate was decreasing.
By the end of 2015 the inflation rate was 0.39. The ups and downs in the inflation rate in the
quarters of 2016 made the annual inflation rate become 1.99 %
d) The base year is Dec-2013 where the CPI was 104.8 and the CPI in Mar-2015 is 106.8
Then the rate of inflation is [{(106.8-104.8)/106.8}*100] = 1.87%
It implies the value of Australian dollar has fell by 1.87% in 2015March from the
value it has in Dec-2013. The purchasing power has decreased by 1.87%.
ANSWER 3:
a) Income tax cut is considered as expansionary fiscal policy since less the tax rate
higher is the disposable income. The national income identity explains Consumption
as function of income. More specifically consumption is function of disposable
income that is the income which one receives after making payment for the taxes.
If income tax rate is reduced then people will receive more of the income as less
amount of income will be forgone as tax payment. Since consumption is increasing
function of income, more income implies more consumption demand. More demand
in the market exerts expansionary impact on the economy requiring more production.
Paraphrase This Document
Need a fresh take? Get an instant paraphrase of this document with our AI Paraphraser

AS
AD1
A
D Y
P
7ECONOMICS ASSIGNMMENT
Source (author)
From the equation of Aggregate Demand We know Y = C (Y-T)+ G + i +NX
As t goes down the Y-T component goes up and this enhances the consumption
demand. This shifts the aggregate demand with changed slope. As a result both price
level and income or economic output rises.
b) Due to income tax cut disposable income received by people are more than before.
This enhances the purchasing power of the people who can buy more of goods and
services.
More demand for goods in the market would increase the transaction demand for
money in order to pay for the demand. The level of money supply in economy would
rise. To contract the money supply or keep it under control the Reserve Bank of
Australia would increase the cash rate as measure of contractionary monetary policy

AS
AD1
Y
P
AD
8ECONOMICS ASSIGNMMENT
in order to check the inflationary pressure stemmed from excess demand in the
economy.
If RBA increases the cash rate then people would prefer saving money than spending
as more money is earned from interest payment by holding the cash than spending
which increases the spending. Higher interest payment increases cost of production
and discourages it. There would be a contractionary effect on the entire economic
output.
Source (author)
⊘ This is a preview!⊘
Do you want full access?
Subscribe today to unlock all pages.

Trusted by 1+ million students worldwide
1 out of 9

Your All-in-One AI-Powered Toolkit for Academic Success.
+13062052269
info@desklib.com
Available 24*7 on WhatsApp / Email
Unlock your academic potential
© 2024 | Zucol Services PVT LTD | All rights reserved.