Economics Assignment: Production, Costs, and Market Dynamics Analysis

Verified

Added on  2023/03/31

|13
|1808
|334
Homework Assignment
AI Summary
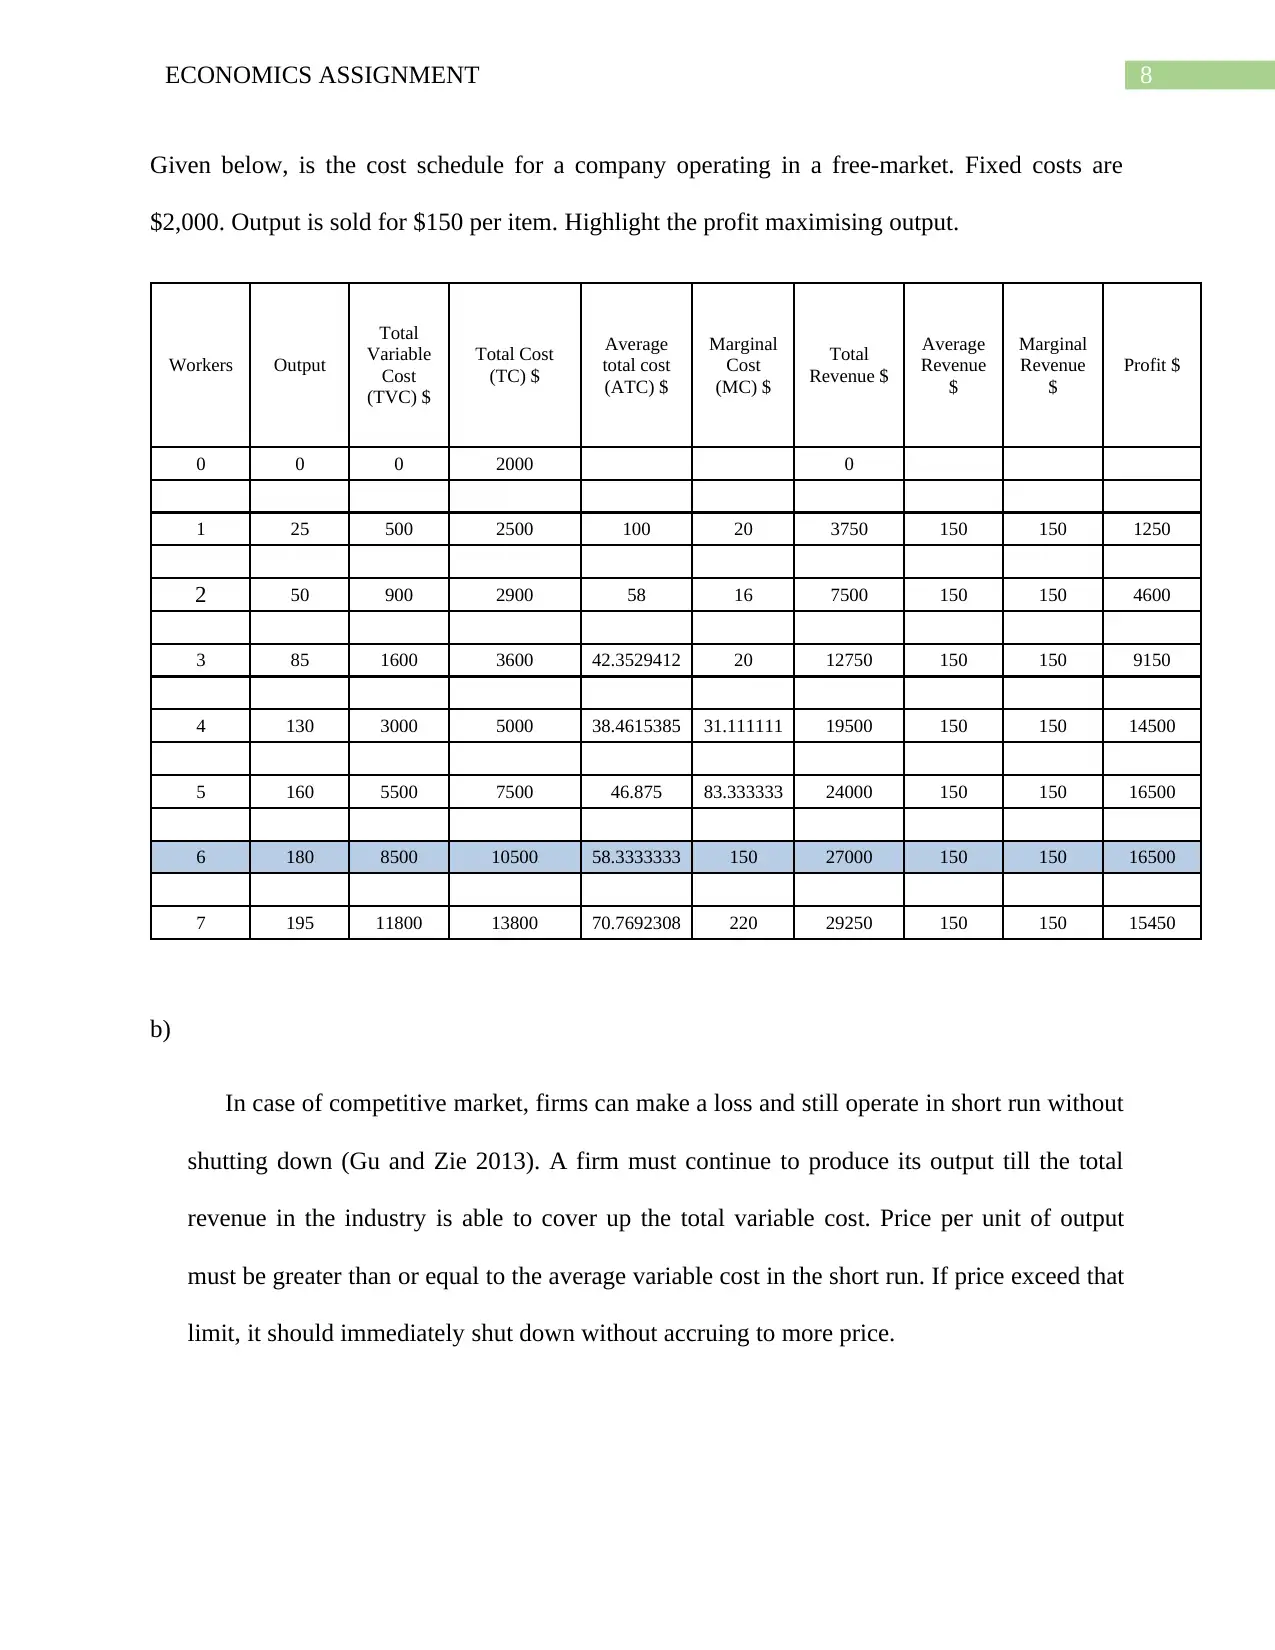
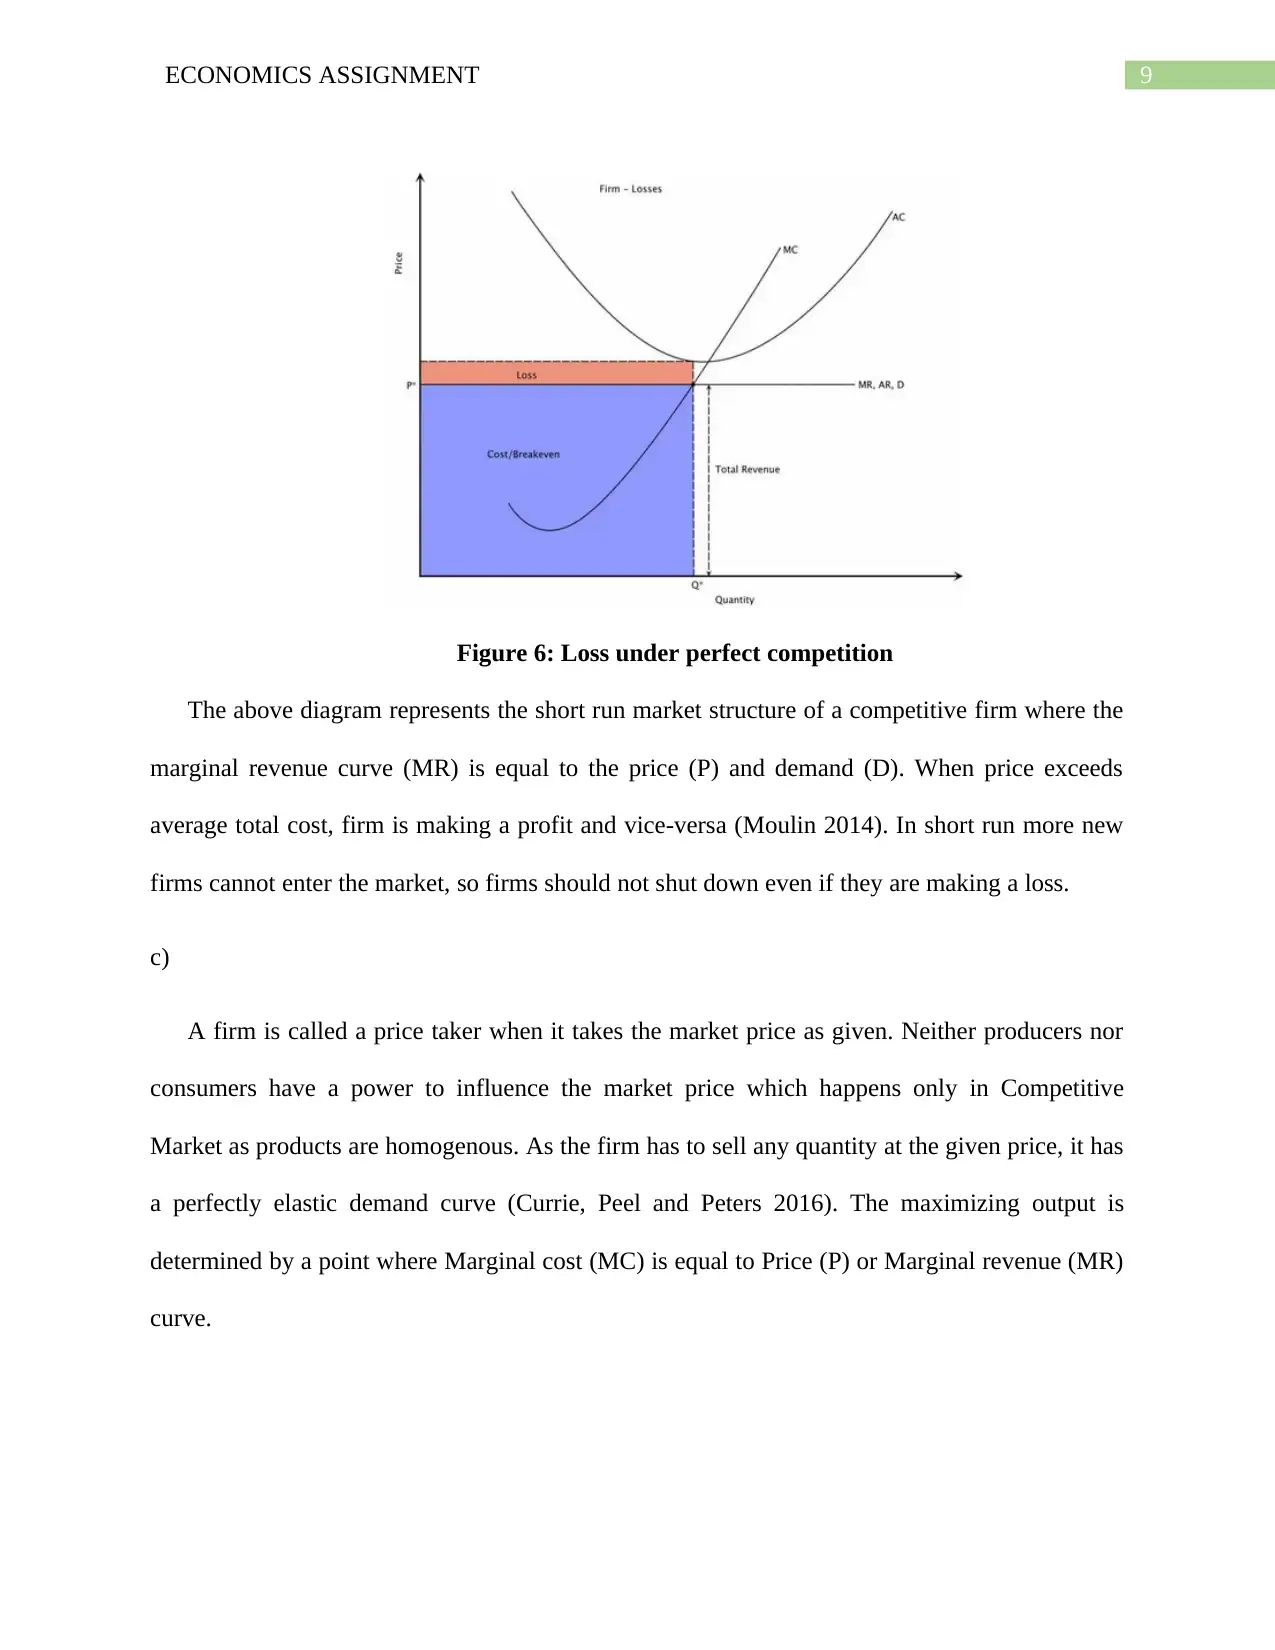
This economics assignment addresses several key concepts. The first question analyzes a production possibility curve, opportunity cost, and efficient resource allocation. The second question examines the impact of technological advancements on the supply and demand of solar-powered motor vehicles and conventional vehicles, including the effects of minimum price. The third question focuses on price elasticity of demand, calculating elasticity values, and assessing the price elasticity of demand for different goods. The fourth question explores cost schedules, profit maximization in a competitive market, and the characteristics of a price-taking firm. The final question delves into market structures, comparing monopoly and perfect competition, and analyzing the Australian banking sector and retail industry.
Document Page
Running Head: ECONOMICS FOR DECISION MAKING
Economics for Decision Making
Name of the Student
Name of the University
Author’s Note
tabler-icon-diamond-filled.svg

Paraphrase This Document

Need a fresh take? Get an instant paraphrase of this document with our AI Paraphraser
Document Page
1ECONOMICS ASSIGNMENT
Table of Contents
Answer 1..........................................................................................................................................2
Answer 2..........................................................................................................................................4
Answer 3..........................................................................................................................................6
Answer 4..........................................................................................................................................7
Answer 5........................................................................................................................................10
Reference List................................................................................................................................11
Document Page
2ECONOMICS ASSIGNMENT
Answer 1
a)i) The Production Possibility Curve of Joan is given below.
0 10 20 30 40 50 60 70 80 90
0
10
20
30
40
50
60
70
Producti on Possibility Curve
Work Hours
Grade (%)
Figure 1: Production Possibility Curve
a)
ii)
Production Possibilities
Grade
(%) Work (hours per week)
Opportunity
cost
A 0 60 0
B 20 55 0.36
C 40 45 0.89
D 60 30 2.00
E 80 0
Opportunity cost is the cost of sacrificing the next best alternative. The production possibility
curve represents the amount of two goods that a person can use at a given amount of time and
money. As the working hours goes down, Joan can put more hours into studies resulting in
Document Page
3ECONOMICS ASSIGNMENT
increased percentage in the grades. Increase in grade percentage of Joan requires sacrifice of
more and more work hours (Calman and Ross 2013). This indicates an increasing opportunity
cost resulting in a concave PPC.
a)iii) If the opportunity cost of Joan increasing her grade was constant regardless of how many hours she
worked, the slope of the Production Possibility Curve(PPC) will be a straight line.
Figure 2: PPC with constant slope
PPC is more likely to be concave in shape indicating the fact of increasing opportunity
cost. Resources used in the production process are not perfect substitutes and therefore, cannot
produce all goods with equal efficiency. As more and more resources shift from one industry to
other the opportunity cost increases making the PPC concave.
a)iv) Points inside the PPF represents that resources are not efficiently used. When resources are
efficiently used, they lie on the PPF. Joan’s combination of her grades and hours of work per week
were below (inside) the curve as resources are inefficiently allocated.
tabler-icon-diamond-filled.svg

Paraphrase This Document

Need a fresh take? Get an instant paraphrase of this document with our AI Paraphraser
Document Page
4ECONOMICS ASSIGNMENT
a)v) In order to push her combination of her grades and hours of work per week past (outside) the PPF,
Joan has to use the resources more efficiently. This would refer to working hard while doing her job as
well as studying more efficiently so as to increase the amount of work done per hour. Efficient allocation
of time into study and work would shift the PPF rightwards.
b) Scarcity means limited resources with unlimited wants. Even though Joan has got a high paying job,
yet she will face the problem of scarcity. Moreover she was unemployed for a year, she is in need of
goods and services (Fine 2016). With the salary she will be allocating her needs, however the problem of
scarcity will again arise once she is satisfied and develops new wants.
Answer 2
a) Continual research in the generation of solar power has reduced the cost of
manufacturing of solar- powered motor vehicles. A reduction in cost of production due to
quality research and adequate technology will give rise to higher supply of motor
vehicles.
Figure 2: Market of solar powered motor vehicles
Document Page
5ECONOMICS ASSIGNMENT
As the production cost goes down, suppliers can make motor vehicles at a lower cost and
supply curve shifts rightward from S to S1 with fixed demand as D. Equilibrium price goes down
from P to P1 and the equilibrium quantity increases from Q to Q1.
b) Fall in equilibrium price of solar motor vehicles leads to increased demand for solar
motor vehicles that will negatively effect on the demand of conventional motor vehicles
(Rader 2014). The demand curve of conventional motor vehicles will shift leftward from
D1 to D2.
Figure 4: Market of conventional motor vehicles
Fall in demand will lead to fall in equilibrium price in the market from P1 to P2. As supply
remains fixed at initial level S (Biggs 2016). Reduction in price will lead to fall in equilibrium
quantity from Q1 to Q2.
c)
Document Page
6ECONOMICS ASSIGNMENT
Figure 5: Impact of setting minimum price
Objective of setting a minimum price is to allow suppliers with a minimal amount of
income. Setting a minimum price implies the product is not allowed to be sold below that price.
Now, if equilibrium price is already above the minimum price, there is no effect of setting the
minimum price. In the above figure, equilibrium price in market is at P* obtained from working
of demand and supply forces (Moulin 2014). If minimum price is set at PM, there is no impact on
the market as equilibrium price is above the minimum price. Therefore, this is not a good idea.
Answer 3
a)
Pric
e ($)
Quantity
demande
d
Total
revenu
e ($)
Percen
t
change
in price
Percentag
e change
in
quantity
demanded
Elasticit
y value
Assessmen
t of
Elasticity
1 40 40
1.5 34 51 40.00% -16.22% -0.41 Relatively
inelastic
tabler-icon-diamond-filled.svg

Paraphrase This Document

Need a fresh take? Get an instant paraphrase of this document with our AI Paraphraser
Document Page
7ECONOMICS ASSIGNMENT
2 28 56 28.57% -19.35% -0.68 Relatively
inelastic
2.5 22 55 22.22% -24.00% -1.08 Relatively
elastic
3 16 48 18.18% -31.58% -1.74 Relatively
elastic
3.5 10 35 15.38% -46.15% -3.00 Relatively
elastic
b)
The price elasticity of demand is defined as the percentage change in the quantity demanded
by the percentage change in price. In summer, the demand for ice-cream is relatively inelastic as
compared to that of winter which means quantity demanded of the good is high irrespective of
low or high price (Chen and Schwartz 2013). In winter the demand for ice-cream is
comparatively low such that it will be highly elastic to price.
c)
Demand for cigarettes is highly inelastic to price. Smoking becomes an addiction and
people affected by the habit are unable to refrain from it. A hike in price does not have any effect
on its users, as they continue to buy it any given price.
Answer 4
a)
Document Page
8ECONOMICS ASSIGNMENT
Given below, is the cost schedule for a company operating in a free-market. Fixed costs are
$2,000. Output is sold for $150 per item. Highlight the profit maximising output.
Workers Output
Total
Variable
Cost
(TVC) $
Total Cost
(TC) $
Average
total cost
(ATC) $
Marginal
Cost
(MC) $
Total
Revenue $
Average
Revenue
$
Marginal
Revenue
$
Profit $
0 0 0 2000 0
1 25 500 2500 100 20 3750 150 150 1250
2 50 900 2900 58 16 7500 150 150 4600
3 85 1600 3600 42.3529412 20 12750 150 150 9150
4 130 3000 5000 38.4615385 31.111111 19500 150 150 14500
5 160 5500 7500 46.875 83.333333 24000 150 150 16500
6 180 8500 10500 58.3333333 150 27000 150 150 16500
7 195 11800 13800 70.7692308 220 29250 150 150 15450
b)
In case of competitive market, firms can make a loss and still operate in short run without
shutting down (Gu and Zie 2013). A firm must continue to produce its output till the total
revenue in the industry is able to cover up the total variable cost. Price per unit of output
must be greater than or equal to the average variable cost in the short run. If price exceed that
limit, it should immediately shut down without accruing to more price.
Document Page
9ECONOMICS ASSIGNMENT
Figure 6: Loss under perfect competition
The above diagram represents the short run market structure of a competitive firm where the
marginal revenue curve (MR) is equal to the price (P) and demand (D). When price exceeds
average total cost, firm is making a profit and vice-versa (Moulin 2014). In short run more new
firms cannot enter the market, so firms should not shut down even if they are making a loss.
c)
A firm is called a price taker when it takes the market price as given. Neither producers nor
consumers have a power to influence the market price which happens only in Competitive
Market as products are homogenous. As the firm has to sell any quantity at the given price, it has
a perfectly elastic demand curve (Currie, Peel and Peters 2016). The maximizing output is
determined by a point where Marginal cost (MC) is equal to Price (P) or Marginal revenue (MR)
curve.
tabler-icon-diamond-filled.svg

Paraphrase This Document

Need a fresh take? Get an instant paraphrase of this document with our AI Paraphraser
Document Page
10ECONOMICS ASSIGNMENT
Figure 7: Profit maximizing output level for a price taking firm
In figure 7, profit maximizing output level of the firm corresponds to Q* obtained from
two conditions price equals marginal cost and marginal cost curve cuts the marginal revenue
from below.
Answer 5
A monopoly is a market structure with only one sellers and many buyers and they
regulate the market price due to sell of a unique product. Whereas a perfect competition is a
structure with many buyers and sellers selling homogenous products. The Australian Banking
sector comprises of four major banks naming National Australian Bank, Australia and New
Zealand Banking Group, Common Wealth Bank of Australia and Westpac Banking Corporation.
They dominate the economy and entry of new organisations are very difficult due to risk and
investment of huge amount of capital and legal documents. The structure is closer to Monopoly
market.
Document Page
11ECONOMICS ASSIGNMENT
People are forced to abide by the limited services provided by such banks and dominated
by a higher price. Barriers to new firms prevent banks to do quality research and develop new
financial strategies to help people financially (McKenzie and Lee 2016). They operate at a high
rate of interest and consumers are left to work with that.
Another industry that works like the banking industry is the retail industry. Giant
Companies namely Coles and Woolworth have captured the market making it impossible for
small firms to sustain in the market and earn profit. For this unfair competitiveness, the
Australian economy is suffering negatively from a dead weight loss procuring to losses in the
long run (Sarafopoulos 2015).
chevron_up_icon
1 out of 13
circle_padding
hide_on_mobile
zoom_out_icon
[object Object]