BUS114: Economics Assignment: Market Equilibrium and Business Cycles
VerifiedAdded on 2020/04/07
|10
|1133
|278
Homework Assignment
AI Summary
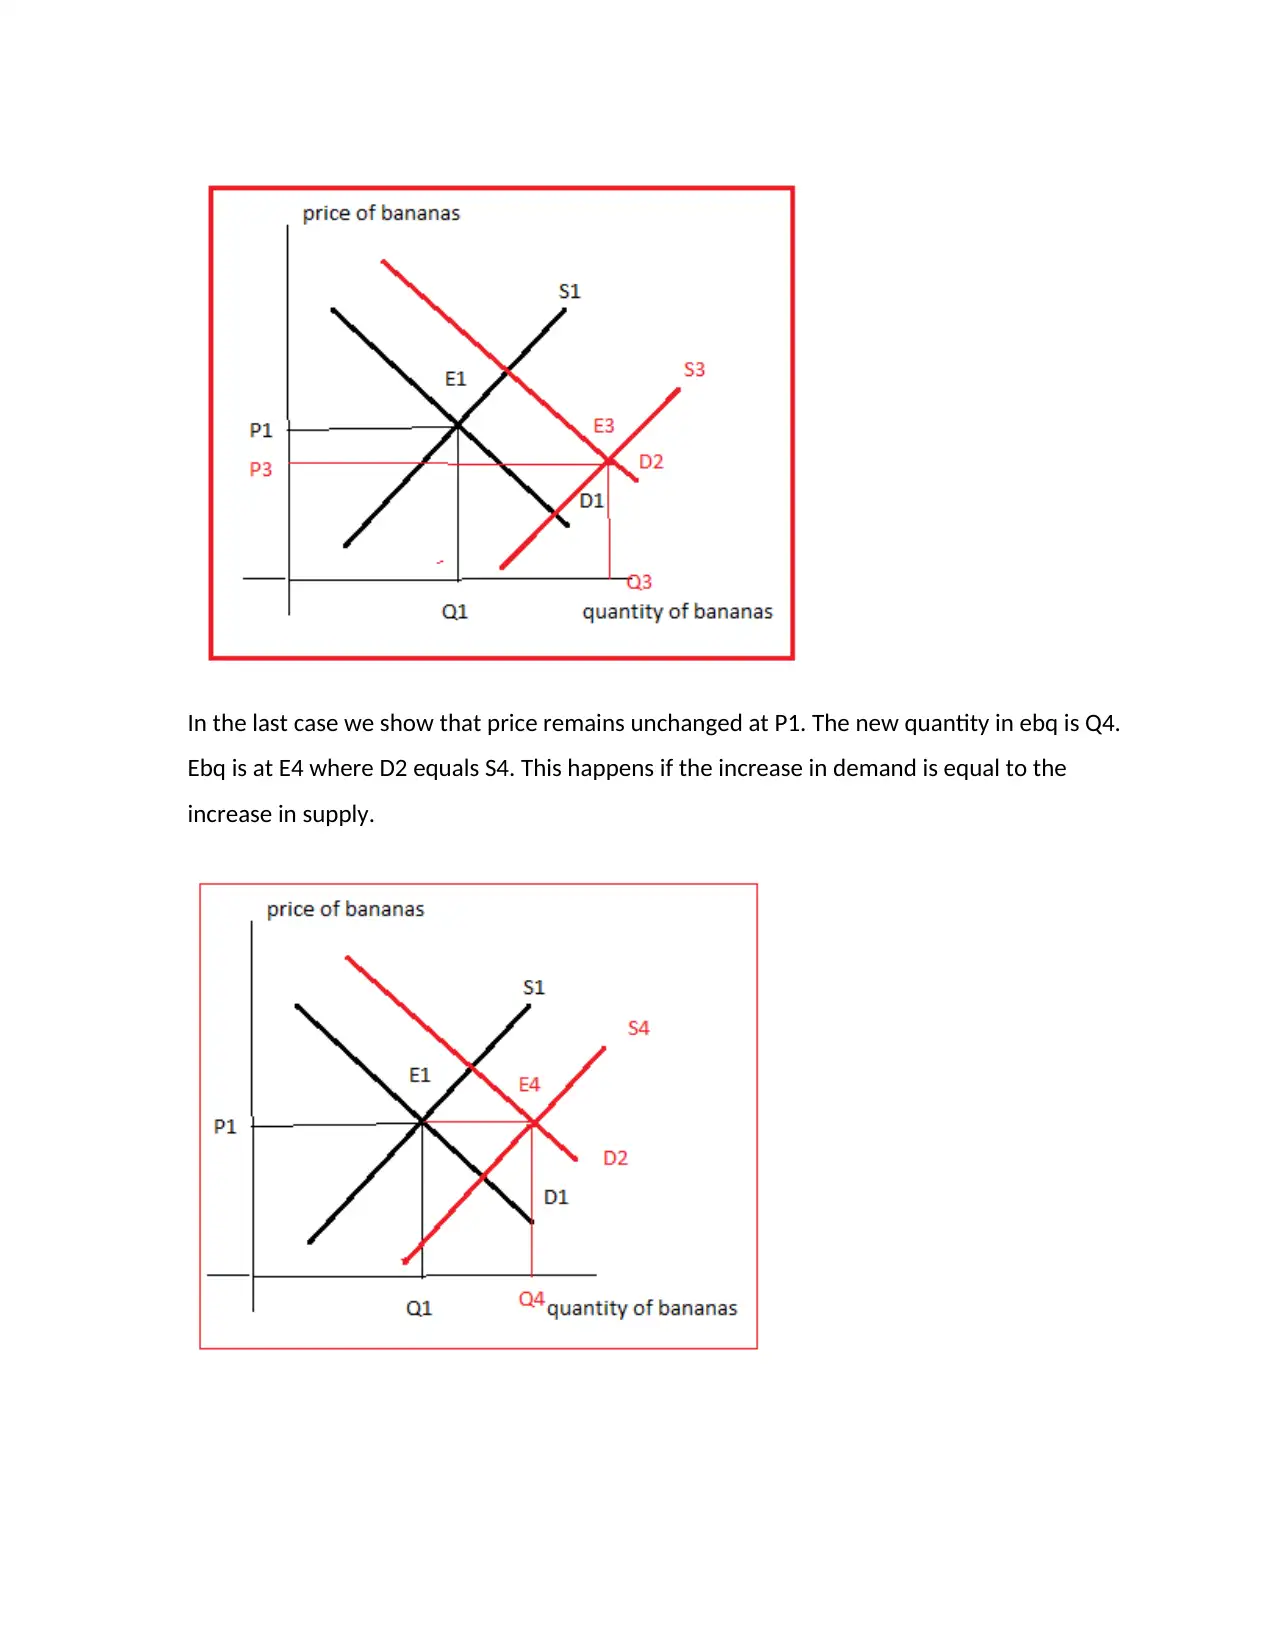
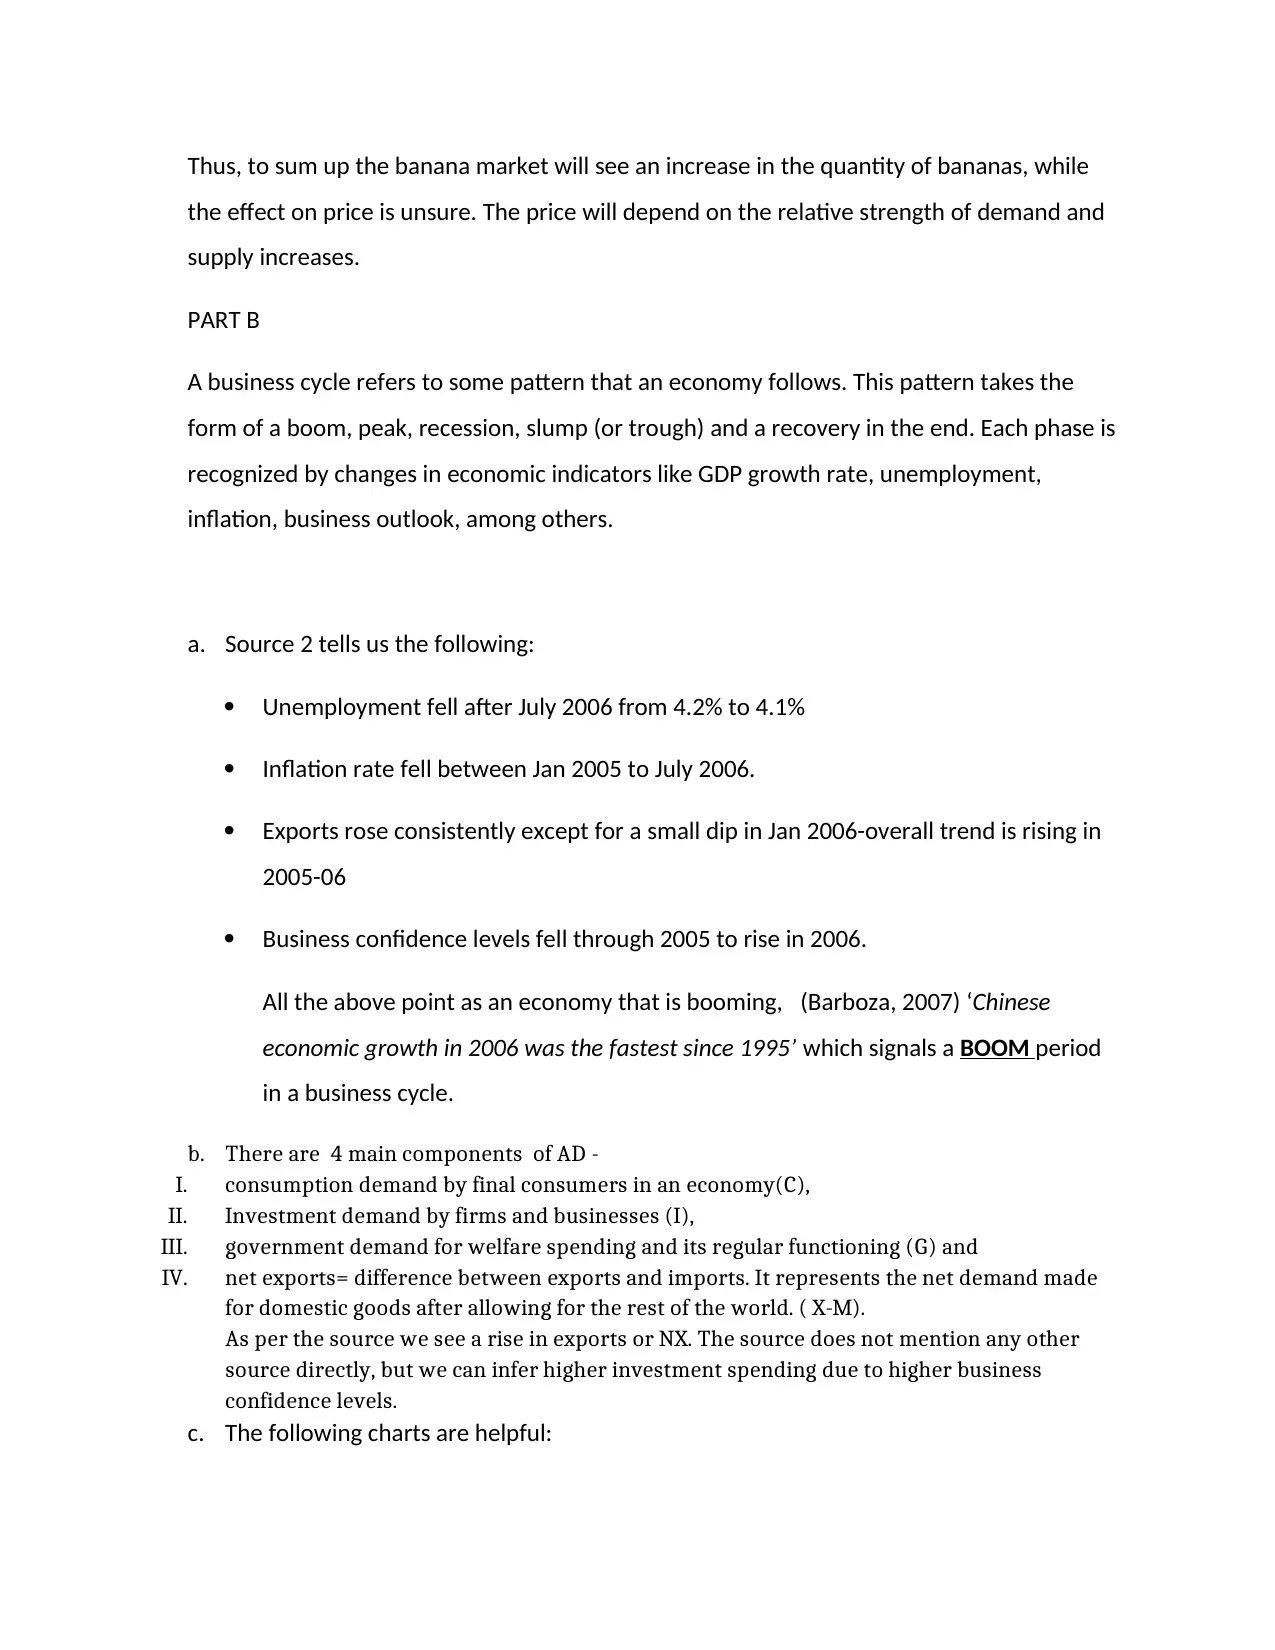
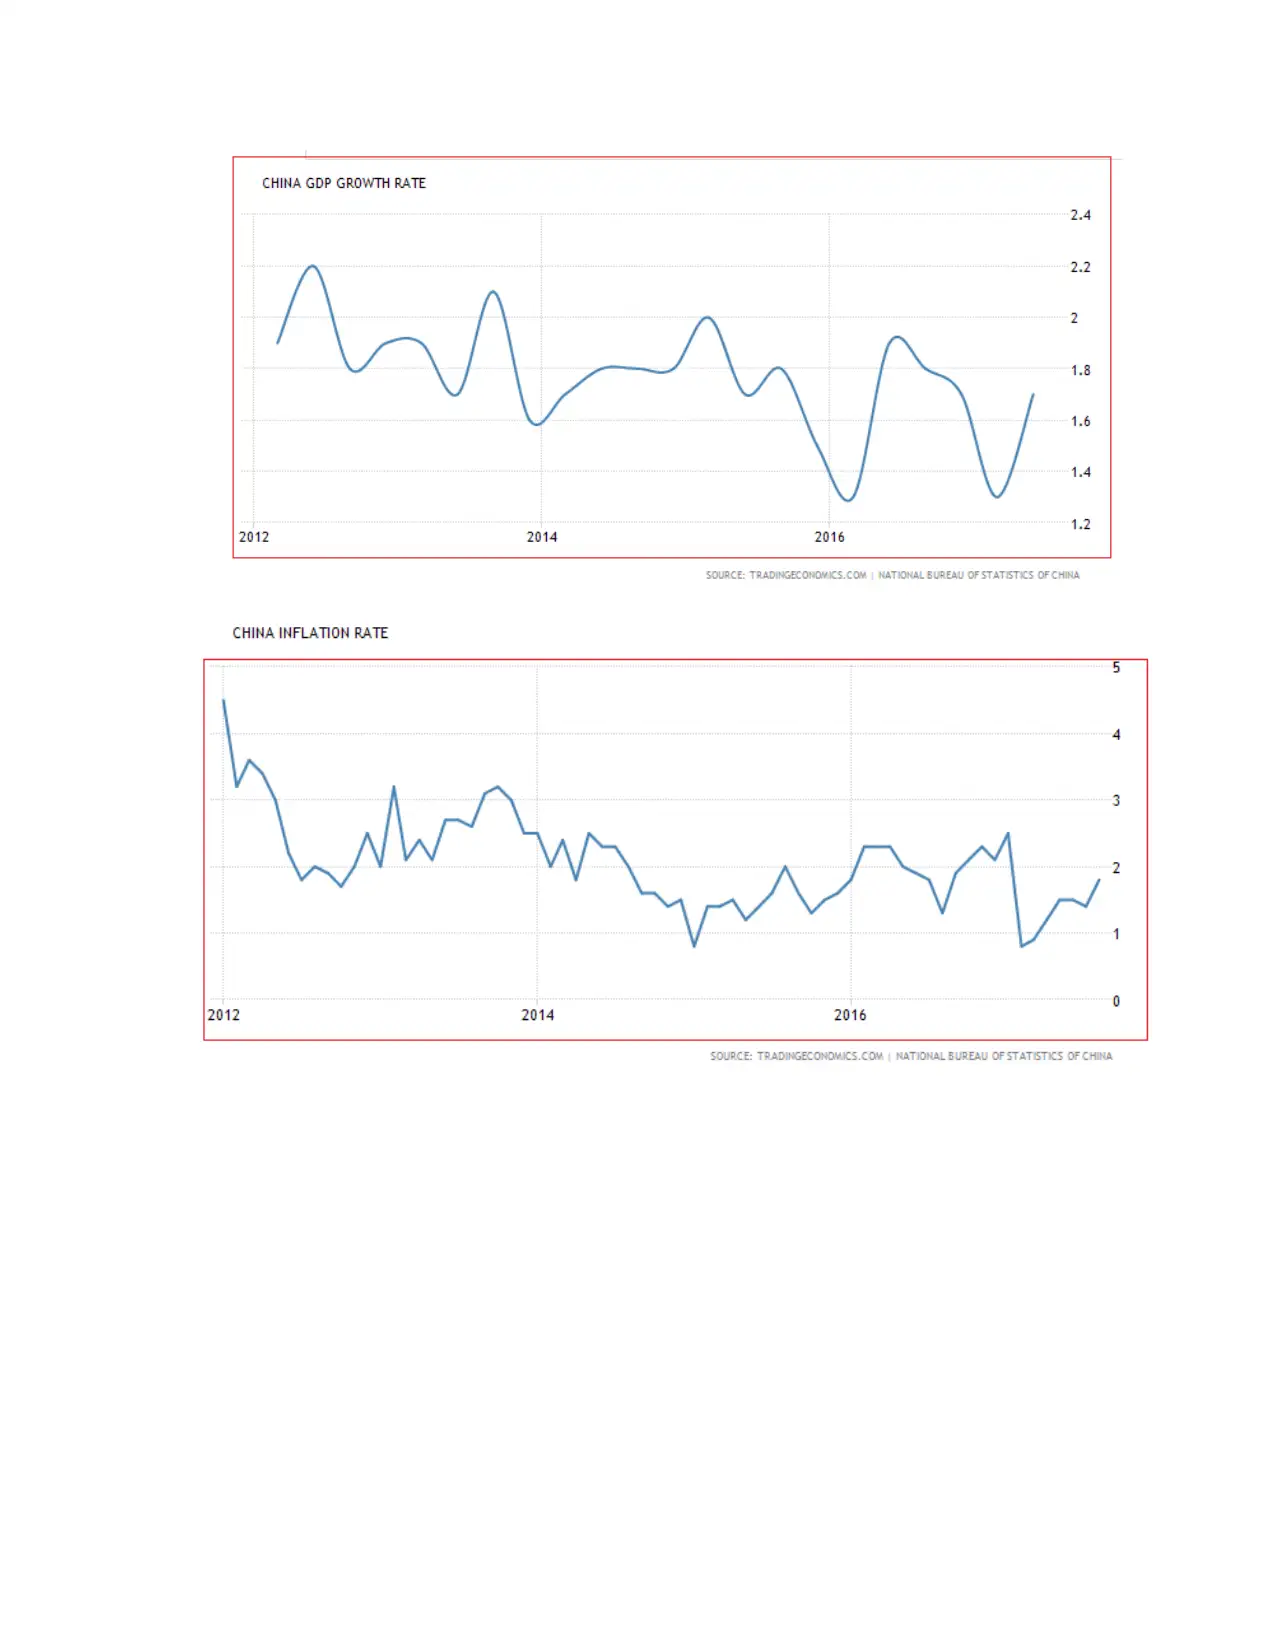
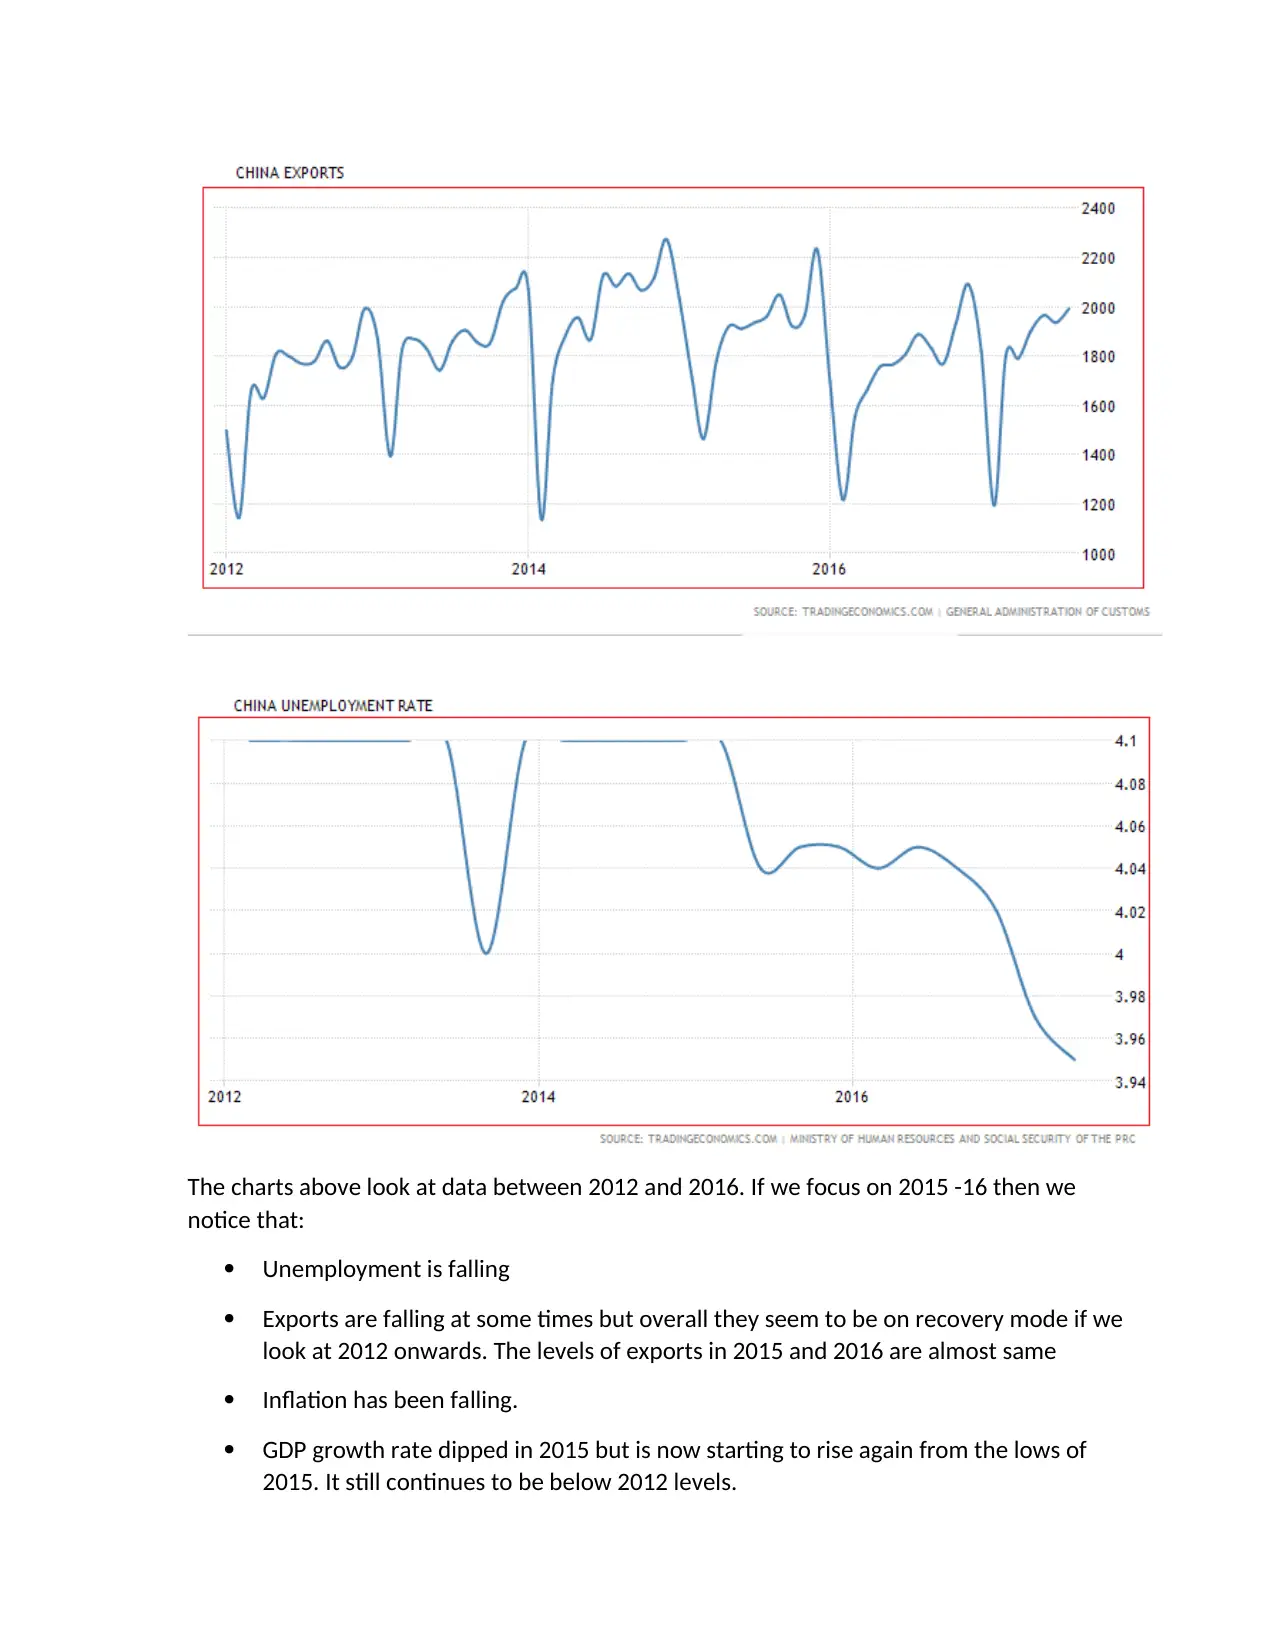
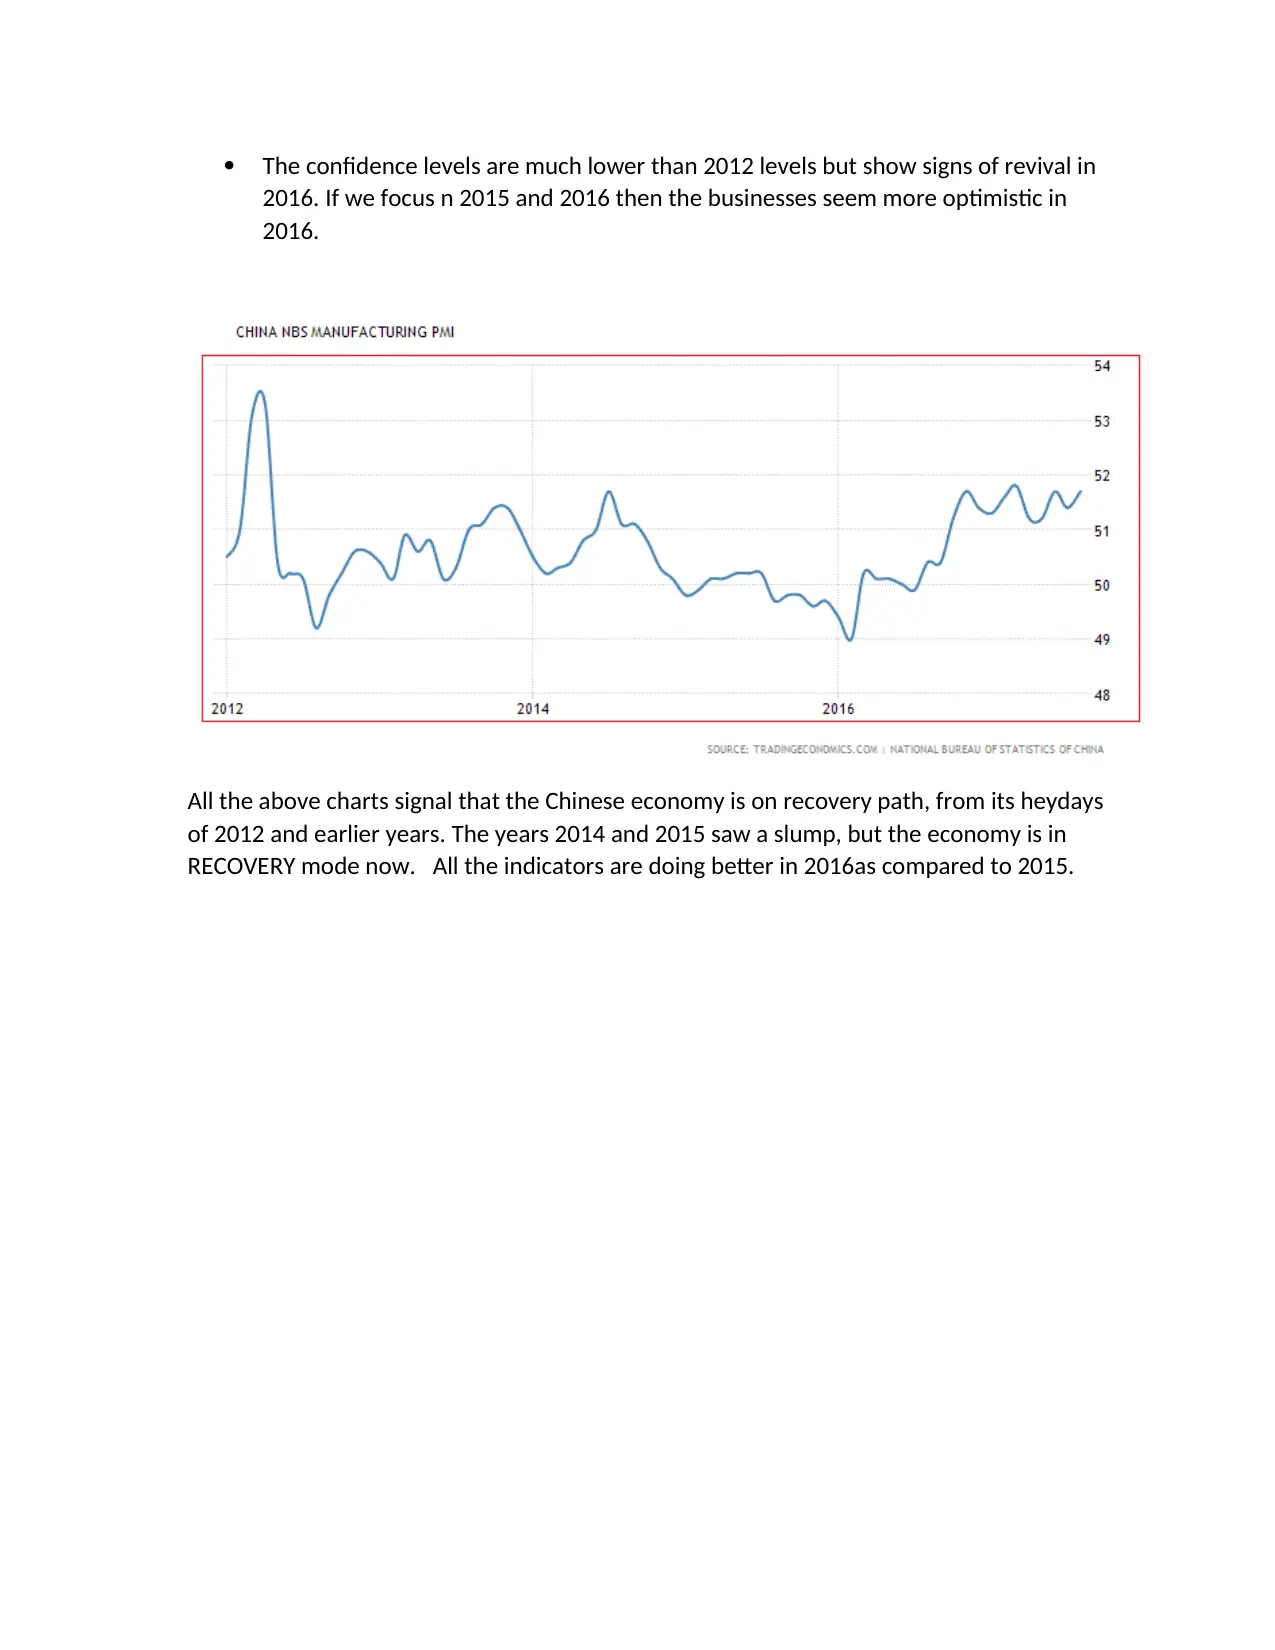
This economics assignment, focusing on BUS114, explores market equilibrium, supply and demand dynamics, and business cycles. Part A analyzes market equilibrium shifts due to changes in demand, illustrating the impact on price and quantity. Part B delves into business cycles, examining econom...
Read More
Contribute Materials
Your contribution can guide someone’s learning journey. Share your
documents today.

Subject Code: BUS114
Subject Name: Introduction to Economics
Student Name:
Subject Name: Introduction to Economics
Student Name:
Secure Best Marks with AI Grader
Need help grading? Try our AI Grader for instant feedback on your assignments.

PART A
Q1
a.
P
Q
demanded Q supplied
200 1000 2500
180 1200 2200
160 1400 1900
140 1600 1600
120 1800 1300
100 2000 1000
b. Now we have a new quantity demanded at each price level. We keep price same but
demand is 500 + old quantity demanded. So at a price of $200 we had demand for 1000
units, which is now raised to 1500. The new Q dd = 500+Q demanded at each price
point. The new equilibrium is now shown in blue color in the table below. Equilibrium
quantity = 1900 and ebq price is $160. Thus both price and quantity have risen due to
new demand.
Equilibrium point
Equilibrium quantity= 1600
Equilibrium price=140

P
Q
demanded Q supplied
new Q
dd
200 1000 2500 1500
180 1200 2200 1700
160 1400 1900 1900
140 1600 1600 2100
120 1800 1300 2300
100 2000 1000 2500
Q2
The market for bananas is shown as a downward sloping demand curve D1 while the supply
curve S1 is upward sloping. Equilibrium is at E1 where demand equals supply ebq price is P1
an ebq quantity is Q1. We now trace the effects of the two events- a rise in income levels
and more banana suppliers.

Income increase affects the demand side of the market. There is an expansion in demand so
that demand curve shifts to right from D1 to D2. On its own this causes a shortage at old
priceP1 so that we more sellers are willing to sell now.
More suppliers affects the supply side of the market. There is an expansion in supply, which
shifts the supply curve down from S1 to S2. On its own this will cause price to fall while
quantity to rise.
Since both events are simultaneous, we can be sure that quantity increase from Q1, but
e=the effect on price is unsure. We show 3 scenarios below.
In the first case we show that price has risen to P2. The new ebq is found at E2 where D2
equals S2. This happens if the increase in demand is stronger than increase in supply
In the second case we show that price has fallen to P3. The new ebq is found at E3 where
D2 equals S3. This happens if the increase in demand is weaker than increase in supply
Secure Best Marks with AI Grader
Need help grading? Try our AI Grader for instant feedback on your assignments.

In the last case we show that price remains unchanged at P1. The new quantity in ebq is Q4.
Ebq is at E4 where D2 equals S4. This happens if the increase in demand is equal to the
increase in supply.
Ebq is at E4 where D2 equals S4. This happens if the increase in demand is equal to the
increase in supply.

Thus, to sum up the banana market will see an increase in the quantity of bananas, while
the effect on price is unsure. The price will depend on the relative strength of demand and
supply increases.
PART B
A business cycle refers to some pattern that an economy follows. This pattern takes the
form of a boom, peak, recession, slump (or trough) and a recovery in the end. Each phase is
recognized by changes in economic indicators like GDP growth rate, unemployment,
inflation, business outlook, among others.
a. Source 2 tells us the following:
Unemployment fell after July 2006 from 4.2% to 4.1%
Inflation rate fell between Jan 2005 to July 2006.
Exports rose consistently except for a small dip in Jan 2006-overall trend is rising in
2005-06
Business confidence levels fell through 2005 to rise in 2006.
All the above point as an economy that is booming, (Barboza, 2007) ‘Chinese
economic growth in 2006 was the fastest since 1995’ which signals a BOOM period
in a business cycle.
b. There are 4 main components of AD -
I. consumption demand by final consumers in an economy(C),
II. Investment demand by firms and businesses (I),
III. government demand for welfare spending and its regular functioning (G) and
IV. net exports= difference between exports and imports. It represents the net demand made
for domestic goods after allowing for the rest of the world. ( X-M).
As per the source we see a rise in exports or NX. The source does not mention any other
source directly, but we can infer higher investment spending due to higher business
confidence levels.
c. The following charts are helpful:

Paraphrase This Document
Need a fresh take? Get an instant paraphrase of this document with our AI Paraphraser

The charts above look at data between 2012 and 2016. If we focus on 2015 -16 then we
notice that:
Unemployment is falling
Exports are falling at some times but overall they seem to be on recovery mode if we
look at 2012 onwards. The levels of exports in 2015 and 2016 are almost same
Inflation has been falling.
GDP growth rate dipped in 2015 but is now starting to rise again from the lows of
2015. It still continues to be below 2012 levels.

The confidence levels are much lower than 2012 levels but show signs of revival in
2016. If we focus n 2015 and 2016 then the businesses seem more optimistic in
2016.
All the above charts signal that the Chinese economy is on recovery path, from its heydays
of 2012 and earlier years. The years 2014 and 2015 saw a slump, but the economy is in
RECOVERY mode now. All the indicators are doing better in 2016as compared to 2015.

Angeltos, G.M. & Lian, C., 2016. A theory of Aggregate demand channel. [Online] Available at:
https://economics.mit.edu/files/12527 [Accessed 19 Sep 2017].
Barboza, D., 2007. Nytimes.com. [Online] Available
athttp://www.nytimes.com/2007/01/25/business/worldbusiness/25iht-yuan.4345858.html?
mcubz=1 [Accessed 26 sep 2017].
people.uleth.ca, n.d. AD-AS approach. [Online] Available at:
http://people.uleth.ca/~richard.mueller/MacroChap09.pdf [Accessed 25 Sep 2017].
1 out of 10
Related Documents

Your All-in-One AI-Powered Toolkit for Academic Success.
+13062052269
info@desklib.com
Available 24*7 on WhatsApp / Email
Unlock your academic potential
© 2024 | Zucol Services PVT LTD | All rights reserved.