Economics Assignment: Analyzing Demand, Supply, and Market Structures
VerifiedAdded on 2022/12/12
|9
|1142
|20
Homework Assignment
AI Summary
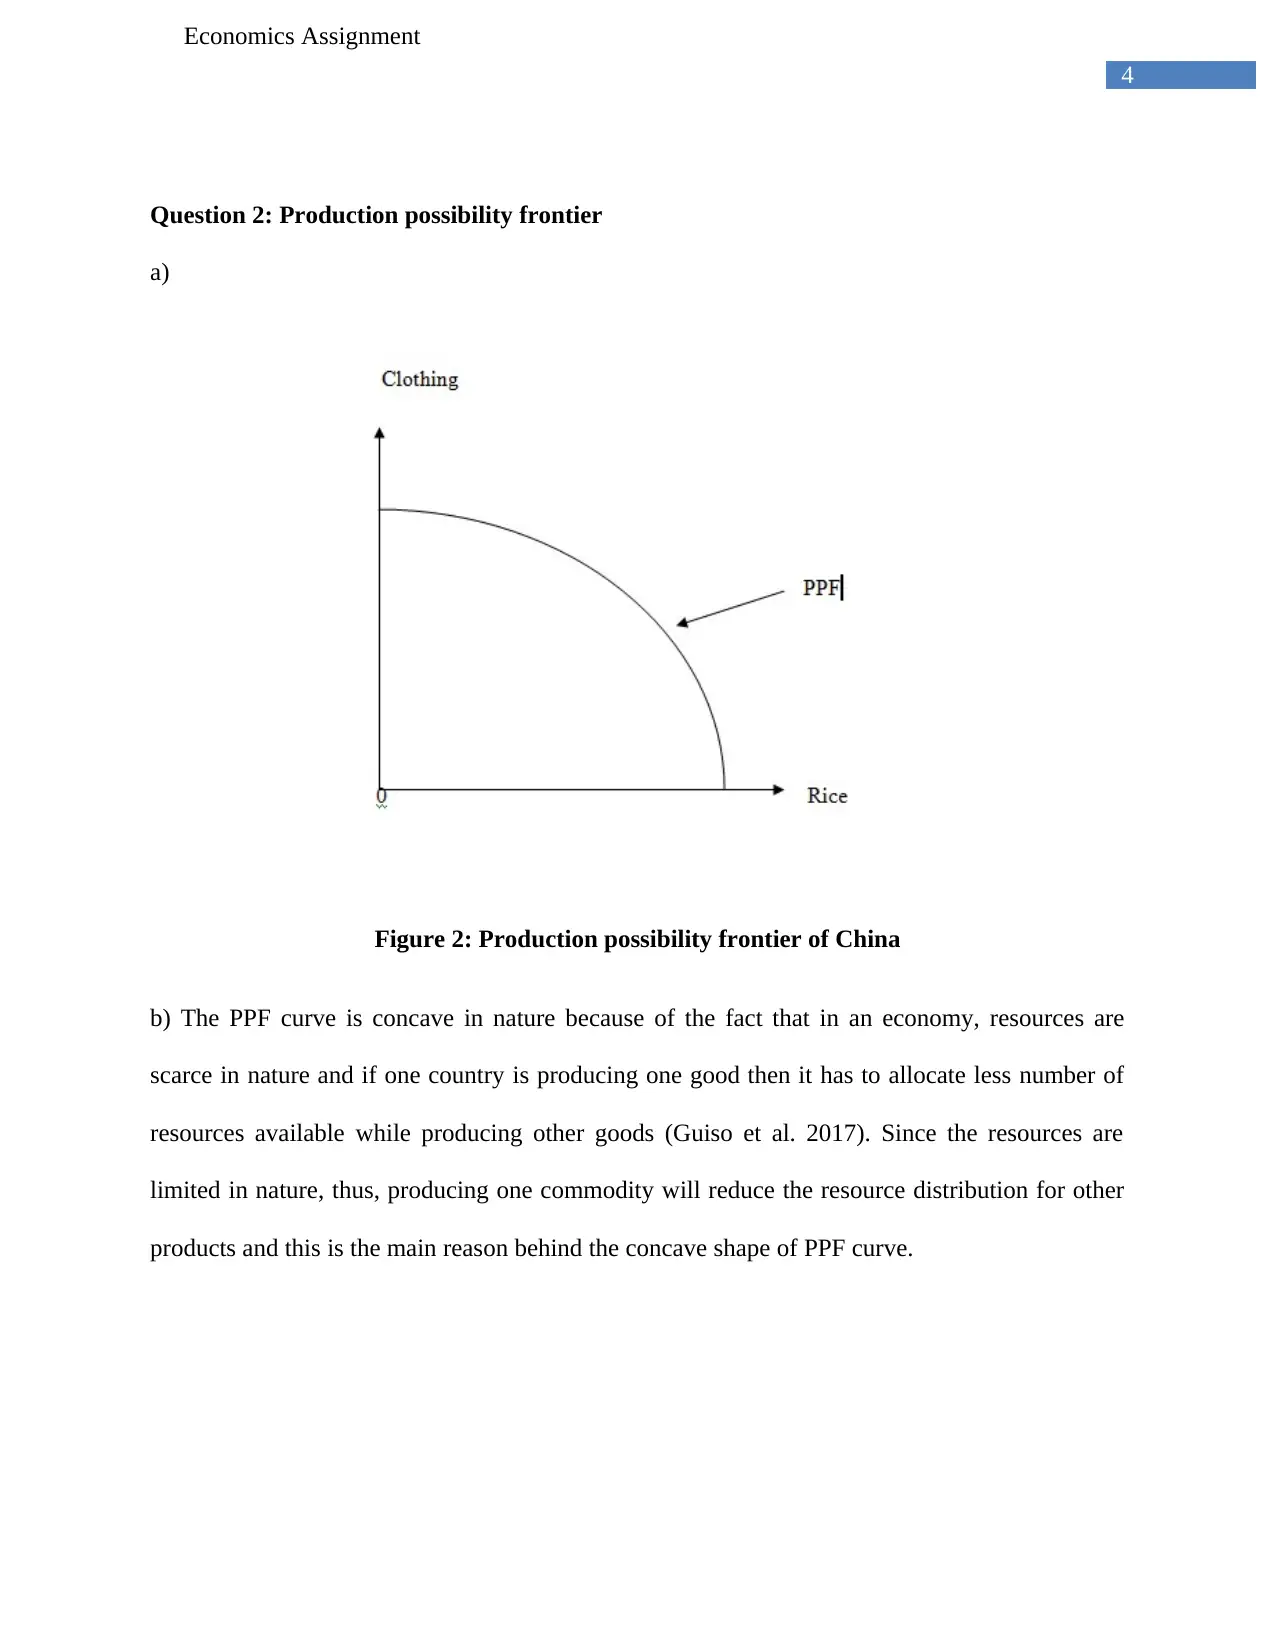
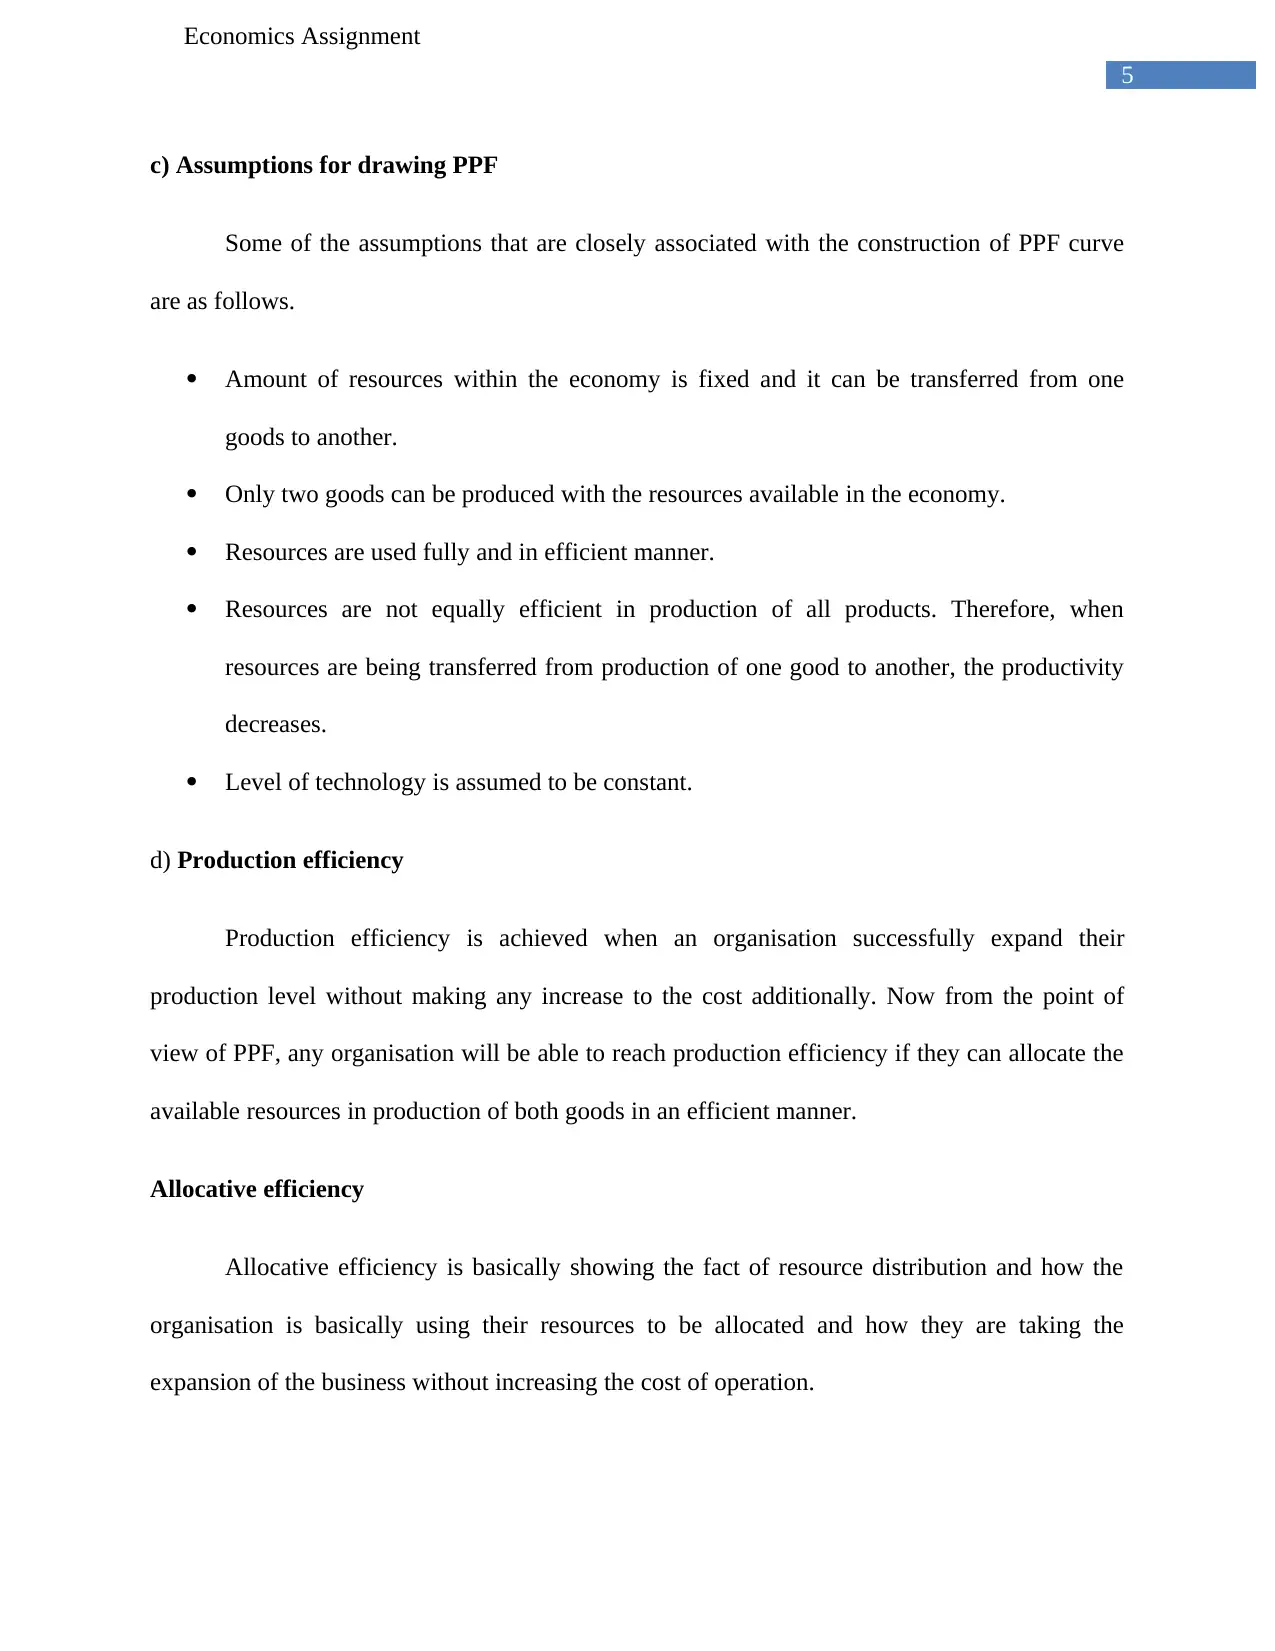
This economics assignment delves into fundamental economic principles. It begins with an analysis of demand and supply, calculating equilibrium price and quantity, and illustrating these concepts graphically. The assignment then explores the production possibility frontier (PPF), examining its shape, assumptions, and the concepts of production and allocative efficiency. The final section focuses on market structures, specifically perfect competition, using the coffee market as a case study. It discusses the impact of consumer demand, long-run profits, and government subsidies. The assignment includes calculations of consumer and producer surplus, price elasticity of demand, and provides a concise overview of key economic concepts. The assignment provides graphical representations of the concepts to make it easier to understand.

Running head: Economics Assignment
Economics Assignment
Name of student
Course name
Economics Assignment
Name of student
Course name
Paraphrase This Document
Need a fresh take? Get an instant paraphrase of this document with our AI Paraphraser

1
Economics Assignment
Table of Contents
Question 1: Demand and supply......................................................................................................3
Question 2: Production possibility frontier......................................................................................5
Question 3: Market structure...........................................................................................................7
Reference list...................................................................................................................................9

2
Economics Assignment
Question 1: Demand and supply
a) Demand curve of the apricot is given by P=200-0.4Q-------- (i) and the supply function of
the apricot is given by P=20+0.5Q--------- (ii) where p is the price of apricot and Q is the
quantity of the apricot. Now in order to determine the equilibrium price and quantity of
apricot we must equate demand and supply equation thus
200-0.4q= 20+0.5q or 0.9q = 180 or Q = 180/0.9 = 200. Now putting the value of the Q in
the above equation no (ii) we get P = 120
b) In order to draw the demand and supply diagram from the equation of demand and supply
it is important to identify the initial point from where the supply and demand graph are
going to start. In the demand function, if we plot Q= 0 then we will get P=200 and when
p= 0 then the Q is 200/0.4=500. Now in order to determine the supply curve we are
plotting P= 200 in the supply function and getting Q= 360. Thus there is excess demand
within the economy
0 100 200 300 400 500 600
0
50
100
150
200
250
300
350
400
Supply
Demand
Quantity
P
r
i
c
e
⊘ This is a preview!⊘
Do you want full access?
Subscribe today to unlock all pages.

Trusted by 1+ million students worldwide

3
Economics Assignment
Figure 1: Demand and Supply curve
(Source: Created by author)
c) In order to determine the consumer surplus and producer surplus, the formula of area of
triangle is being used. Area of triangle is ½ *base*height. Consumer surplus is
½*200*100= 1000 and the producer surplus is ½*50*200= 500. The area of the triangle
above the equilibrium point is consumer surplus and the below triangle is producer
surplus.
d) Price elasticity of demand at equilibrium price and quantity is
Price elasticity of demand at equilibrium price and quantity is (500-200)/500*100/(200-
120)/200*100 or PED =60/40 = 1.5
e) Since the price elasticity of demand is 1.5 thus increase in price by 10% will reduce the
demand of apricot by 1.5%. When the price is increased by 10% or by 12 the quantity
demanded reduces to 78, whereas the previous quantity was 200 units at 120/unit. Thus
reducing the total revenue of apricot suppliers.
Paraphrase This Document
Need a fresh take? Get an instant paraphrase of this document with our AI Paraphraser

4
Economics Assignment
Question 2: Production possibility frontier
a)
Figure 2: Production possibility frontier of China
b) The PPF curve is concave in nature because of the fact that in an economy, resources are
scarce in nature and if one country is producing one good then it has to allocate less number of
resources available while producing other goods (Guiso et al. 2017). Since the resources are
limited in nature, thus, producing one commodity will reduce the resource distribution for other
products and this is the main reason behind the concave shape of PPF curve.

5
Economics Assignment
c) Assumptions for drawing PPF
Some of the assumptions that are closely associated with the construction of PPF curve
are as follows.
Amount of resources within the economy is fixed and it can be transferred from one
goods to another.
Only two goods can be produced with the resources available in the economy.
Resources are used fully and in efficient manner.
Resources are not equally efficient in production of all products. Therefore, when
resources are being transferred from production of one good to another, the productivity
decreases.
Level of technology is assumed to be constant.
d) Production efficiency
Production efficiency is achieved when an organisation successfully expand their
production level without making any increase to the cost additionally. Now from the point of
view of PPF, any organisation will be able to reach production efficiency if they can allocate the
available resources in production of both goods in an efficient manner.
Allocative efficiency
Allocative efficiency is basically showing the fact of resource distribution and how the
organisation is basically using their resources to be allocated and how they are taking the
expansion of the business without increasing the cost of operation.
⊘ This is a preview!⊘
Do you want full access?
Subscribe today to unlock all pages.

Trusted by 1+ million students worldwide

6
Economics Assignment
e) Improvement in technology
Improvement in the technology will make China to increase their production without
reducing the cost of operation. Now with the improvement in the technology will help the PPF
curve to bow down more inward making more resources available for the manufacture of
clothing.
Figure 3: Changes in PPF curve
Question 3: Market structure
a) According to the situation, the market of coffee is the perfect competition within the market of
Australia. The firms within the Australian coffee market is price takers as inspite of making
coffee they are taking price of coffee that is being available within the industry.
Paraphrase This Document
Need a fresh take? Get an instant paraphrase of this document with our AI Paraphraser

7
Economics Assignment
b) Over the next 10 years, the recent pop up of coffee cafes is possible as the demand of the
consumers are increasing by huge margin. The market is being competitive in nature as the
people are not liking instant coffee. Now in order to indulge the development of price
competition within the industry, it has been seen that people are demanding more amount of
espresso.
c) In the long run, firms will be getting profit and the profit will be positive economic profit as
the invisible hand will operate. More amounts of demand and supply will allow the price to be
stable and will definitely allow better level of resources.
d) Impact of government subsidy on the coffee industry will be helpful for the development of
industry and will be able to indulge better level of profit.

8
Economics Assignment
Reference list
Guiso, L., Herrera, H., Morelli, M. and Sonno, T., 2017. Demand and supply of populism.
London, UK: Centre for Economic Policy Research.
Vassall, A., Mangham‐Jefferies, L., Gomez, G.B., Pitt, C. and Foster, N., 2016. Incorporating
demand and supply constraints into economic evaluations in low‐income and middle‐income
countries. Health economics, 25, pp.95-115.
⊘ This is a preview!⊘
Do you want full access?
Subscribe today to unlock all pages.

Trusted by 1+ million students worldwide
1 out of 9
Related Documents

Your All-in-One AI-Powered Toolkit for Academic Success.
+13062052269
info@desklib.com
Available 24*7 on WhatsApp / Email
Unlock your academic potential
Copyright © 2020–2025 A2Z Services. All Rights Reserved. Developed and managed by ZUCOL.