Economics Assignment: Supply, Demand, Elasticity, and Inflation
VerifiedAdded on 2023/01/06
|9
|2491
|40
Homework Assignment
AI Summary
This economics assignment addresses fundamental economic principles through five key questions. The first question examines supply and demand dynamics during the COVID-19 pandemic, focusing on shifts in demand for essential goods and the inflexibility of supply chains. The second question delves into price elasticity, explaining its significance in determining product pricing and revenue maximization. The third question explores long-run and short-run average costs, illustrating the relationship between LRAC and SRAC curves, and the impact of production technologies. The fourth question analyzes economic growth in high, middle, and low-income countries, discussing convergence trends and the roles of capital and technology. The fifth question focuses on inflation, particularly the Consumer Price Index (CPI), and examines substitution and quality biases in measuring the cost of living. The assignment draws on various economic concepts and theories to provide a comprehensive understanding of these topics.

Individual Assessment
Paraphrase This Document
Need a fresh take? Get an instant paraphrase of this document with our AI Paraphraser
Question 1........................................................................................................................................2
Question 2........................................................................................................................................3
Question 3........................................................................................................................................4
Question 4........................................................................................................................................6
Question 5........................................................................................................................................7
REFERENCES................................................................................................................................9
1
Question 1
This relates in to the fundamental theory of supply and demand. The demand for cooking
materials spiked like flour, rice, pasta, toilet paper etc. due to lockdown and people staying at
home cooked more. More importantly, it concerns the design of centralized food delivery
networks oriented to industrial instead of retail supply. The inflexibility of these networks
highlights a central problem in discussion on food production that is; inherent rights have access
to healthy food (Shortage of household items, 2020). This isn't just about how often food is
made; it's about how it's delivered. Supermarket scarcity of toilet paper or pasta were largely due
to an increase in demand driven by panic-saving and storing, including a supply chain lag
designed to deliver just enough stock to shops to avoid holding cheap but bulky inventories. As
the stock vanished from the store shelves, other customers, fearful of being left short, also started
buying more than they would usually have.
Responding to this increase in demand and growing supply, manufacturer typically took
roughly a month to react (Akgün and et.al., 2019). But the change in habits of consumption
would be a less-discussed aspect of the issue, as home-stay regulations led to a decrease in the
demand for toilet paper from public places and workplaces facilities and a rise in home demand.
The toilet paper which industrial consumers like is different from what people purchase for itself.
Throughout the case of flour, the division between the production of retail and commercial
demand was an even more important factor. Before the pandemic, consumer demand had been a
small (and declining) part of the flour industry. In Britain, for example, it accounted for just 4 per
cent of flour intake. The remainder went to the industrial bakers and food producers (Arunrat and
et.al., 2020). While the consistency of the flour that commercial consumers purchase is not
inherently different, the volume of the packets they purchase is bags of 12, 25 or 32
kilogrammes, instead of the packages of 1 kg or 2 kg that domestic bakers choose.
2
⊘ This is a preview!⊘
Do you want full access?
Subscribe today to unlock all pages.
Trusted by 1+ million students worldwide
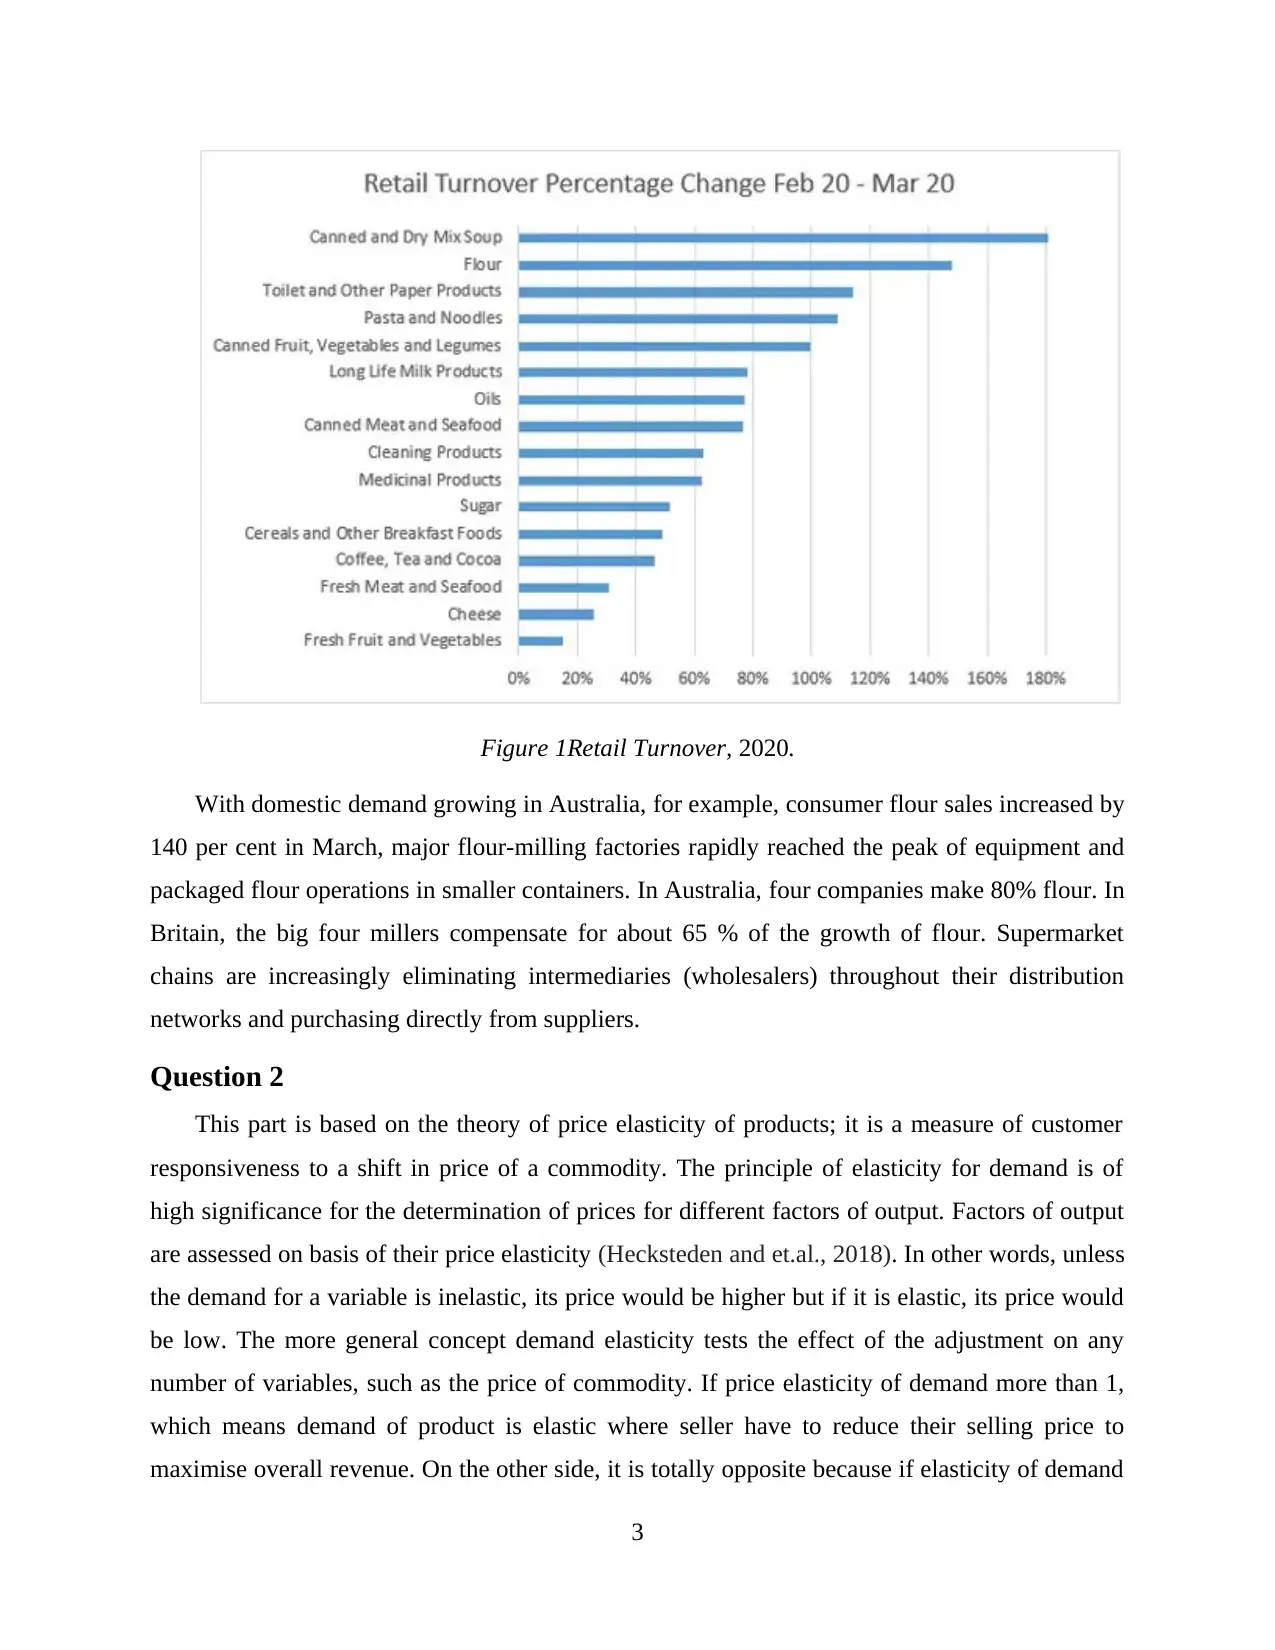
Figure 1Retail Turnover, 2020.
With domestic demand growing in Australia, for example, consumer flour sales increased by
140 per cent in March, major flour-milling factories rapidly reached the peak of equipment and
packaged flour operations in smaller containers. In Australia, four companies make 80% flour. In
Britain, the big four millers compensate for about 65 % of the growth of flour. Supermarket
chains are increasingly eliminating intermediaries (wholesalers) throughout their distribution
networks and purchasing directly from suppliers.
Question 2
This part is based on the theory of price elasticity of products; it is a measure of customer
responsiveness to a shift in price of a commodity. The principle of elasticity for demand is of
high significance for the determination of prices for different factors of output. Factors of output
are assessed on basis of their price elasticity (Hecksteden and et.al., 2018). In other words, unless
the demand for a variable is inelastic, its price would be higher but if it is elastic, its price would
be low. The more general concept demand elasticity tests the effect of the adjustment on any
number of variables, such as the price of commodity. If price elasticity of demand more than 1,
which means demand of product is elastic where seller have to reduce their selling price to
maximise overall revenue. On the other side, it is totally opposite because if elasticity of demand
3
Paraphrase This Document
Need a fresh take? Get an instant paraphrase of this document with our AI Paraphraser
less than 1 which means organization can maximise selling price of their products to generate
high revenue. In addition, the elasticity of demand is equals to the 1 than company should keep
the price same.
If the elasticity of demand for the company’s product at the current price is 1.4 which means
demand is elastic for the drugs. Pharmaceutical company should reduce their selling price in
order to maximise their overall revenue. According to the law of demand, when price of any
product decreases then demand increases which also cause the high revenue for the organization.
Similarly, pharmaceutical company introduce their new drugs at lower price to maximise
demand which automatically generate more revenue for the organization.
In case, elasticity of product demand is 0.6 which means overall demand is inelastic and in
this case, pharmaceutical organization can raise the price of new drugs which they going to
introduce. Higher the selling price maximise the total revenue because this product is in the
market demand which means, consumers are ready to pay high prices for that.
On the other side, when elasticity of product is 1, which means demand of products is
unchanged where pharmaceutical company should sell their products at same price to generate
maximum revenue (Kim, Lee and Oh, 2019). Business companies recognise the price elasticity
of demand when making important decisions on the pricing of goods. From the other hand, if
the market for a company's goods turns out to be inelastic, the price rise would raise its overall
revenue.
Question 3
It is the condition that prevailed in 1970s in the United States. By having enough requiremen
only sufficient demand of 2.5 times to hit bottom of average cost curve, company able to assume
that one firm which not sustain for long time, and at least one firm would have been suffering.
Constant returns to scale: Increasing all inputs in relation does not affect the overall
cost of output.
Diseconomies of scale: The long-term average price of manufacturing each unit rises as
overall production increases.
Long-term average cost (LRAC) curve: Indicates the lowest potential average cost of
output, enabling all output inputs to differ so the company chooses its technology
development.
4
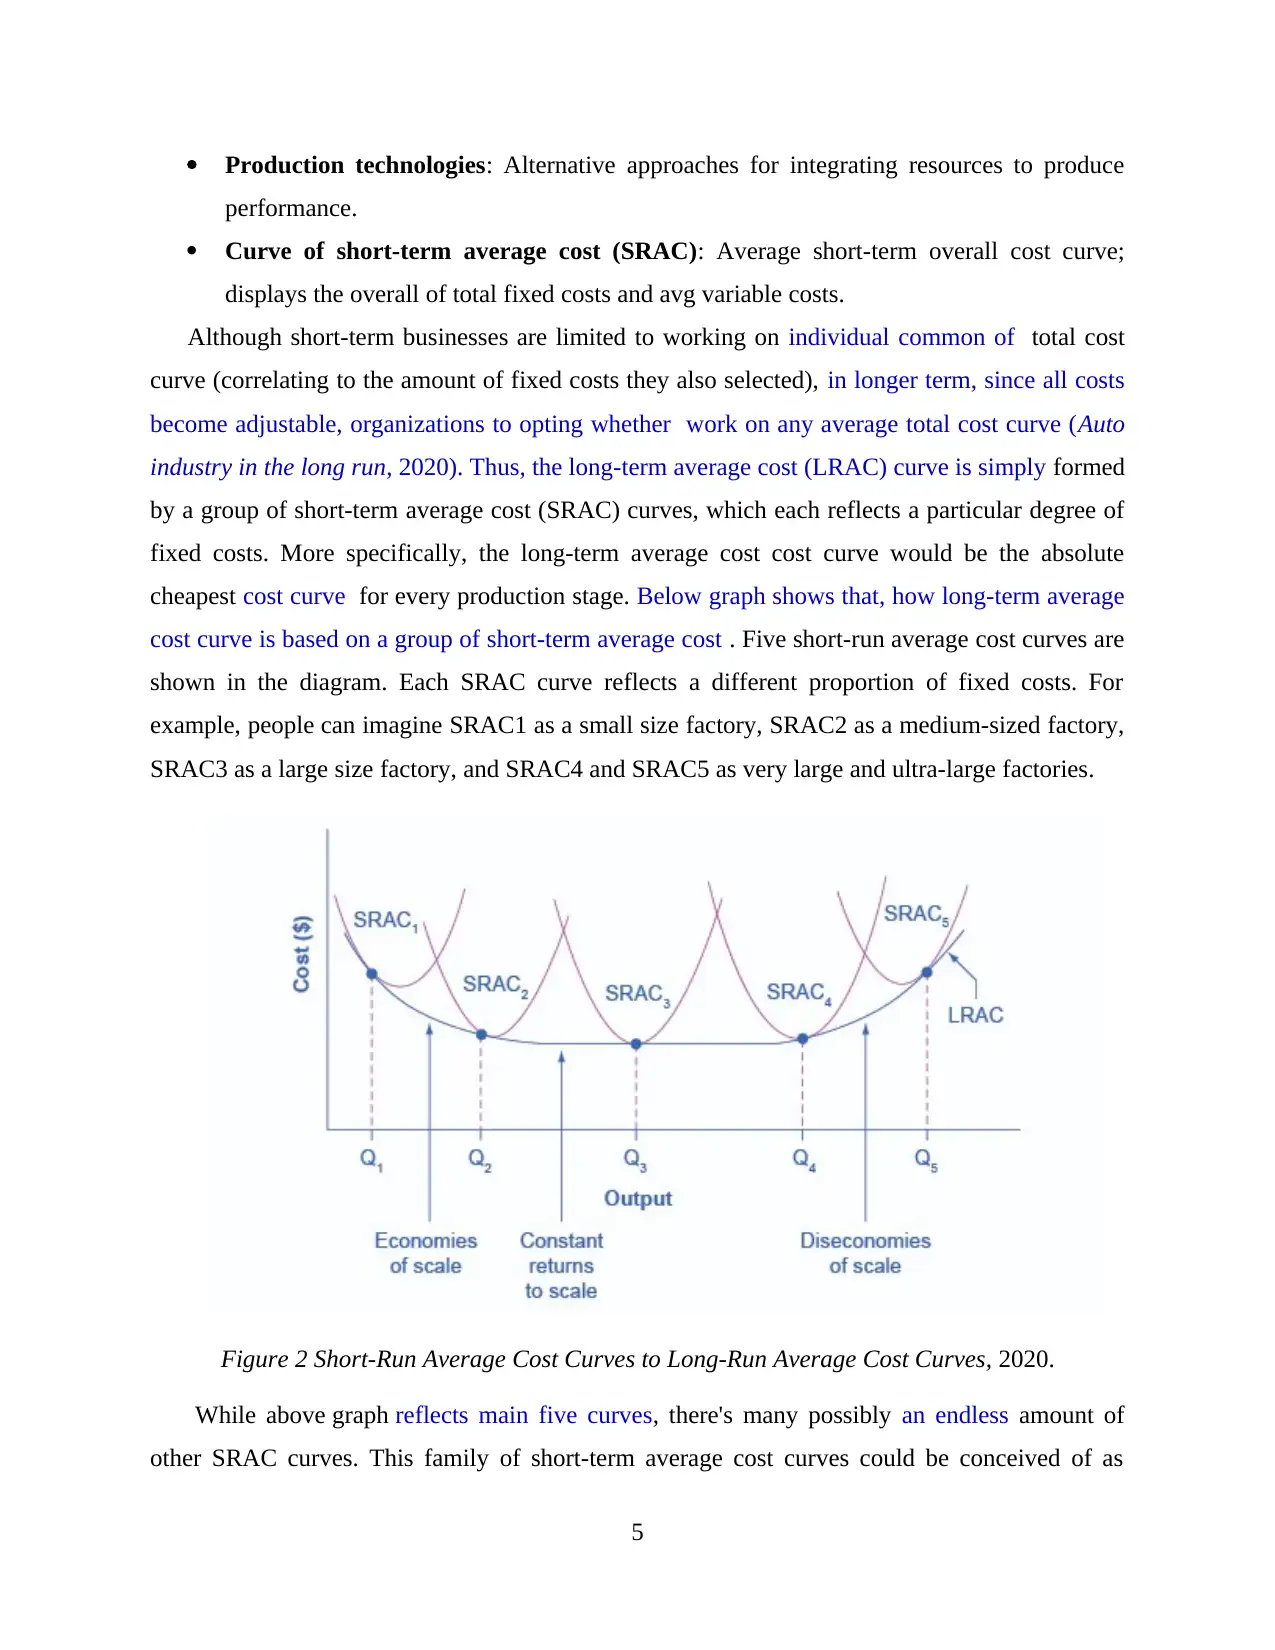
Production technologies: Alternative approaches for integrating resources to produce
performance.
Curve of short-term average cost (SRAC): Average short-term overall cost curve;
displays the overall of total fixed costs and avg variable costs.
Although short-term businesses are limited to working on individual common of total cost
curve (correlating to the amount of fixed costs they also selected), in longer term, since all costs
become adjustable, organizations to opting whether work on any average total cost curve (Auto
industry in the long run, 2020). Thus, the long-term average cost (LRAC) curve is simply formed
by a group of short-term average cost (SRAC) curves, which each reflects a particular degree of
fixed costs. More specifically, the long-term average cost cost curve would be the absolute
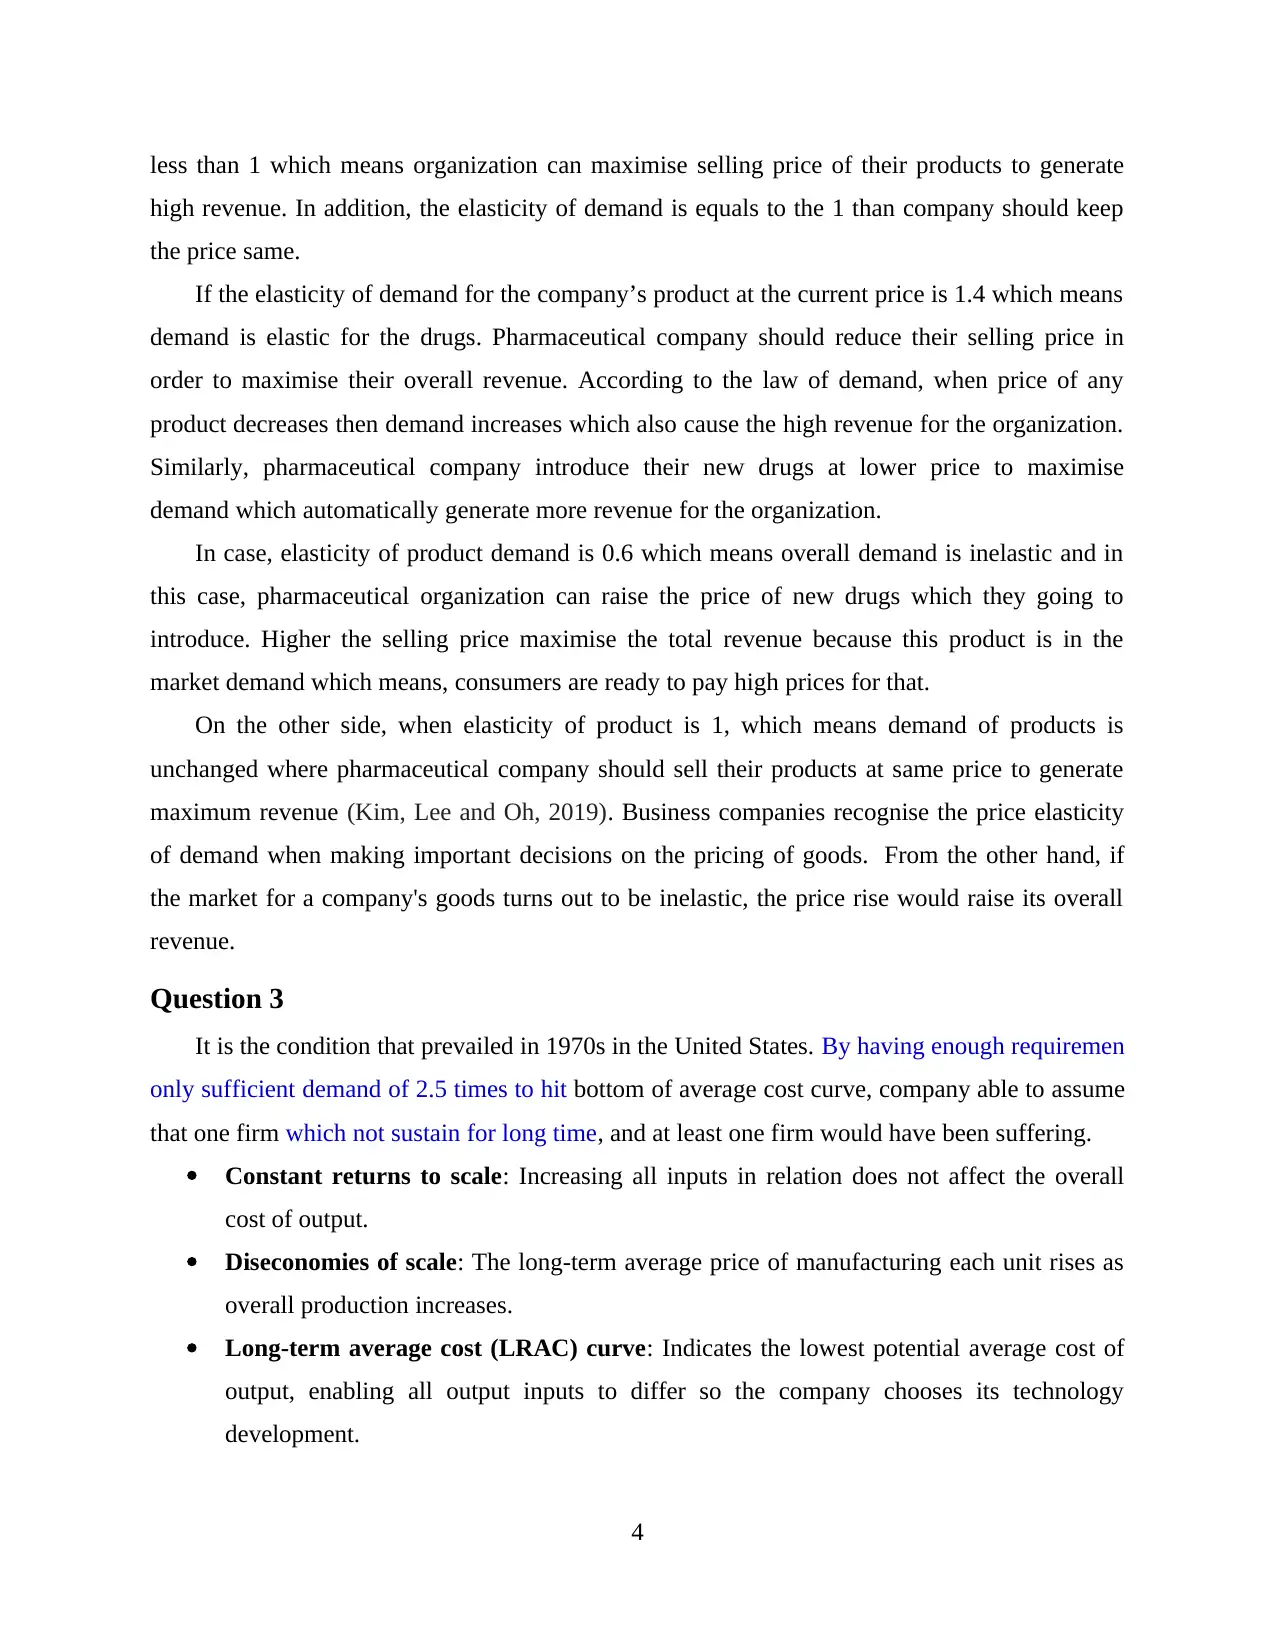
cheapest cost curve for every production stage. Below graph shows that, how long-term average
cost curve is based on a group of short-term average cost . Five short-run average cost curves are
shown in the diagram. Each SRAC curve reflects a different proportion of fixed costs. For
example, people can imagine SRAC1 as a small size factory, SRAC2 as a medium-sized factory,
SRAC3 as a large size factory, and SRAC4 and SRAC5 as very large and ultra-large factories.
Figure 2 Short-Run Average Cost Curves to Long-Run Average Cost Curves, 2020.
While above graph reflects main five curves, there's many possibly an endless amount of
other SRAC curves. This family of short-term average cost curves could be conceived of as
5
performance.
Curve of short-term average cost (SRAC): Average short-term overall cost curve;
displays the overall of total fixed costs and avg variable costs.
Although short-term businesses are limited to working on individual common of total cost
curve (correlating to the amount of fixed costs they also selected), in longer term, since all costs
become adjustable, organizations to opting whether work on any average total cost curve (Auto
industry in the long run, 2020). Thus, the long-term average cost (LRAC) curve is simply formed
by a group of short-term average cost (SRAC) curves, which each reflects a particular degree of
fixed costs. More specifically, the long-term average cost cost curve would be the absolute
cheapest cost curve for every production stage. Below graph shows that, how long-term average
cost curve is based on a group of short-term average cost . Five short-run average cost curves are
shown in the diagram. Each SRAC curve reflects a different proportion of fixed costs. For
example, people can imagine SRAC1 as a small size factory, SRAC2 as a medium-sized factory,
SRAC3 as a large size factory, and SRAC4 and SRAC5 as very large and ultra-large factories.
Figure 2 Short-Run Average Cost Curves to Long-Run Average Cost Curves, 2020.
While above graph reflects main five curves, there's many possibly an endless amount of
other SRAC curves. This family of short-term average cost curves could be conceived of as
5
⊘ This is a preview!⊘
Do you want full access?
Subscribe today to unlock all pages.
Trusted by 1+ million students worldwide
reflecting different decisions for a company that is preparing its amount of investment in total
fixed capital stock knowing that different capital expenditure decisions in the current would lead
to different short-term average cost curves throughout the future.
Question 4
Every high-income nation has its own unique story of developments for example: Australia
invest in human and physical resources and focused on improving technological gains, economic
forces, government policies, and even fortunate events. The overall trend of convergence is
evident. Low-income nations have GDP growth that is higher than middle-income economics,
which have GDP growth which is faster than that of high-income countries. Two influential
members of the fast-growing club are China and India, which account for almost 40 % of the
world population.
Middle or Low income nations like India and Afghanistan, they generally have lower
aspects of physical or human capital, so capital expenditure in specific task to enhance a greater
marginal impact in such regions their high incomes where labour and capital levels were still
significantly higher (Norcini and et.al., 2018). Decreasing returns means that low-income
markets will migrate to the capabilities provided by metro countries whose GDP value is more
than others. The second point is shows less gaining of income nations can scrutinize it much
easier to develop their technology than high-income countries like Australian, US etc. High-
income economics must constantly develop new innovations, whereas low-income countries will
also find strategies to accommodate technology which already commence to developed.
Several claims indicate that low-income and medium income countries will have a benefit in
gaining higher productivity for workers and economic growth in the future. Moreover, as the
citizens of nation start to recognize the advantages of a better quality life, where they will
become more willing towards create and maintain eco-friendly infrastructure that will continue
to deliver that high standard of living. If the economic growth relied on development for
human resource then, the growth rate of economy can be predicted towards diminishes over
long run. However, there is also another key element in overall output use such as technology.
Question 5
The most widely cited indicator of inflation in the United States is the Consumer Price Index
(CPI). United States government statistics, Bureau of Labour Statistics measures the CPI on the
6
Paraphrase This Document
Need a fresh take? Get an instant paraphrase of this document with our AI Paraphraser
basis of prices in a defined basket of goods and services that reflects the transactions of an
ordinary family of four. In recent times, the statisticians also paid attention to a significant
problem: that the variation in total cost of purchasing a fixed basket of products and services
over period is functionally not exactly the same as the increases in the level of living, since the
cost of living is just how much it takes a person to believe that his or her usage offers the same
amount of satisfaction or utilization.
To grasp the difference, assume that over the last 10 years, the cost of buying a fixed basket
of products has increased by 25 per cent and salary has also increased by 25 per cent. But this is
essential to identify that personal standard of living stayed stable or not (Watling and Ginsburg,
2019). If they do not actually buy an equivalent fixed basket of goods per year, an inflation
estimate relative to cost of a fixed basket of goods could be a deceptive measurement of how the
cost of living has increased. There are two problems: substitution bias and quality / new goods
bias and these are discussed below:
If the price of a good price increases, buyers prefer to buy less and instead pursue
alternatives. When the price of good is decrease than people want to buy more products. This
trend means that goods with typically increasing costs must appear to turn less essential for
overall basket of goods assort to mapping inflation and recession, whereas goods with declining
prices must appear to be more significant. For example, an increase of $100 per pound in the
price of peaches.
Alternatively, assume that individuals are totally oblivious to whether they have peaches or
other kinds of fruit. Today, as the price of peach increases, people totally turn to other fruit
options, and the overall cost of food doesn't really change at all. A fixed and unchanged basket of
goods implies that buyers are engaged in the purchasing of precisely the same goods, despite
price increases, which is not a very probable hypothesis. Thus, substitution bias, the increase in
price of a fixed basket of goods across time, appears to exaggerate the increase throughout the
true standard of living of the customer, since it does not take into consideration that an individual
can replace goods which comparative costs have increased.
7
REFERENCES
Books & Journals
Akgün, K. and et.al., 2019. Profiling individual clinical responses by high-frequency serum
neurofilament assessment in MS. Neurology-Neuroimmunology
Neuroinflammation, 6(3), p.e555.
Arunrat, N. and et.al., 2020. Assessment of climate change impact on rice yield and water
footprint of large-scale and individual farming in Thailand. Science of The Total
Environment, 726, p.137864.
Hecksteden, A. and et.al., 2018. Repeated testing for the assessment of individual response to
exercise training. Journal of Applied Physiology, 124(6), pp.1567-1579.
Kim, D. H., Lee, J. H. and Oh, J. E., 2019. Assessment of individual-based perfluoroalkly
substances exposure by multiple human exposure sources. Journal of hazardous
materials, 365, pp.26-33.
Norcini, J. and et.al., 2018. 2018 Consensus framework for good assessment. Medical
teacher, 40(11), pp.1102-1109.
Watling, C. J. and Ginsburg, S., 2019. Assessment, feedback and the alchemy of
learning. Medical education, 53(1), pp.76-85.
Online
Auto industry in the long run. 2020. [Online]. Available Through:
https://webcache.googleusercontent.com/search?q=cache:6nLhXeDR5kQJ:https://
opentextbc.ca/principlesofeconomics/chapter/7-3-the-structure-of-costs-in-the-long-run/
+&cd=1&hl=en&ct=clnk&gl=in
Shortage of household items. 2020. [Online]. Available Through:
https://webcache.googleusercontent.com/search?q=cache:8bjULkuWsegJ:https://
theconversation.com/why-flour-is-still-missing-from-supermarket-shelves-
137263+&cd=1&hl=en&ct=clnk&gl=in
8
⊘ This is a preview!⊘
Do you want full access?
Subscribe today to unlock all pages.
Trusted by 1+ million students worldwide
1 out of 9
Your All-in-One AI-Powered Toolkit for Academic Success.
+13062052269
info@desklib.com
Available 24*7 on WhatsApp / Email
![[object Object]](/_next/static/media/star-bottom.7253800d.svg)
Unlock your academic potential
Copyright © 2020–2026 A2Z Services. All Rights Reserved. Developed and managed by ZUCOL.