Economics Assignment: Cherry Market Analysis & Related Impacts
VerifiedAdded on 2023/06/13
|11
|1916
|221
Report
AI Summary
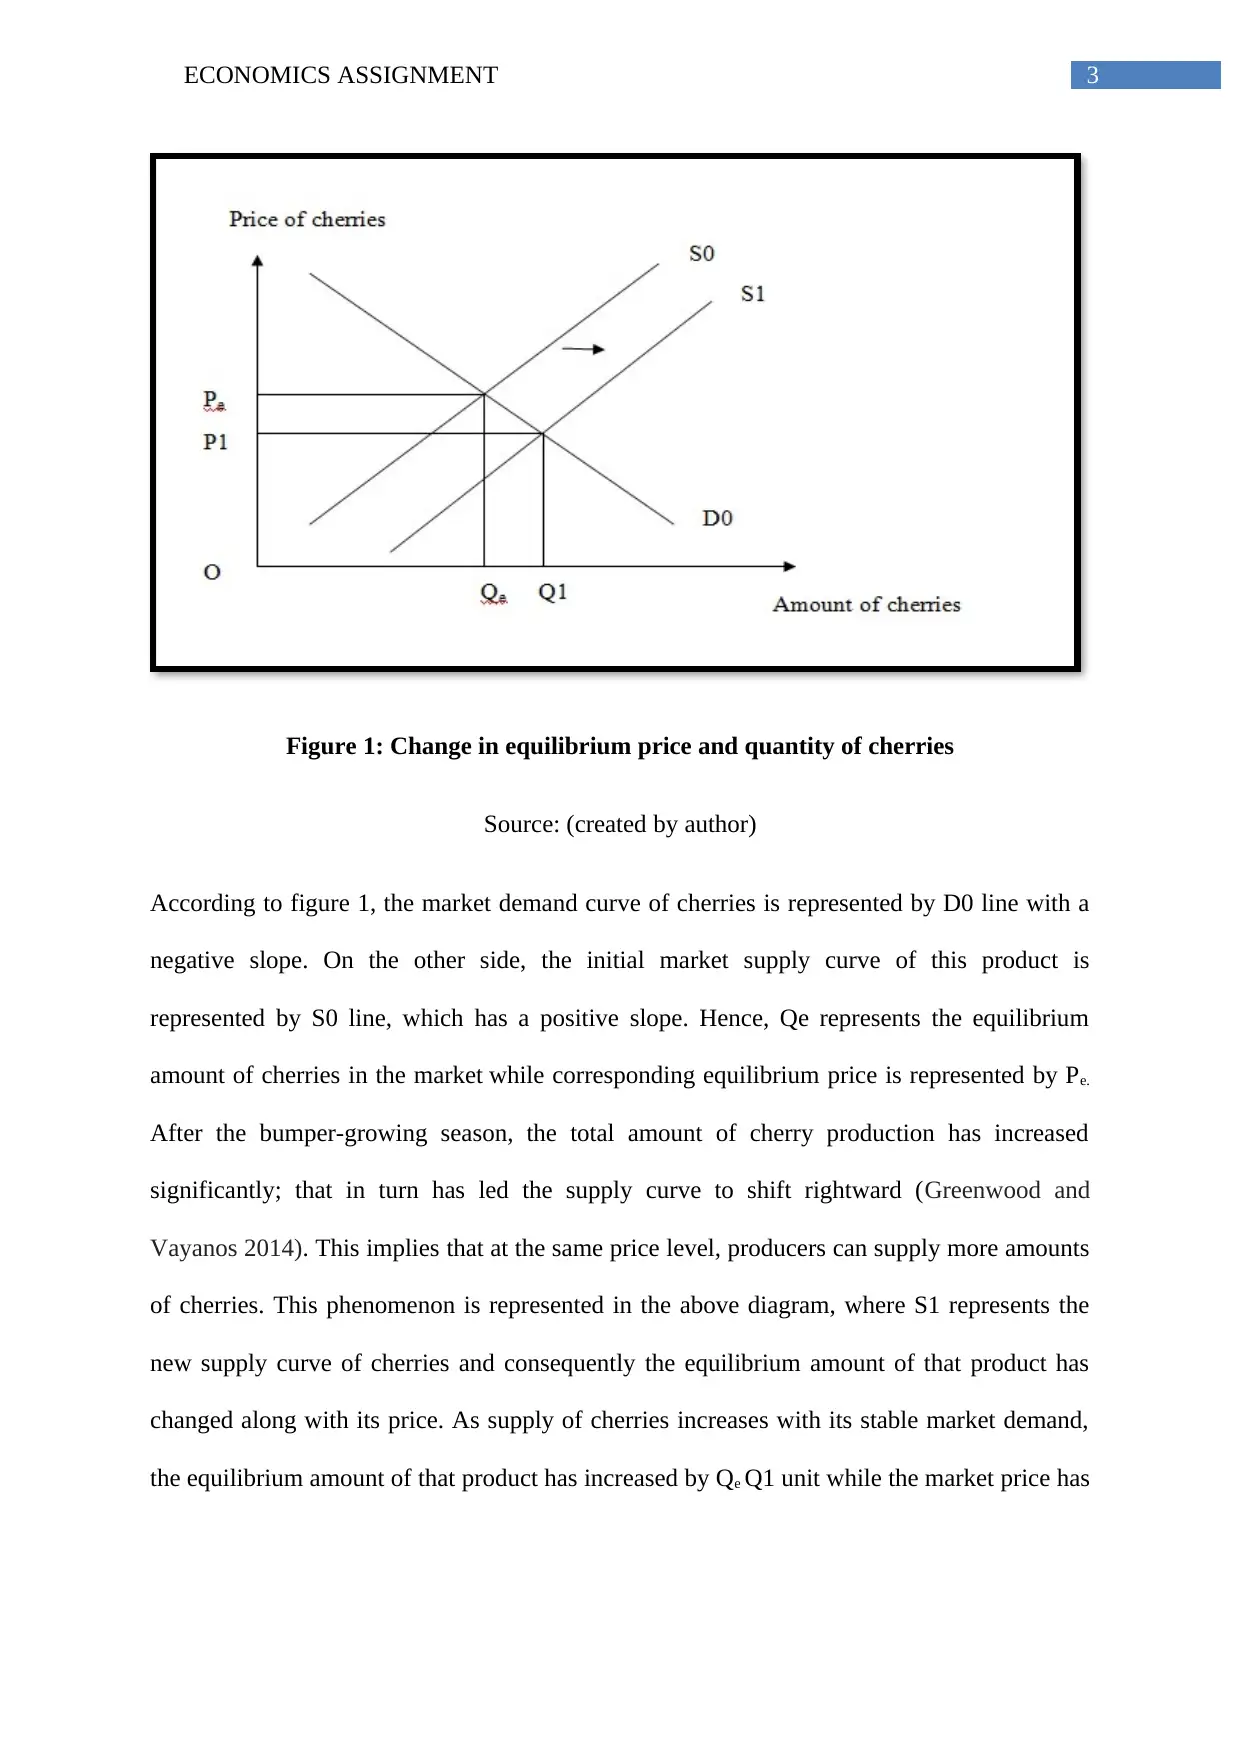
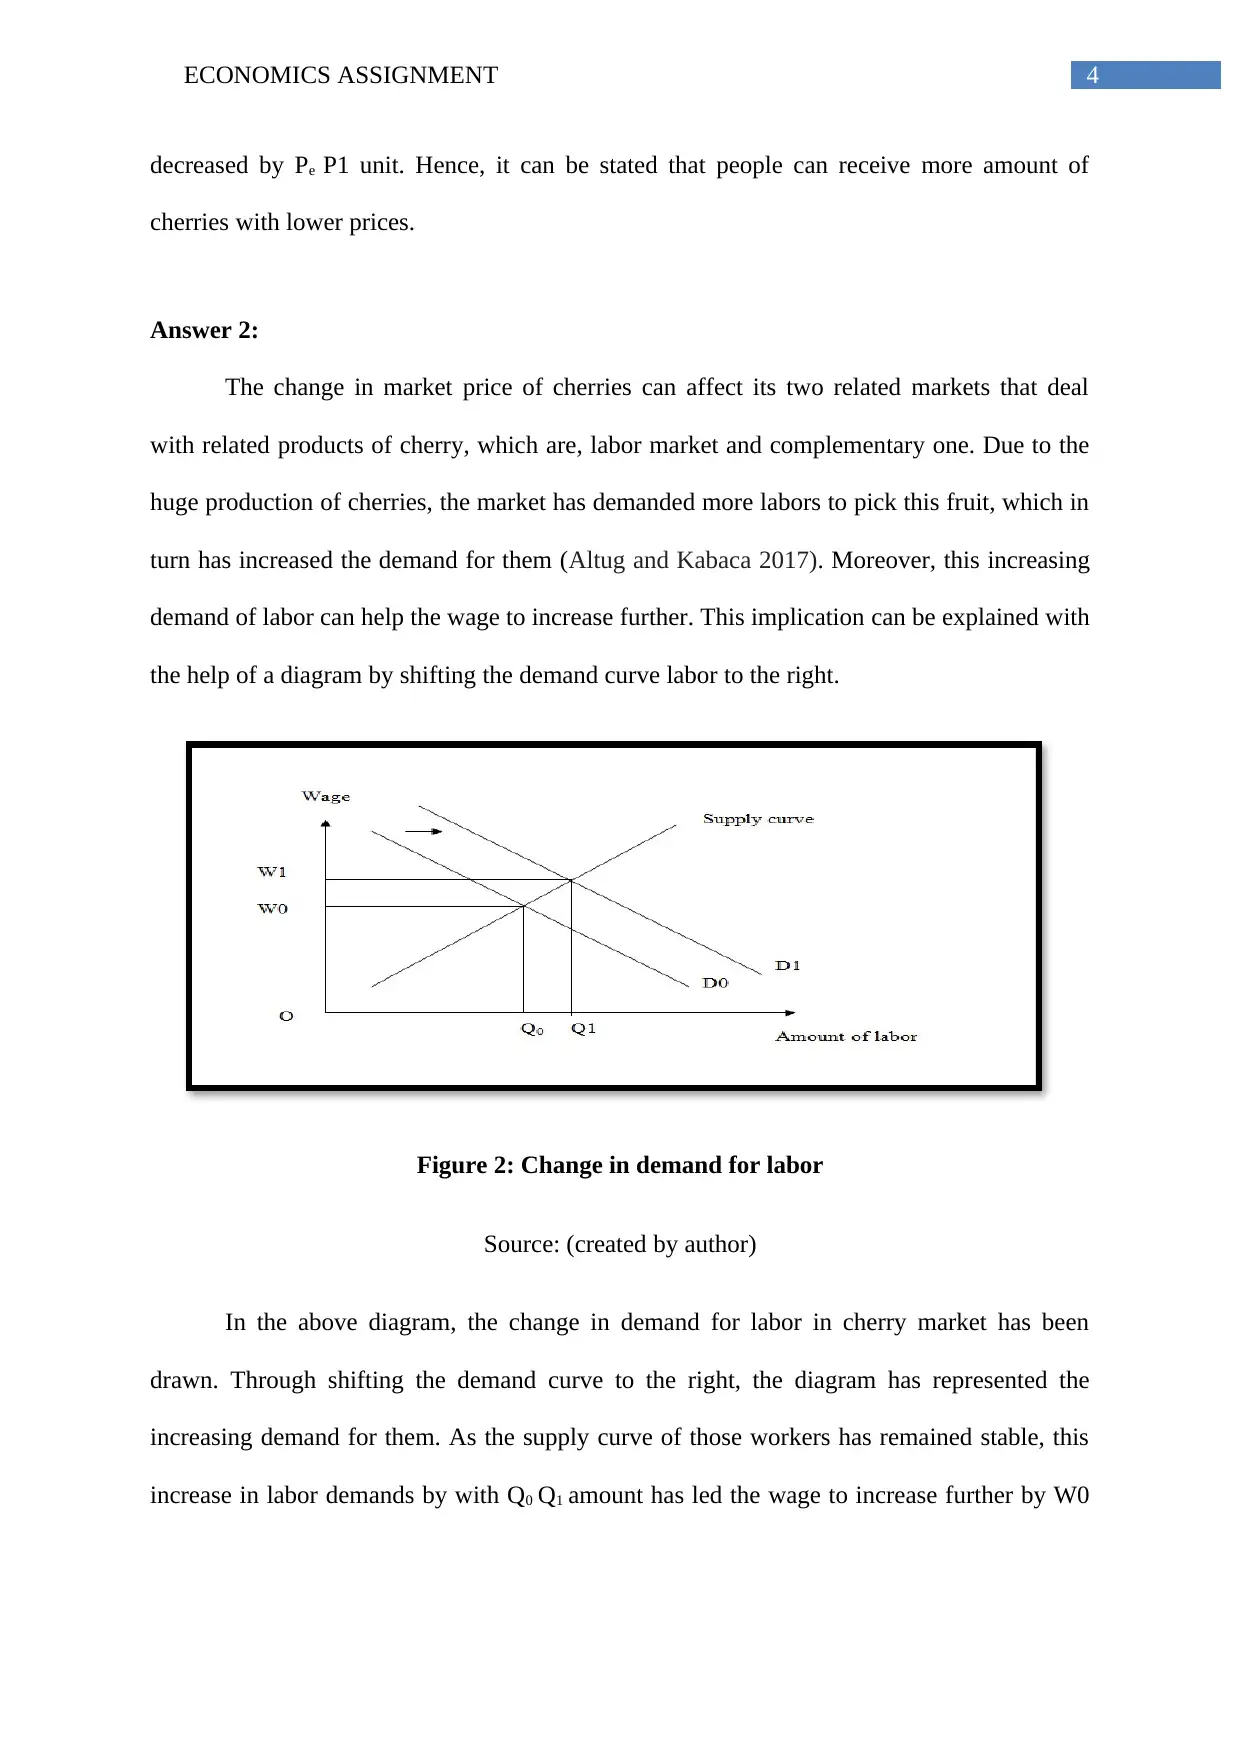
This economics assignment delves into the dynamics of the cherry market, examining the impact of excess production on market equilibrium, labor markets, and complementary goods. It analyzes how a bumper-growing season affects the supply curve, leading to changes in equilibrium price and quantity. The assignment further explores the price elasticity of demand for cherries, determining it to be unitary elastic, and discusses the implications for consumer surplus and overall income. Through graphical representations and calculations, the report provides a comprehensive understanding of the economic forces at play in the cherry market and its related sectors. Desklib offers a platform to access similar solved assignments and past papers for students.

Running head: ECONOMICS ASSIGNMENT
Economics Assignment
Name f the student
Name of the university
Author Note
Economics Assignment
Name f the student
Name of the university
Author Note
Paraphrase This Document
Need a fresh take? Get an instant paraphrase of this document with our AI Paraphraser

1ECONOMICS ASSIGNMENT
Table of Contents
Answer 1:...................................................................................................................................2
Answer 2:...................................................................................................................................4
Answer 3:...................................................................................................................................6
References:.................................................................................................................................9

2ECONOMICS ASSIGNMENT
Answer 1:
Under a perfectly competitive market of cherries, the impact of excess production of
this product can be analyzed with the help of market demand and market supply curve. To
describe the nature of both curves, it is assumed that other factors, for instance, income, tastes
and preferences of consumers, price of related products and weather, which can influence
both demand and supply of cherries, have remained constant (Kalcheva, McLemore and Pant
2018). Hence, the changes of quantity demanded and quantity supplied of cherries can be
measured with the changes of its own price. The market demand curve under this perfect
competition is a downward slopping line that represents an inverse relation between prices
with its quantity demanded (Dueñas, Leung, Gil and Reneses 2015). This means an increase
in price of cherries can decrease its market demand while the opposite situation can also be
occurred. On the other side, the market supply curve of cherries is an upward sloping line,
which indicates an increase in price of this product can influence its producers to supply more
cherries in market. Hence, the equilibrium amount of this specified product and its
corresponding equilibrium price can be obtained with the help of these two curves when they
equate with each other.
⊘ This is a preview!⊘
Do you want full access?
Subscribe today to unlock all pages.

Trusted by 1+ million students worldwide

3ECONOMICS ASSIGNMENT
Figure 1: Change in equilibrium price and quantity of cherries
Source: (created by author)
According to figure 1, the market demand curve of cherries is represented by D0 line with a
negative slope. On the other side, the initial market supply curve of this product is
represented by S0 line, which has a positive slope. Hence, Qe represents the equilibrium
amount of cherries in the market while corresponding equilibrium price is represented by Pe.
After the bumper-growing season, the total amount of cherry production has increased
significantly; that in turn has led the supply curve to shift rightward (Greenwood and
Vayanos 2014). This implies that at the same price level, producers can supply more amounts
of cherries. This phenomenon is represented in the above diagram, where S1 represents the
new supply curve of cherries and consequently the equilibrium amount of that product has
changed along with its price. As supply of cherries increases with its stable market demand,
the equilibrium amount of that product has increased by Qe Q1 unit while the market price has
Paraphrase This Document
Need a fresh take? Get an instant paraphrase of this document with our AI Paraphraser

4ECONOMICS ASSIGNMENT
decreased by Pe P1 unit. Hence, it can be stated that people can receive more amount of
cherries with lower prices.
Answer 2:
The change in market price of cherries can affect its two related markets that deal
with related products of cherry, which are, labor market and complementary one. Due to the
huge production of cherries, the market has demanded more labors to pick this fruit, which in
turn has increased the demand for them (Altug and Kabaca 2017). Moreover, this increasing
demand of labor can help the wage to increase further. This implication can be explained with
the help of a diagram by shifting the demand curve labor to the right.
Figure 2: Change in demand for labor
Source: (created by author)
In the above diagram, the change in demand for labor in cherry market has been
drawn. Through shifting the demand curve to the right, the diagram has represented the
increasing demand for them. As the supply curve of those workers has remained stable, this
increase in labor demands by with Q0 Q1 amount has led the wage to increase further by W0

5ECONOMICS ASSIGNMENT
W1 amount. Hence, the decrease in price of cherries due to its over production has
influenced the wage of labor to increase further at a fixed supply level.
The impact of price change can also be described in the market of complementary
products. For those products, change in price of cherries has led the change in quantity
demanded of its complementary goods in the same direction. For instance, an increase in
price of cherries can lead the demand for its complementary products to decline while the
opposite situation can also be occurred if price of cherries has decreased (Ahmadi, Skiera,
Lambrecht and Heubrandner 2017). Cakes, that include cherry, can be considered as
complementary products of this specified item. Thus, the decrease in price of cherries may
increase the demand for this product and consequently can increase the demand for cakes. In
this context, it can be assumed that other factors that can influence the demand for cakes, like
its own price, income and tastes of consumers have remained fixed. That means the demand
for cakes can be varied only when the price of cherries have changed. A suitable
diagrammatical representation is required to explain this concept deeply.
Figure 3: change in demand of complementary goods of cherries
Source: (created by author)
⊘ This is a preview!⊘
Do you want full access?
Subscribe today to unlock all pages.

Trusted by 1+ million students worldwide

6ECONOMICS ASSIGNMENT
It can be stated from the above figure that decrease in price of cherries has helped the
demand of cakes to increase by Qf0 Qf1 unit, when the price of this complementary product
has remained at its stable position. This in turn has implied that people are demanding both
cherries and cakes by higher amount when the price of cherries has declined.
Answer 3:
a)
Price elasticity of demand measures the degree of responsiveness for a product’s
change in quantity demanded when its own price has changed. To measure this value, it is
assumed that other factors that can influence the demand for this product has remained stable.
Hence, the value of price elasticity can be determined as percentage change in quantity
demanded by percentage change in its price (Coglianese, Davis, Kilian and Stock 2017).
From the given case study, it can be estimated that the amount of cherries has been increased
by 20%, as the average production of cherries has remained about 15000 tons for the last few
years, while at present; this amount has increased, that is, almost 18000 tons. Moreover, this
increasing supply of output can led the price of cherries to decrease by 10% to 20%.
Price elasticity for cherries = percentage change in quantity demanded for cherries/
Percentage change in its price
Price elasticity for cherries = 20% / 20%
Price elasticity for cherries = 1
Hence, it can be stated that percentage change in quantity demanded for cherries and
percent change in price of that product has almost same value that is 20% (Zhao 2017). By
considering this, it can be stated that the price elasticity of demand for the concerned product
Paraphrase This Document
Need a fresh take? Get an instant paraphrase of this document with our AI Paraphraser

7ECONOMICS ASSIGNMENT
is unitary elastic, which means, the amount of price change and its quantity demanded has the
changed by same amount.
b)
As the value of price elasticity of cherries is equal to 1, this implies that decrease in
price has increased the amount of quantity demanded by same amount. As the production of
cherries has increased significantly, its price has decreased by large amount, which in turn
can help the consumers to buy this product at a lower price level (Levy, Norton and Smith
2018). This decrease in price has led the total consumption expenditure to increase if
consumers demand more amount of cherries for its lower prices (Chen 2017). This in turn has
increased the total income of the country by increasing its total demand (Attanasio and
Pistaferri 2016). Hence, consumers can obtain surplus value in market. This can be explained
with the help of demand and supply diagram.
Figure 4: Consumer Surplus
Source: (created by author)

8ECONOMICS ASSIGNMENT
Consumer surplus in cherry market is represented by the area of triangle ABPe. To
purchase one unit of cherry, consumer can pay Pe amount while the concerned person wants
to pay A for the same amount of output. When the price of cherry has decreased more, to
purchase same amount, the concerned person needs to pay fewer value compare to before.
Hence, thus phenomenon has influenced consumers to enjoy more amount of consumer
surplus. This in turn can influence them to demand cherries by large amount and
consequently, the total demand of this fruit can be increased further.
⊘ This is a preview!⊘
Do you want full access?
Subscribe today to unlock all pages.

Trusted by 1+ million students worldwide

9ECONOMICS ASSIGNMENT
References:
Ahmadi, I., Skiera, B., Lambrecht, A. and Heubrandner, F., 2017. Time preferences and the
pricing of complementary durables and consumables. International Journal of Research in
Marketing, 34(4), pp.813-828.
Altug, S. and Kabaca, S., 2017. Search frictions, financial frictions, and labor market
fluctuations in emerging markets. Emerging Markets Finance and Trade, 53(1), pp.128-149.
Attanasio, O.P. and Pistaferri, L., 2016. Consumption inequality. Journal of Economic
Perspectives, 30(2), pp.3-28.
Chen, H., 2017. The Effect of Life Cost to Consumer Expenditure Behavior. International
Management Review, 13(1), p.85.
Coglianese, J., Davis, L.W., Kilian, L. and Stock, J.H., 2017. Anticipation, tax avoidance,
and the price elasticity of gasoline demand. Journal of Applied Econometrics, 32(1), pp.1-15.
Dueñas, P., Leung, T., Gil, M. and Reneses, J., 2015. Gas–electricity coordination in
competitive markets under renewable energy uncertainty. IEEE Transactions on Power
Systems, 30(1), pp.123-131.
Greenwood, R. and Vayanos, D., 2014. Bond supply and excess bond returns. The Review of
Financial Studies, 27(3), pp.663-713.
Kalcheva, I., McLemore, P. and Pant, S., 2018. Innovation: The interplay between demand-
side shock and supply-side environment. Research Policy, 47(2), pp.440-461.
Levy, H.G., Norton, E.C. and Smith, J.A., 2018. Tobacco Regulation and Cost-Benefit
Analysis: How Should We Value Foregone Consumer Surplus?. American journal of health
economics, 4(1), pp.1-25.
Paraphrase This Document
Need a fresh take? Get an instant paraphrase of this document with our AI Paraphraser

10ECONOMICS ASSIGNMENT
Zhao, W., 2017. The unitary elasticity property in a monocentric city with negative
exponential population density. Regional Science and Urban Economics, 62, pp.1-11.
Zhao, W., 2017. The unitary elasticity property in a monocentric city with negative
exponential population density. Regional Science and Urban Economics, 62, pp.1-11.
1 out of 11
Related Documents

Your All-in-One AI-Powered Toolkit for Academic Success.
+13062052269
info@desklib.com
Available 24*7 on WhatsApp / Email
Unlock your academic potential
Copyright © 2020–2025 A2Z Services. All Rights Reserved. Developed and managed by ZUCOL.