Economics Assignment: Market Structures and Analysis (MPE781)
VerifiedAdded on 2023/06/12
|20
|4798
|105
Homework Assignment
AI Summary
This economics assignment analyzes market structures, drawing on concepts of supply and demand, perfect competition, monopoly, and monopolistic competition. The assignment begins by examining a scenario involving two restaurants with differing demand levels, applying the law of demand and supply to explain price and output decisions. It then delves into the characteristics of perfect competition, including the seller's supply curve and supply restriction, followed by a comparative analysis of monopolistically competitive markets. Finally, the assignment explores the dynamics of a monopoly market, discussing pricing strategies and the impact of supply restrictions on demand and revenue. The student utilizes diagrams to illustrate key economic concepts and provides references to support their analysis.
Running head: ECONOMICS ASSIGNMENT
Economics Assignment
Name of the student
Name of the university
Author Note
Economics Assignment
Name of the student
Name of the university
Author Note
Paraphrase This Document
Need a fresh take? Get an instant paraphrase of this document with our AI Paraphraser
1ECONOMICS ASSIGNMENT
Table of Contents
Answer 1:...................................................................................................................................2
Answer 2:...................................................................................................................................4
a).............................................................................................................................................4
b)............................................................................................................................................6
Answer 3:...................................................................................................................................8
Answer 4:.................................................................................................................................11
a)...........................................................................................................................................11
b)..........................................................................................................................................12
Answer 5:.................................................................................................................................13
References:...............................................................................................................................17
2ECONOMICS ASSIGNMENT
Answer 1:
The Palo Alto has received huge demand for their foods within the market, while
another restaurant, providing same kind of services with comparatively higher prices, cannot
increase its demand. According to the demand law, increase in price of foods can lead the
quantity demanded of those items in an opposite direction (Amir, Erickson and Jin 2017). In
this context, other factors, like income, tastes and preferences of consumers along with
impact of related commodities are considered as constant. This is because; those factors can
also influence the demand for foods significantly.
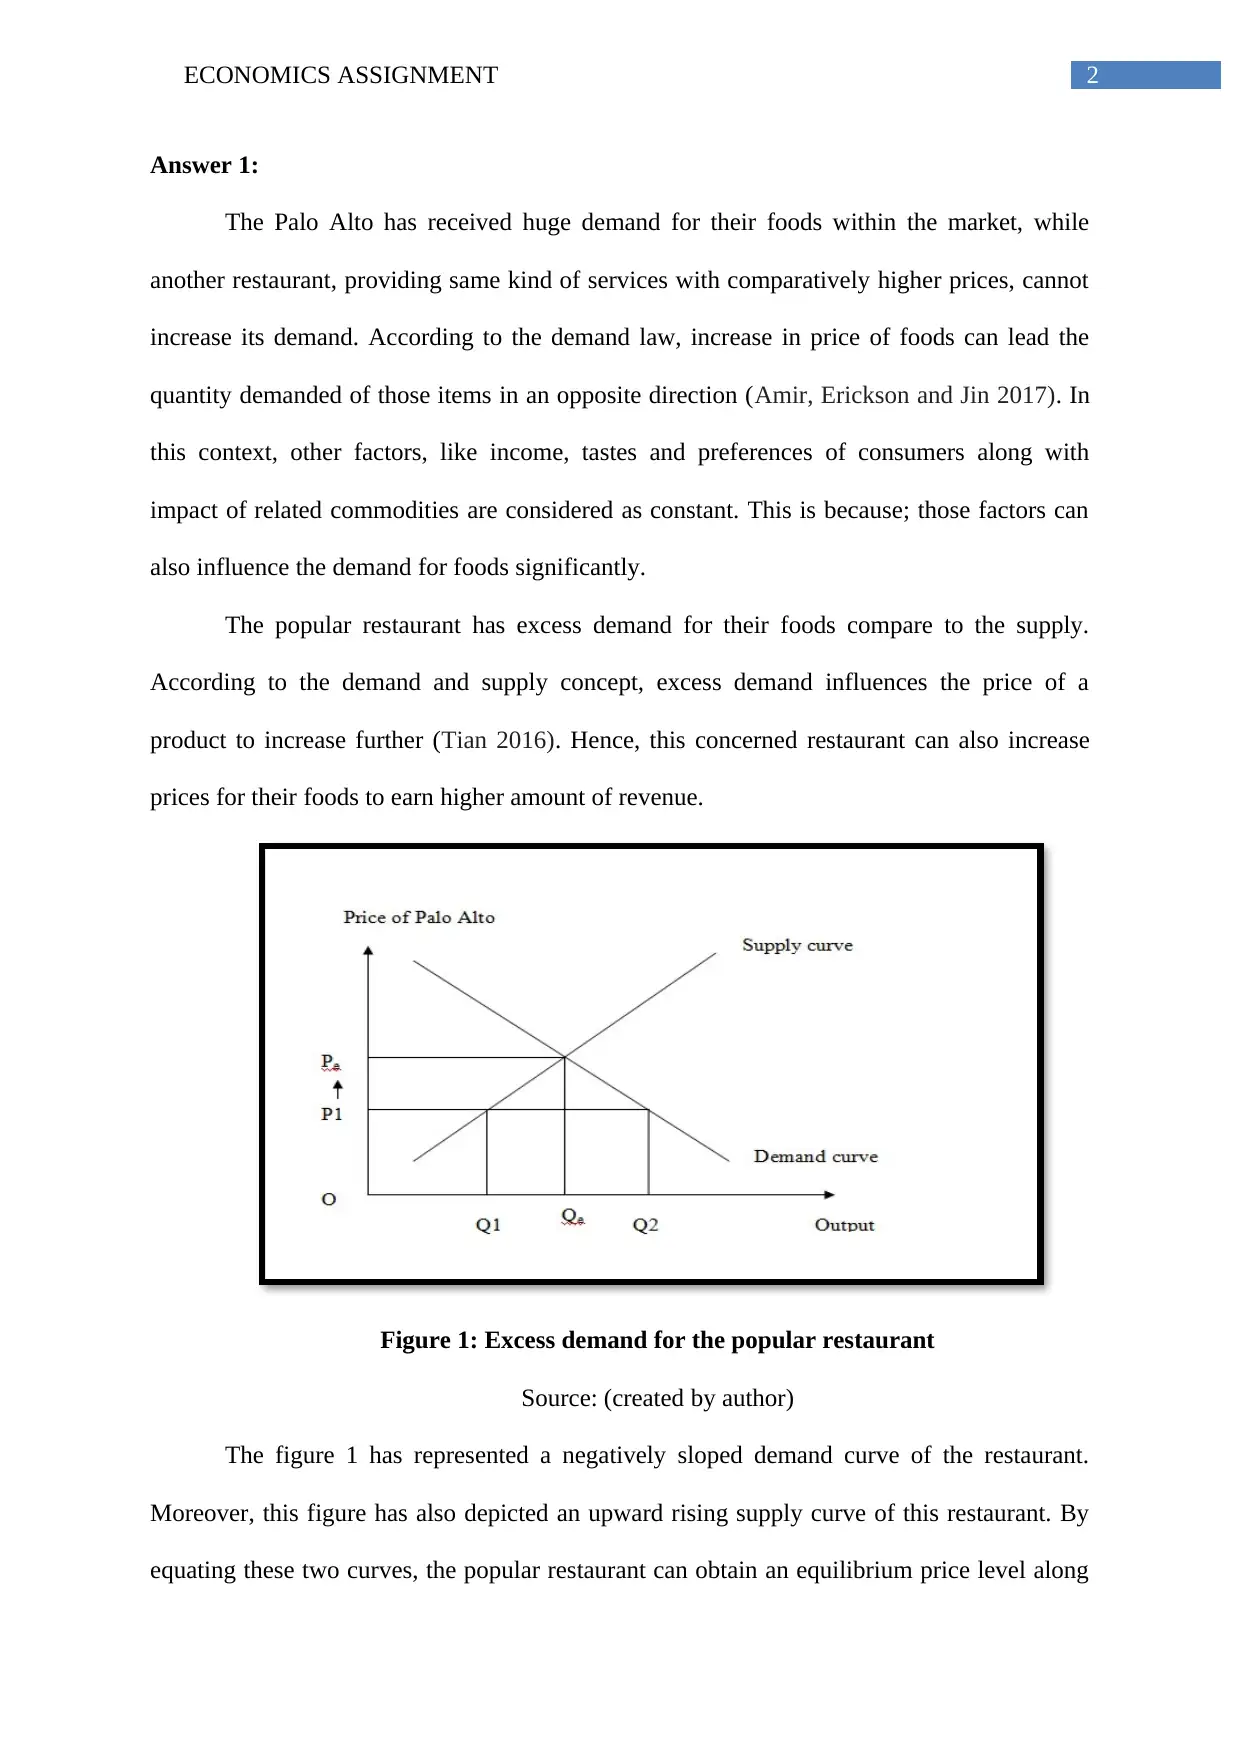
The popular restaurant has excess demand for their foods compare to the supply.
According to the demand and supply concept, excess demand influences the price of a
product to increase further (Tian 2016). Hence, this concerned restaurant can also increase
prices for their foods to earn higher amount of revenue.
Figure 1: Excess demand for the popular restaurant
Source: (created by author)
The figure 1 has represented a negatively sloped demand curve of the restaurant.
Moreover, this figure has also depicted an upward rising supply curve of this restaurant. By
equating these two curves, the popular restaurant can obtain an equilibrium price level along
Answer 1:
The Palo Alto has received huge demand for their foods within the market, while
another restaurant, providing same kind of services with comparatively higher prices, cannot
increase its demand. According to the demand law, increase in price of foods can lead the
quantity demanded of those items in an opposite direction (Amir, Erickson and Jin 2017). In
this context, other factors, like income, tastes and preferences of consumers along with
impact of related commodities are considered as constant. This is because; those factors can
also influence the demand for foods significantly.
The popular restaurant has excess demand for their foods compare to the supply.
According to the demand and supply concept, excess demand influences the price of a
product to increase further (Tian 2016). Hence, this concerned restaurant can also increase
prices for their foods to earn higher amount of revenue.
Figure 1: Excess demand for the popular restaurant
Source: (created by author)
The figure 1 has represented a negatively sloped demand curve of the restaurant.
Moreover, this figure has also depicted an upward rising supply curve of this restaurant. By
equating these two curves, the popular restaurant can obtain an equilibrium price level along
⊘ This is a preview!⊘
Do you want full access?
Subscribe today to unlock all pages.
Trusted by 1+ million students worldwide
3ECONOMICS ASSIGNMENT
with its corresponding level of output. In this figure, Pe and Qe are represented those amounts
price and output, respectively. However, according to the given situation, this concerned food
seller has charged a lower price to its customers. The figure has denoted this price by P1.
Thus, according to the figure, this popular restaurant has Q1Q2 amount of excess demand at
this lower price level. In this context, it can be mentioned that, the seller has not increaseed
its supply to fulfill this excess demand. From this, it can be stated that the concerned food
seller has enough opportunity to increase its price of foods up to Pe level. By increasing the
amount of price, this popular restaurant can earn more revenue.
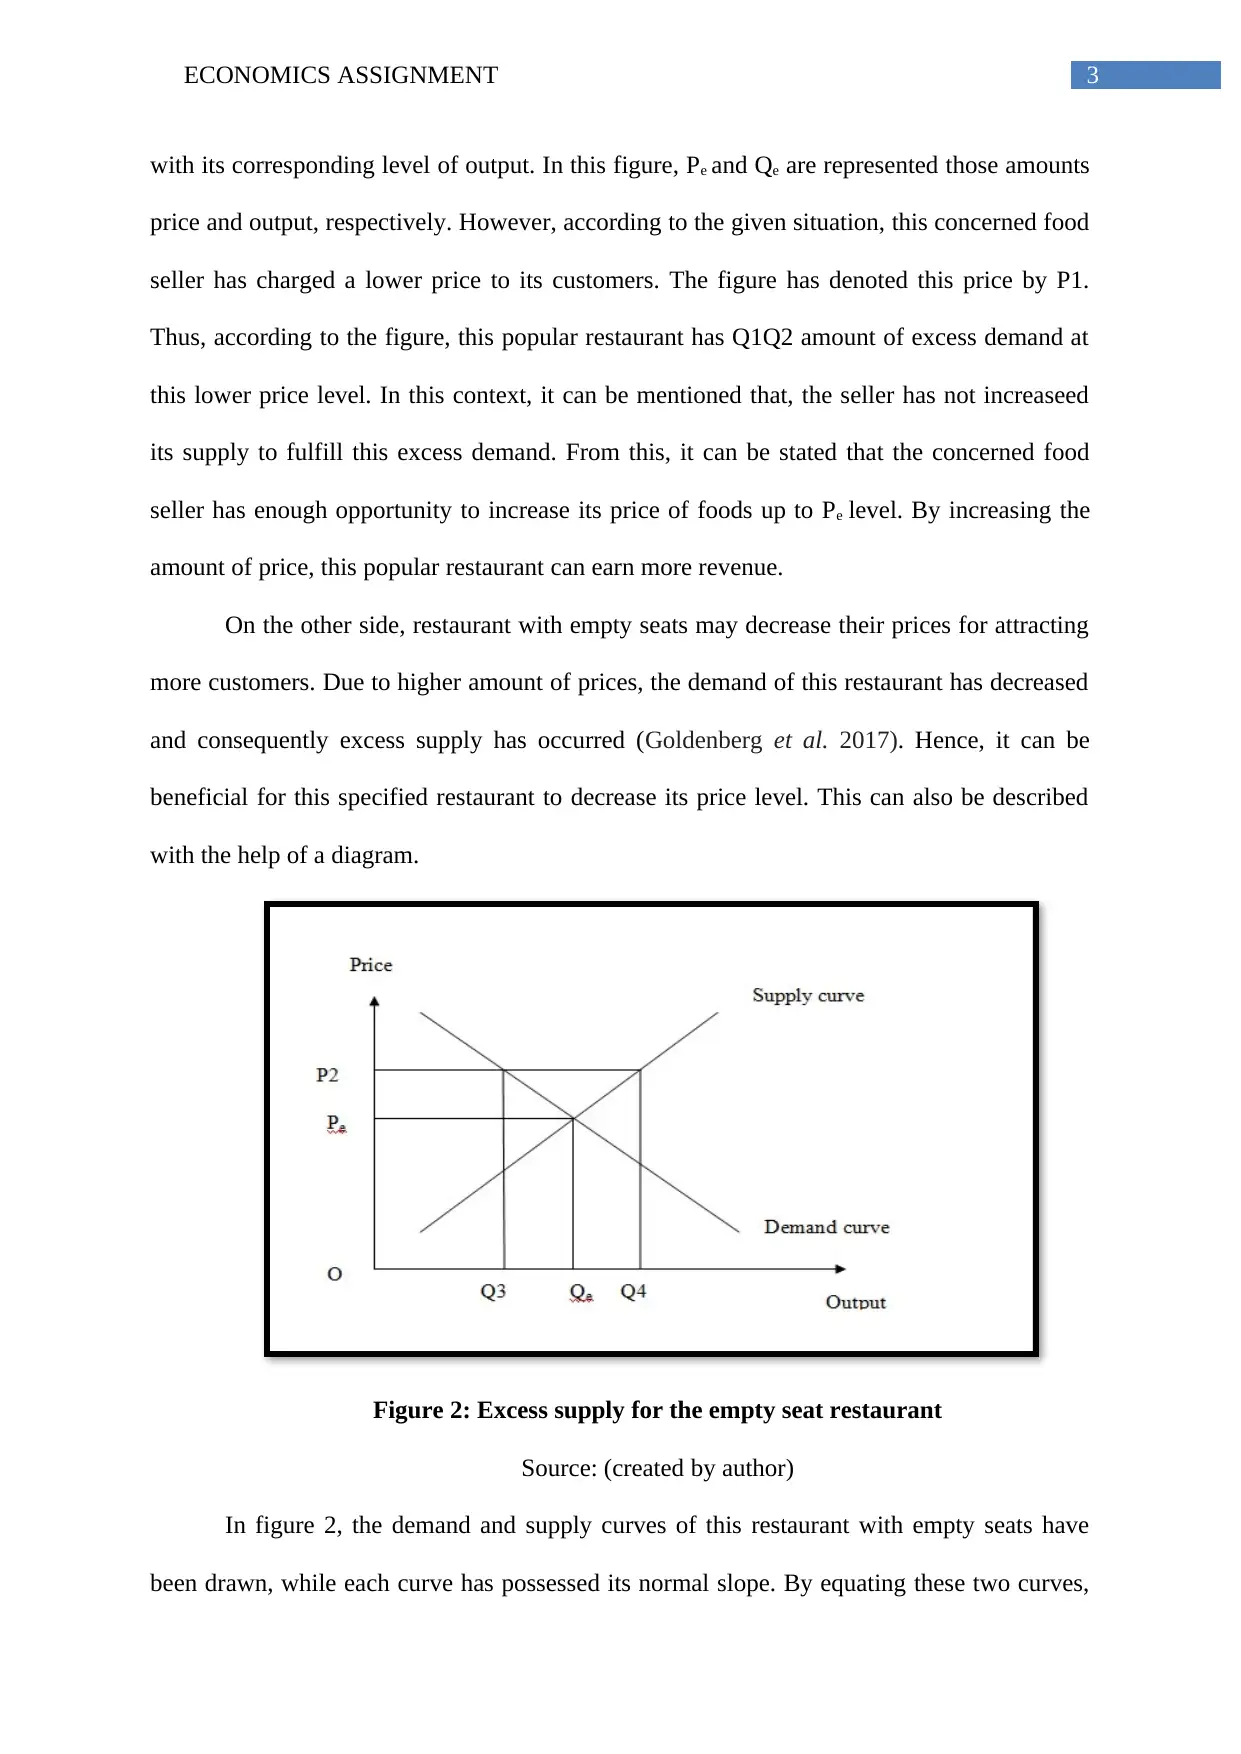
On the other side, restaurant with empty seats may decrease their prices for attracting
more customers. Due to higher amount of prices, the demand of this restaurant has decreased
and consequently excess supply has occurred (Goldenberg et al. 2017). Hence, it can be
beneficial for this specified restaurant to decrease its price level. This can also be described
with the help of a diagram.
Figure 2: Excess supply for the empty seat restaurant
Source: (created by author)
In figure 2, the demand and supply curves of this restaurant with empty seats have
been drawn, while each curve has possessed its normal slope. By equating these two curves,
with its corresponding level of output. In this figure, Pe and Qe are represented those amounts
price and output, respectively. However, according to the given situation, this concerned food
seller has charged a lower price to its customers. The figure has denoted this price by P1.
Thus, according to the figure, this popular restaurant has Q1Q2 amount of excess demand at
this lower price level. In this context, it can be mentioned that, the seller has not increaseed
its supply to fulfill this excess demand. From this, it can be stated that the concerned food
seller has enough opportunity to increase its price of foods up to Pe level. By increasing the
amount of price, this popular restaurant can earn more revenue.
On the other side, restaurant with empty seats may decrease their prices for attracting
more customers. Due to higher amount of prices, the demand of this restaurant has decreased
and consequently excess supply has occurred (Goldenberg et al. 2017). Hence, it can be
beneficial for this specified restaurant to decrease its price level. This can also be described
with the help of a diagram.
Figure 2: Excess supply for the empty seat restaurant
Source: (created by author)
In figure 2, the demand and supply curves of this restaurant with empty seats have
been drawn, while each curve has possessed its normal slope. By equating these two curves,
Paraphrase This Document
Need a fresh take? Get an instant paraphrase of this document with our AI Paraphraser
4ECONOMICS ASSIGNMENT
MC
AC
AVC
AR=MR
O
Output
Price
S
J
Q0
P0
C
equilibrium amount of price and corresponding level of output of this restaurant can be
determined. Those amounts equilibrium amount of price and output are Pe and Qe,
respectively. However, this less popular food seller has charged higher amount of price, that
is, P2, compare to its actual market price. Consequently, this empty seat restaurant has Q3 Q4
amount of excess supply at this higher price level. Hence, by attracting more customers, this
restaurant can reduce its excess supply. For doing so, this concerned food seller may reduce
its prices for foods by P2Pe amount.
Answer 2:
a)
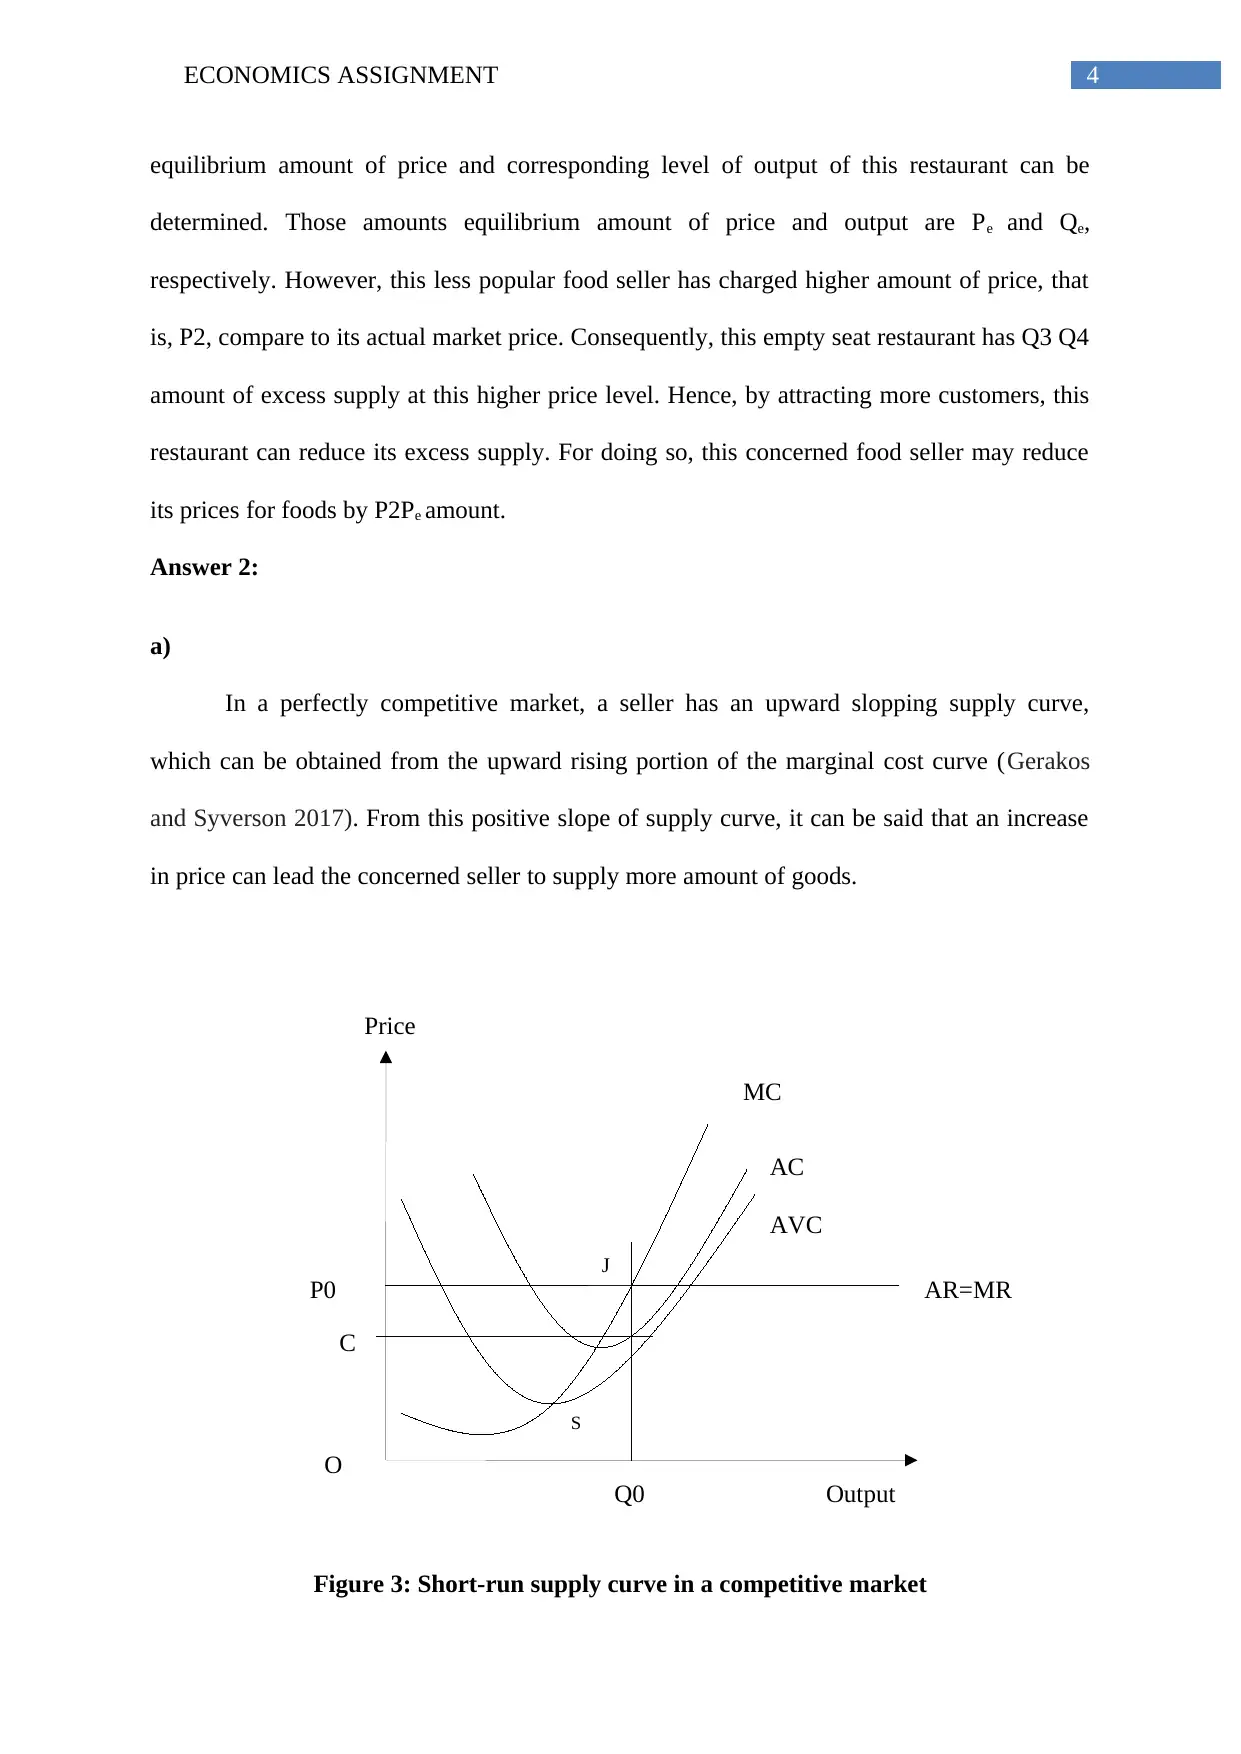
In a perfectly competitive market, a seller has an upward slopping supply curve,
which can be obtained from the upward rising portion of the marginal cost curve (Gerakos
and Syverson 2017). From this positive slope of supply curve, it can be said that an increase
in price can lead the concerned seller to supply more amount of goods.
Figure 3: Short-run supply curve in a competitive market
MC
AC
AVC
AR=MR
O
Output
Price
S
J
Q0
P0
C
equilibrium amount of price and corresponding level of output of this restaurant can be
determined. Those amounts equilibrium amount of price and output are Pe and Qe,
respectively. However, this less popular food seller has charged higher amount of price, that
is, P2, compare to its actual market price. Consequently, this empty seat restaurant has Q3 Q4
amount of excess supply at this higher price level. Hence, by attracting more customers, this
restaurant can reduce its excess supply. For doing so, this concerned food seller may reduce
its prices for foods by P2Pe amount.
Answer 2:
a)
In a perfectly competitive market, a seller has an upward slopping supply curve,
which can be obtained from the upward rising portion of the marginal cost curve (Gerakos
and Syverson 2017). From this positive slope of supply curve, it can be said that an increase
in price can lead the concerned seller to supply more amount of goods.
Figure 3: Short-run supply curve in a competitive market
5ECONOMICS ASSIGNMENT
MC
AC0
AR=MR
O
Output
Price
Q0
P0
C0
C1
Q1
AC1
Source: (created by author)
According to this figure, the short-run supply curve of is seller can be denoted by SJ
portion of the total marginal cost curve. S is the minimum level of production below which a
seller needs to shut down its business activity. That means this is the minimum level of
production from where the seller can bear its fixed costs only. However, beyond this point,
the seller cannot bear its total cost and it becomes beneficial for the concerned seller to stop
production. Hence, form this, it can be stated that a seller has possessed an upward slopping
supply curve, under this competitive market. Here, this concerned person is supplying Q0
amount of output at price level P0. Moreover, the concerned seller has gained P0C amount of
profit from this market.
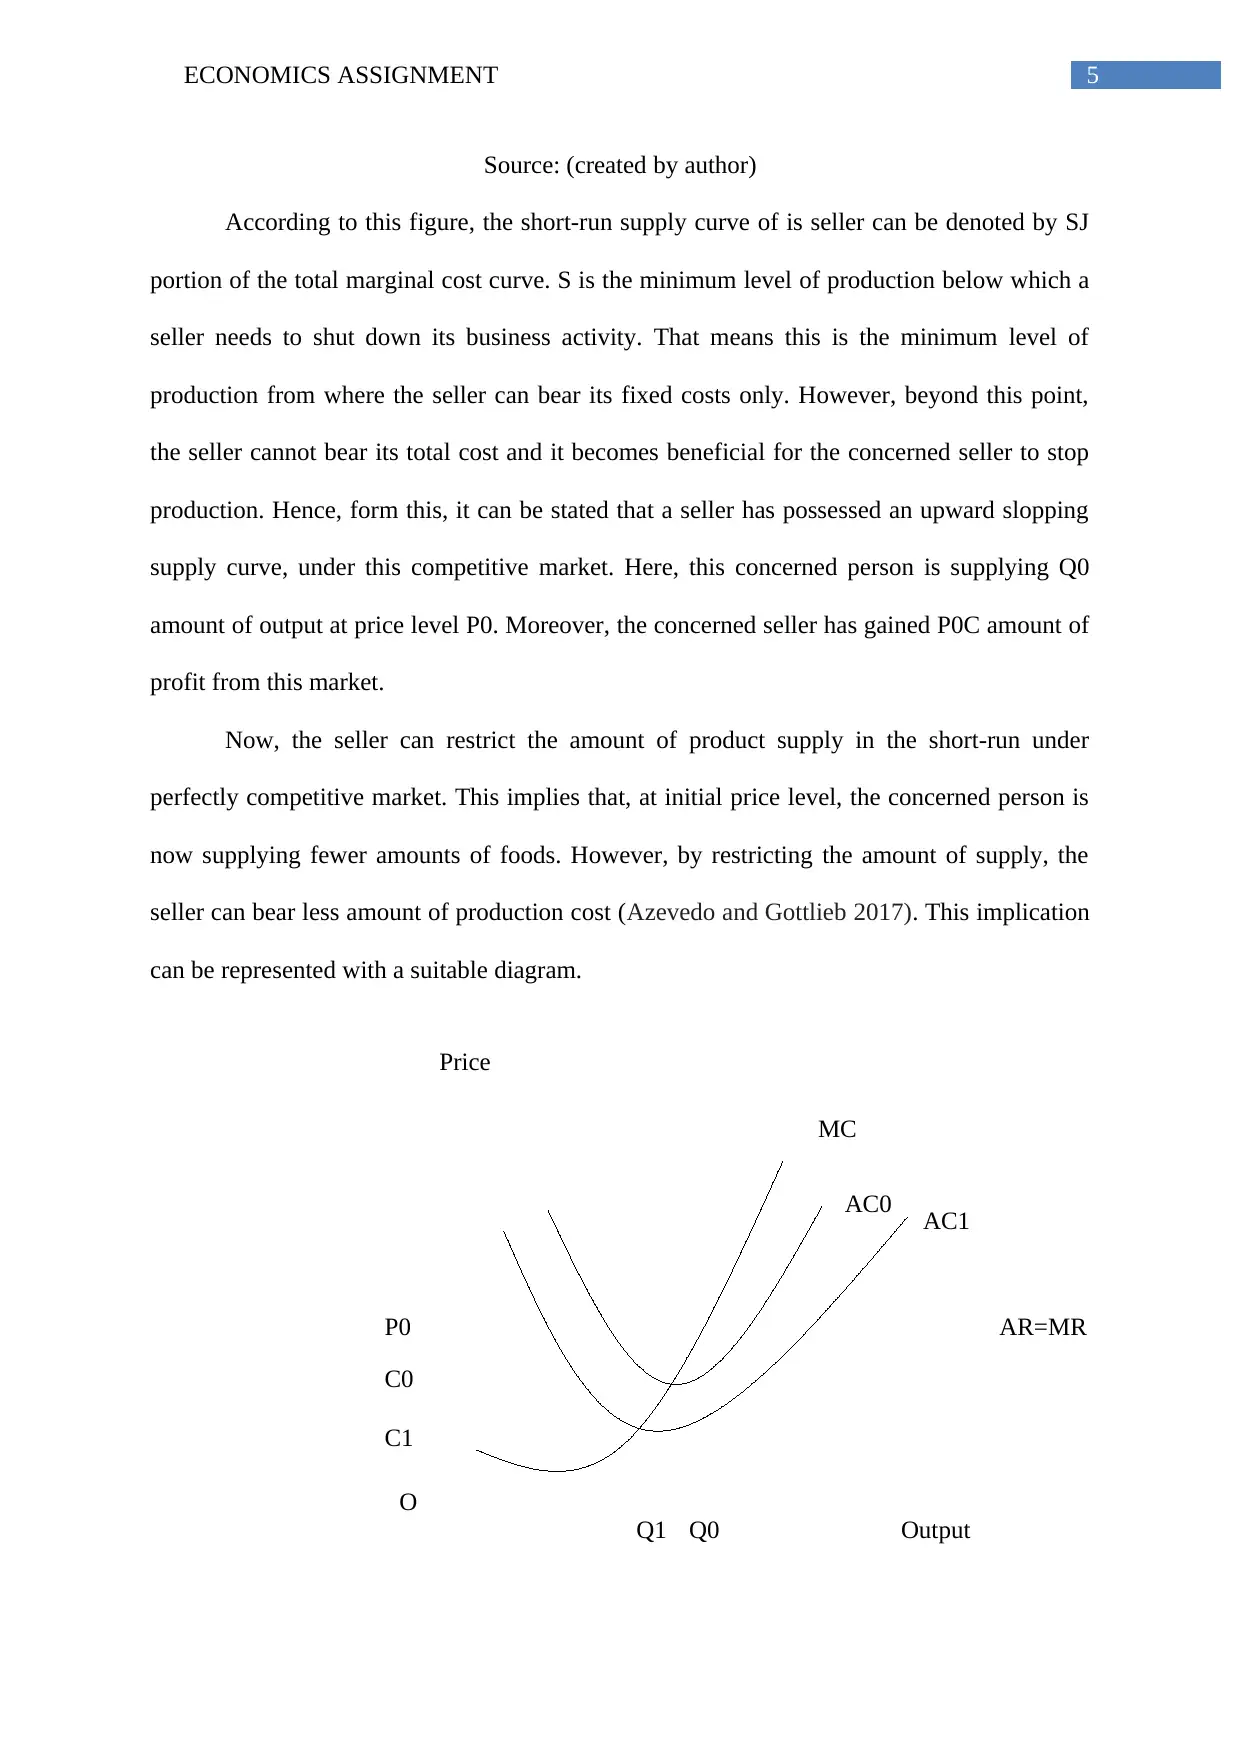
Now, the seller can restrict the amount of product supply in the short-run under
perfectly competitive market. This implies that, at initial price level, the concerned person is
now supplying fewer amounts of foods. However, by restricting the amount of supply, the
seller can bear less amount of production cost (Azevedo and Gottlieb 2017). This implication
can be represented with a suitable diagram.
MC
AC0
AR=MR
O
Output
Price
Q0
P0
C0
C1
Q1
AC1
Source: (created by author)
According to this figure, the short-run supply curve of is seller can be denoted by SJ
portion of the total marginal cost curve. S is the minimum level of production below which a
seller needs to shut down its business activity. That means this is the minimum level of
production from where the seller can bear its fixed costs only. However, beyond this point,
the seller cannot bear its total cost and it becomes beneficial for the concerned seller to stop
production. Hence, form this, it can be stated that a seller has possessed an upward slopping
supply curve, under this competitive market. Here, this concerned person is supplying Q0
amount of output at price level P0. Moreover, the concerned seller has gained P0C amount of
profit from this market.
Now, the seller can restrict the amount of product supply in the short-run under
perfectly competitive market. This implies that, at initial price level, the concerned person is
now supplying fewer amounts of foods. However, by restricting the amount of supply, the
seller can bear less amount of production cost (Azevedo and Gottlieb 2017). This implication
can be represented with a suitable diagram.
⊘ This is a preview!⊘
Do you want full access?
Subscribe today to unlock all pages.
Trusted by 1+ million students worldwide
6ECONOMICS ASSIGNMENT
Figure 4: Supply restriction of a seller under short-run
Source: (created by author)
According to above figure, the seller has restricted its supply of production by Q1Q0
unit. However, the concerned person, being a price-taker, can charge P0, as before. In
addition to this, the production cost of this seller has also decreased by C0C1 amount. Hence,
in this situation, this person can earn higher amount of profit, compare to before. In the above
figure, it can be seen that the amount of P0C1 is greater compare to the P0C0.
b)
According to the assumptions of perfect competition, the number of buyers and sellers
is large within the market. Moreover, each seller and buyer has perfect knowledge regarding
the activities of other buyers and sellers (Keyhani, Lévesque and Madhok 2015). Each seller
is supplying identical products to their customers. Consequently, a buyer can substitute one
item with another, as each goods are close substitute of each other. The market price is
determined by equating market supply of industry with market demand of all customers
(Kirzner 2017). Hence, a unique price is charged at which every seller can sale their products
and every buyer can buy the one. This means, each buyer and seller is price-taker. However,
in the given case study, two restaurants have charged different prices for their foods. This is
not the characteristic of a perfectly competitive market. Hence, those restaurants are not
performing under this market environment.
According to the given situation, restaurants are operated under monopolistically
competitive market, where characteristics of both perfect competition and monopoly can be
seen. Under this monopolistically competitive market, large numbers of sellers sell products
to the large number of buyers (Assenza, Grazzini, Hommes and Massaro 2015). Here,
products, which are sold in the market, can be said as close substitute but the not the perfect
one and this in turn has helped a seller to behave like a monopolist. Consequently, each seller
Paraphrase This Document
Need a fresh take? Get an instant paraphrase of this document with our AI Paraphraser
7ECONOMICS ASSIGNMENT
Price and cost
Output
O Qe
Pe
P0
D=AR=P
MR
MC
AC
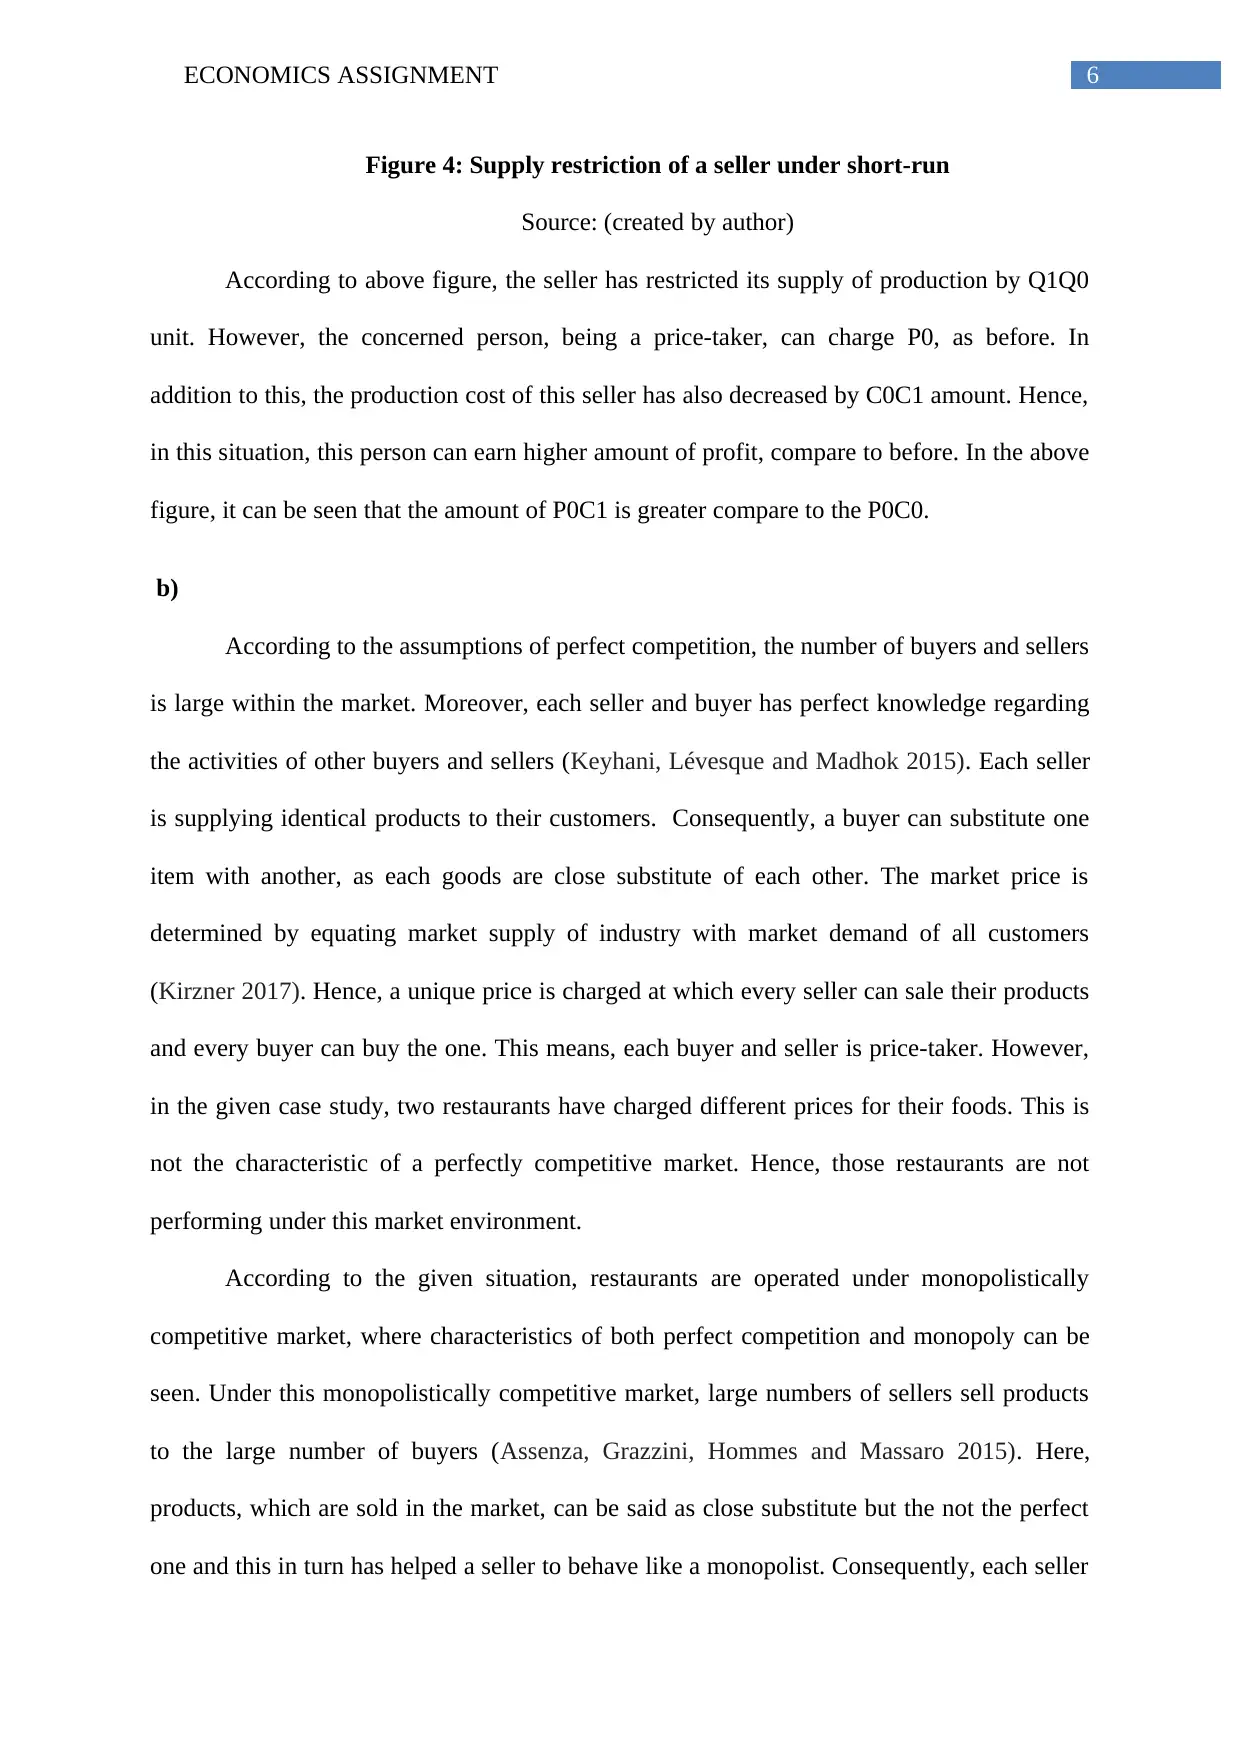
faces a negatively sloped demand curve and can charge any prices. Based on those different
prices, consumers decide their quantity of demand. Moreover, each seller bears an extra cost
for advertisement due to product differentiation. This helps them to attract customers (Dorn et
al. 2017). The seller can enjoy normal profit, excess profit or can incur loss during their
short-run operation. However, in the long-run, those sellers can leave the market if they incur
only loses. This means, a firm can freely enter into the market or can leave from the one.
Based on the above discussion, it can be said that, under this perfectly monopolistic
market, different firms can set different amount of prices. This phenomenon has also
happened in the given extract. Here, two different restaurants have charged two different
levels of prices. Moreover, due to this phenomenon, two restaurants have also experienced
different level of demand for their products. On the other side, under a perfectly competitive
market, those restaurants need to charge same amount of prices (Gerakos and Syverson
2017). This is because; each seller and buyer acts as a price-taker under this competitive
market.
Price and cost
Output
O Qe
Pe
P0
D=AR=P
MR
MC
AC
faces a negatively sloped demand curve and can charge any prices. Based on those different
prices, consumers decide their quantity of demand. Moreover, each seller bears an extra cost
for advertisement due to product differentiation. This helps them to attract customers (Dorn et
al. 2017). The seller can enjoy normal profit, excess profit or can incur loss during their
short-run operation. However, in the long-run, those sellers can leave the market if they incur
only loses. This means, a firm can freely enter into the market or can leave from the one.
Based on the above discussion, it can be said that, under this perfectly monopolistic
market, different firms can set different amount of prices. This phenomenon has also
happened in the given extract. Here, two different restaurants have charged two different
levels of prices. Moreover, due to this phenomenon, two restaurants have also experienced
different level of demand for their products. On the other side, under a perfectly competitive
market, those restaurants need to charge same amount of prices (Gerakos and Syverson
2017). This is because; each seller and buyer acts as a price-taker under this competitive
market.
8ECONOMICS ASSIGNMENT
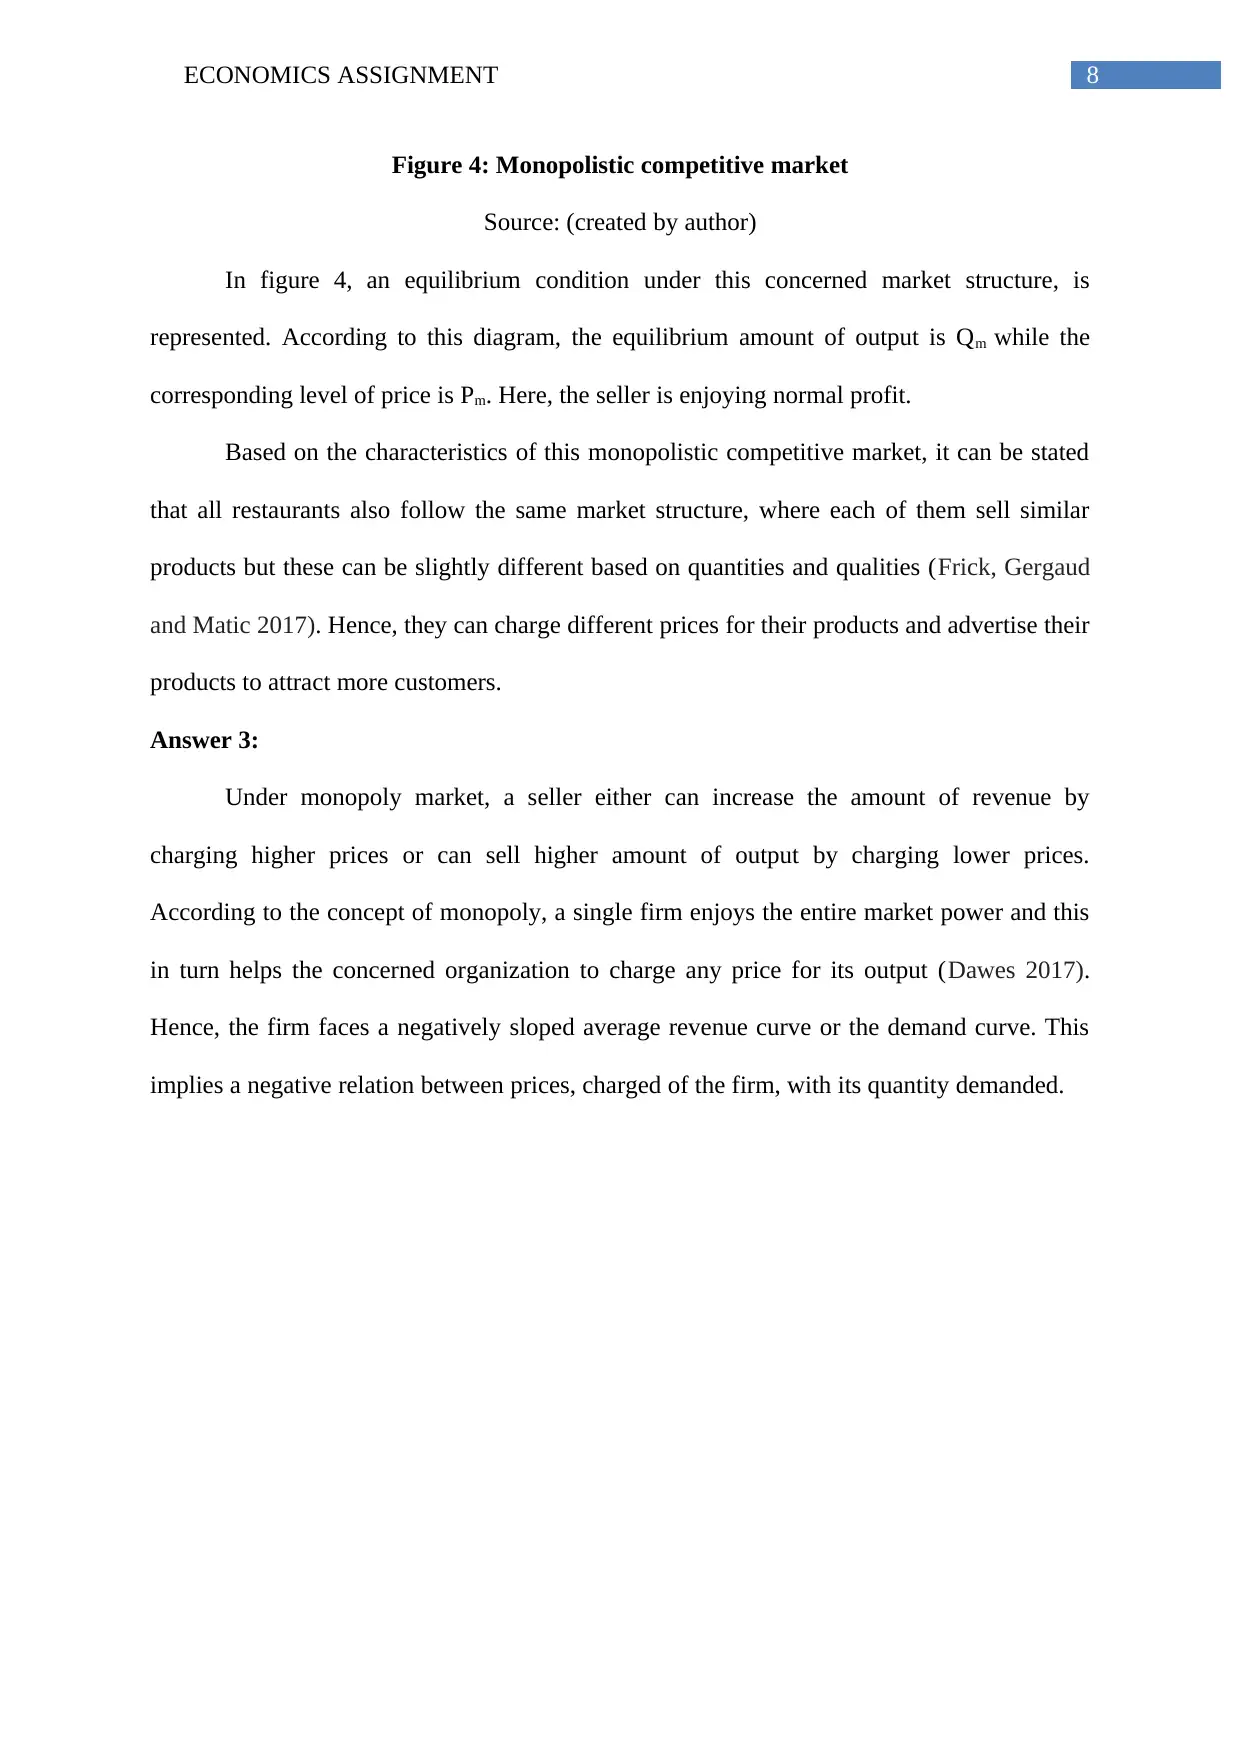
Figure 4: Monopolistic competitive market
Source: (created by author)
In figure 4, an equilibrium condition under this concerned market structure, is
represented. According to this diagram, the equilibrium amount of output is Qm while the
corresponding level of price is Pm. Here, the seller is enjoying normal profit.
Based on the characteristics of this monopolistic competitive market, it can be stated
that all restaurants also follow the same market structure, where each of them sell similar
products but these can be slightly different based on quantities and qualities (Frick, Gergaud
and Matic 2017). Hence, they can charge different prices for their products and advertise their
products to attract more customers.
Answer 3:
Under monopoly market, a seller either can increase the amount of revenue by
charging higher prices or can sell higher amount of output by charging lower prices.
According to the concept of monopoly, a single firm enjoys the entire market power and this
in turn helps the concerned organization to charge any price for its output (Dawes 2017).
Hence, the firm faces a negatively sloped average revenue curve or the demand curve. This
implies a negative relation between prices, charged of the firm, with its quantity demanded.
⊘ This is a preview!⊘
Do you want full access?
Subscribe today to unlock all pages.
Trusted by 1+ million students worldwide
9ECONOMICS ASSIGNMENT
Price and cost
Output
O Qe
Pe
P1
D=AR=P
MR
MC
AC
Q1
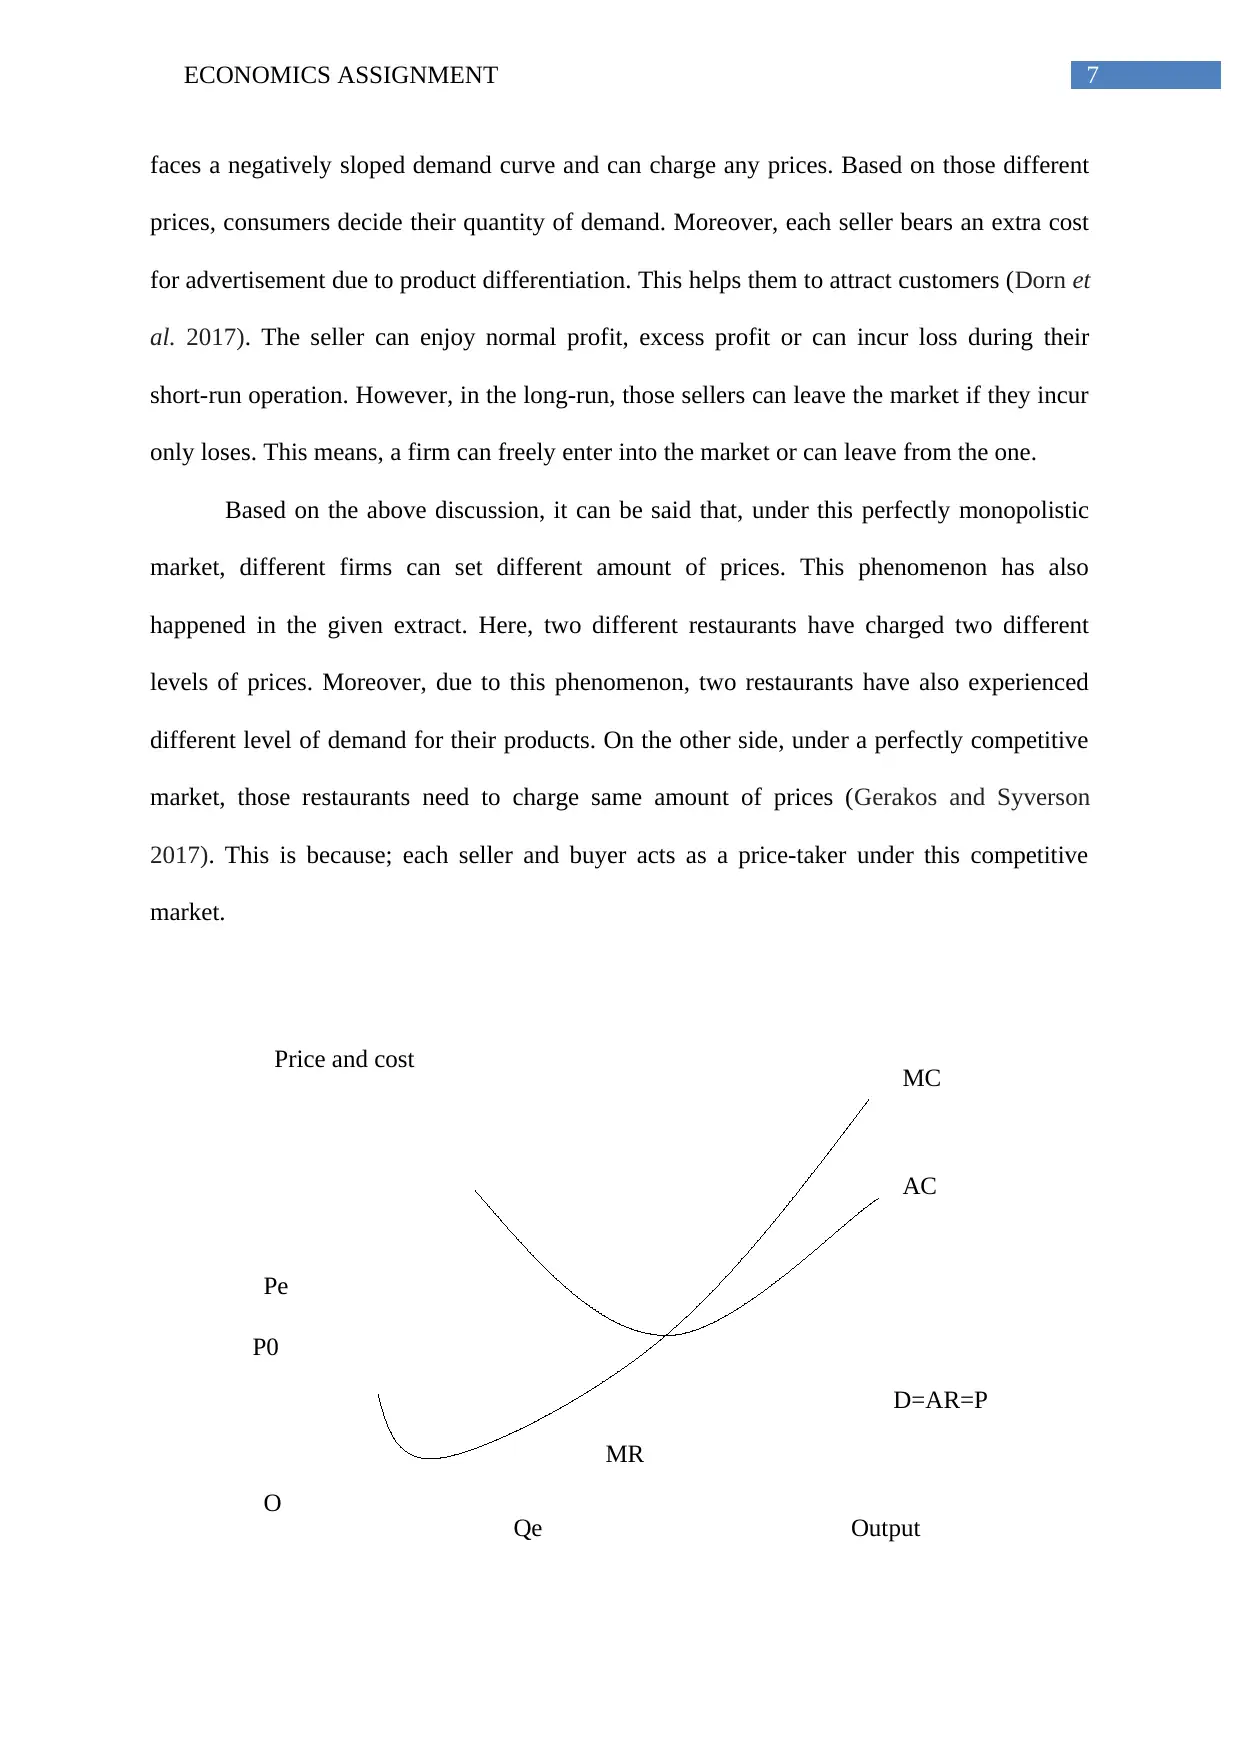
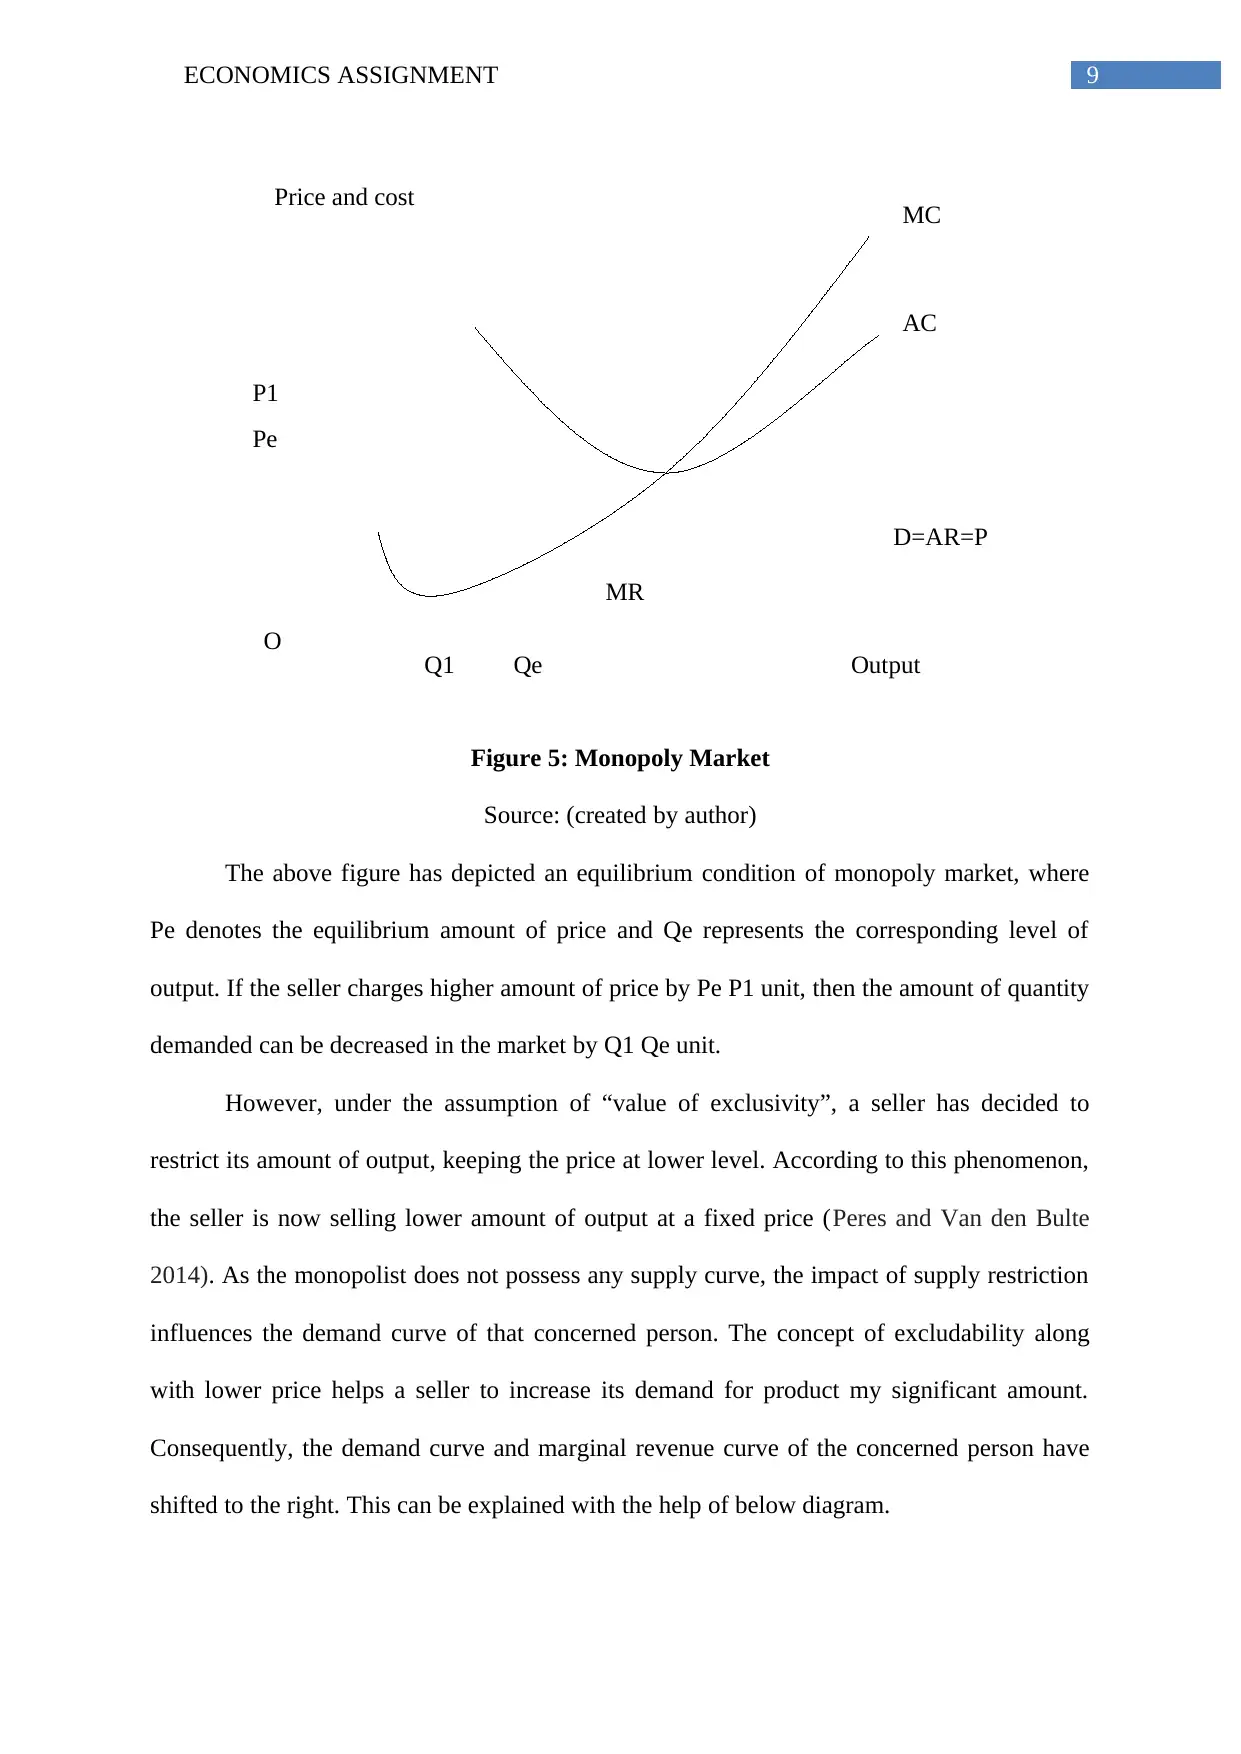
Figure 5: Monopoly Market
Source: (created by author)
The above figure has depicted an equilibrium condition of monopoly market, where
Pe denotes the equilibrium amount of price and Qe represents the corresponding level of
output. If the seller charges higher amount of price by Pe P1 unit, then the amount of quantity
demanded can be decreased in the market by Q1 Qe unit.
However, under the assumption of “value of exclusivity”, a seller has decided to
restrict its amount of output, keeping the price at lower level. According to this phenomenon,
the seller is now selling lower amount of output at a fixed price (Peres and Van den Bulte
2014). As the monopolist does not possess any supply curve, the impact of supply restriction
influences the demand curve of that concerned person. The concept of excludability along
with lower price helps a seller to increase its demand for product my significant amount.
Consequently, the demand curve and marginal revenue curve of the concerned person have
shifted to the right. This can be explained with the help of below diagram.
Price and cost
Output
O Qe
Pe
P1
D=AR=P
MR
MC
AC
Q1
Figure 5: Monopoly Market
Source: (created by author)
The above figure has depicted an equilibrium condition of monopoly market, where
Pe denotes the equilibrium amount of price and Qe represents the corresponding level of
output. If the seller charges higher amount of price by Pe P1 unit, then the amount of quantity
demanded can be decreased in the market by Q1 Qe unit.
However, under the assumption of “value of exclusivity”, a seller has decided to
restrict its amount of output, keeping the price at lower level. According to this phenomenon,
the seller is now selling lower amount of output at a fixed price (Peres and Van den Bulte
2014). As the monopolist does not possess any supply curve, the impact of supply restriction
influences the demand curve of that concerned person. The concept of excludability along
with lower price helps a seller to increase its demand for product my significant amount.
Consequently, the demand curve and marginal revenue curve of the concerned person have
shifted to the right. This can be explained with the help of below diagram.
Paraphrase This Document
Need a fresh take? Get an instant paraphrase of this document with our AI Paraphraser
10ECONOMICS ASSIGNMENT
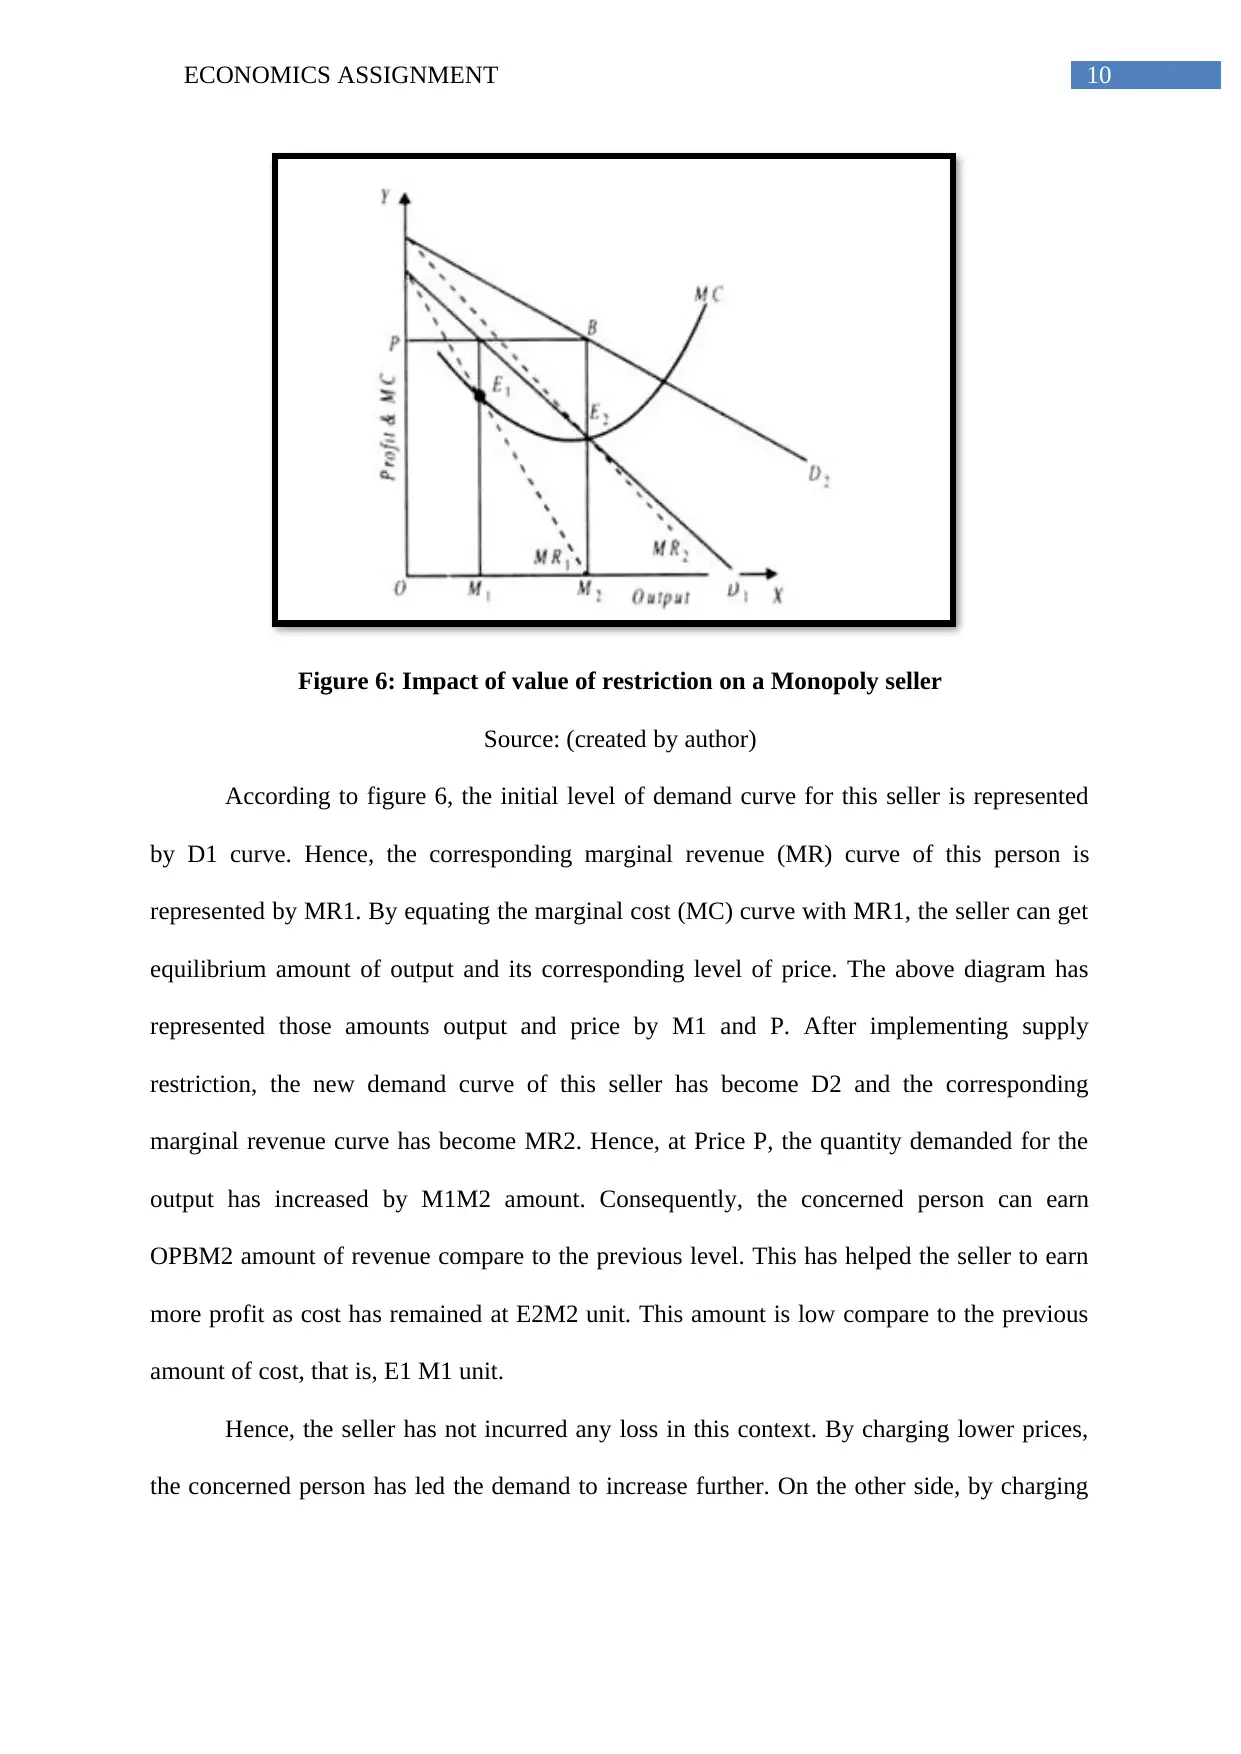
Figure 6: Impact of value of restriction on a Monopoly seller
Source: (created by author)
According to figure 6, the initial level of demand curve for this seller is represented
by D1 curve. Hence, the corresponding marginal revenue (MR) curve of this person is
represented by MR1. By equating the marginal cost (MC) curve with MR1, the seller can get
equilibrium amount of output and its corresponding level of price. The above diagram has
represented those amounts output and price by M1 and P. After implementing supply
restriction, the new demand curve of this seller has become D2 and the corresponding
marginal revenue curve has become MR2. Hence, at Price P, the quantity demanded for the
output has increased by M1M2 amount. Consequently, the concerned person can earn
OPBM2 amount of revenue compare to the previous level. This has helped the seller to earn
more profit as cost has remained at E2M2 unit. This amount is low compare to the previous
amount of cost, that is, E1 M1 unit.
Hence, the seller has not incurred any loss in this context. By charging lower prices,
the concerned person has led the demand to increase further. On the other side, by charging
11ECONOMICS ASSIGNMENT
Price
O
P1
P0
OutputQ0
MC
D0
D1
MR0MR1
AC
C
higher prices, seller can influence the demand adversely and this in turn can force the profit
of that person to decrease by significant amount.
Answer 4:
a)
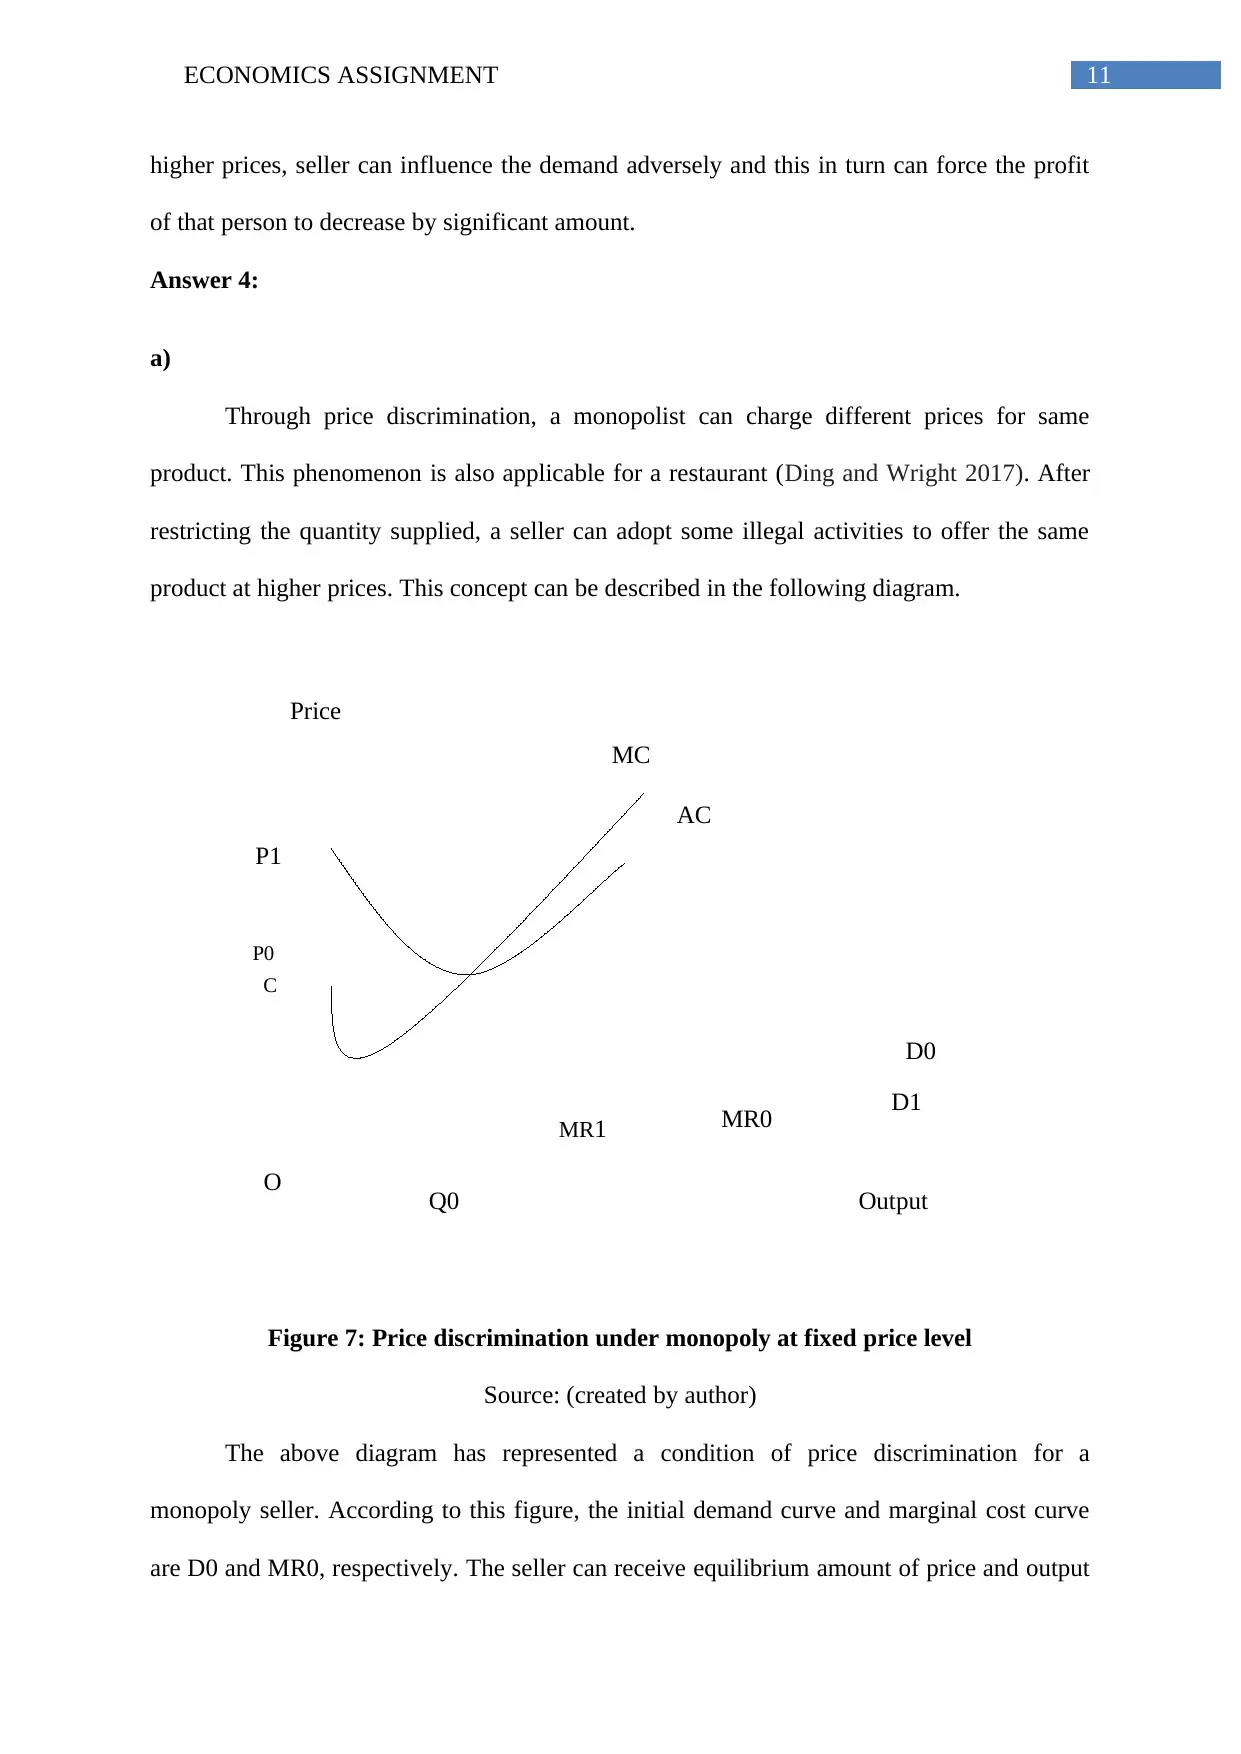
Through price discrimination, a monopolist can charge different prices for same
product. This phenomenon is also applicable for a restaurant (Ding and Wright 2017). After
restricting the quantity supplied, a seller can adopt some illegal activities to offer the same
product at higher prices. This concept can be described in the following diagram.
Figure 7: Price discrimination under monopoly at fixed price level
Source: (created by author)
The above diagram has represented a condition of price discrimination for a
monopoly seller. According to this figure, the initial demand curve and marginal cost curve
are D0 and MR0, respectively. The seller can receive equilibrium amount of price and output
Price
O
P1
P0
OutputQ0
MC
D0
D1
MR0MR1
AC
C
higher prices, seller can influence the demand adversely and this in turn can force the profit
of that person to decrease by significant amount.
Answer 4:
a)
Through price discrimination, a monopolist can charge different prices for same
product. This phenomenon is also applicable for a restaurant (Ding and Wright 2017). After
restricting the quantity supplied, a seller can adopt some illegal activities to offer the same
product at higher prices. This concept can be described in the following diagram.
Figure 7: Price discrimination under monopoly at fixed price level
Source: (created by author)
The above diagram has represented a condition of price discrimination for a
monopoly seller. According to this figure, the initial demand curve and marginal cost curve
are D0 and MR0, respectively. The seller can receive equilibrium amount of price and output
⊘ This is a preview!⊘
Do you want full access?
Subscribe today to unlock all pages.
Trusted by 1+ million students worldwide
1 out of 20
Related Documents


Your All-in-One AI-Powered Toolkit for Academic Success.
+13062052269
info@desklib.com
Available 24*7 on WhatsApp / Email
![[object Object]](/_next/static/media/star-bottom.7253800d.svg)
Unlock your academic potential
Copyright © 2020–2026 A2Z Services. All Rights Reserved. Developed and managed by ZUCOL.