University Economics 101: Assignment 1 - Microeconomic Analysis
VerifiedAdded on 2020/03/13
|10
|2590
|90
Homework Assignment
AI Summary
This economics assignment delves into fundamental microeconomic concepts, starting with an explanation of the production possibility curve and the concept of scarcity. It explores the economic system of India, analyzing its evolution from a mixed economy to a more market-oriented approach. The assignment then examines market dynamics, including supply and demand schedules for ice cream, calculating equilibrium price, consumer surplus, and producer surplus, and analyzing the impact of seasonal changes. Further questions address government interventions like price floors in the milk market and their effects on farmers' income. The assignment concludes with calculations of price elasticity of demand, using the midpoint method, and an analysis of how elasticity changes during different periods, along with a complete cost schedule for a gardening company, determining the profit-maximizing output level in a perfectly competitive market.
Assignment 1
Due: 9pmTuesday,15 August, 2017(Week 6)
Weighting: 25%
Note that when you are answering questions that require mathematical calculations, you should
provide details as to how the answers were derived.In completing your answers, you should use
graphs wherever possible. Always provide a brief explanation of each graph, including how it relates
to your overall answer/argument.
Question 1
a. Explain why a production possibility curve is usually bowed outward rather than being a
straight line.
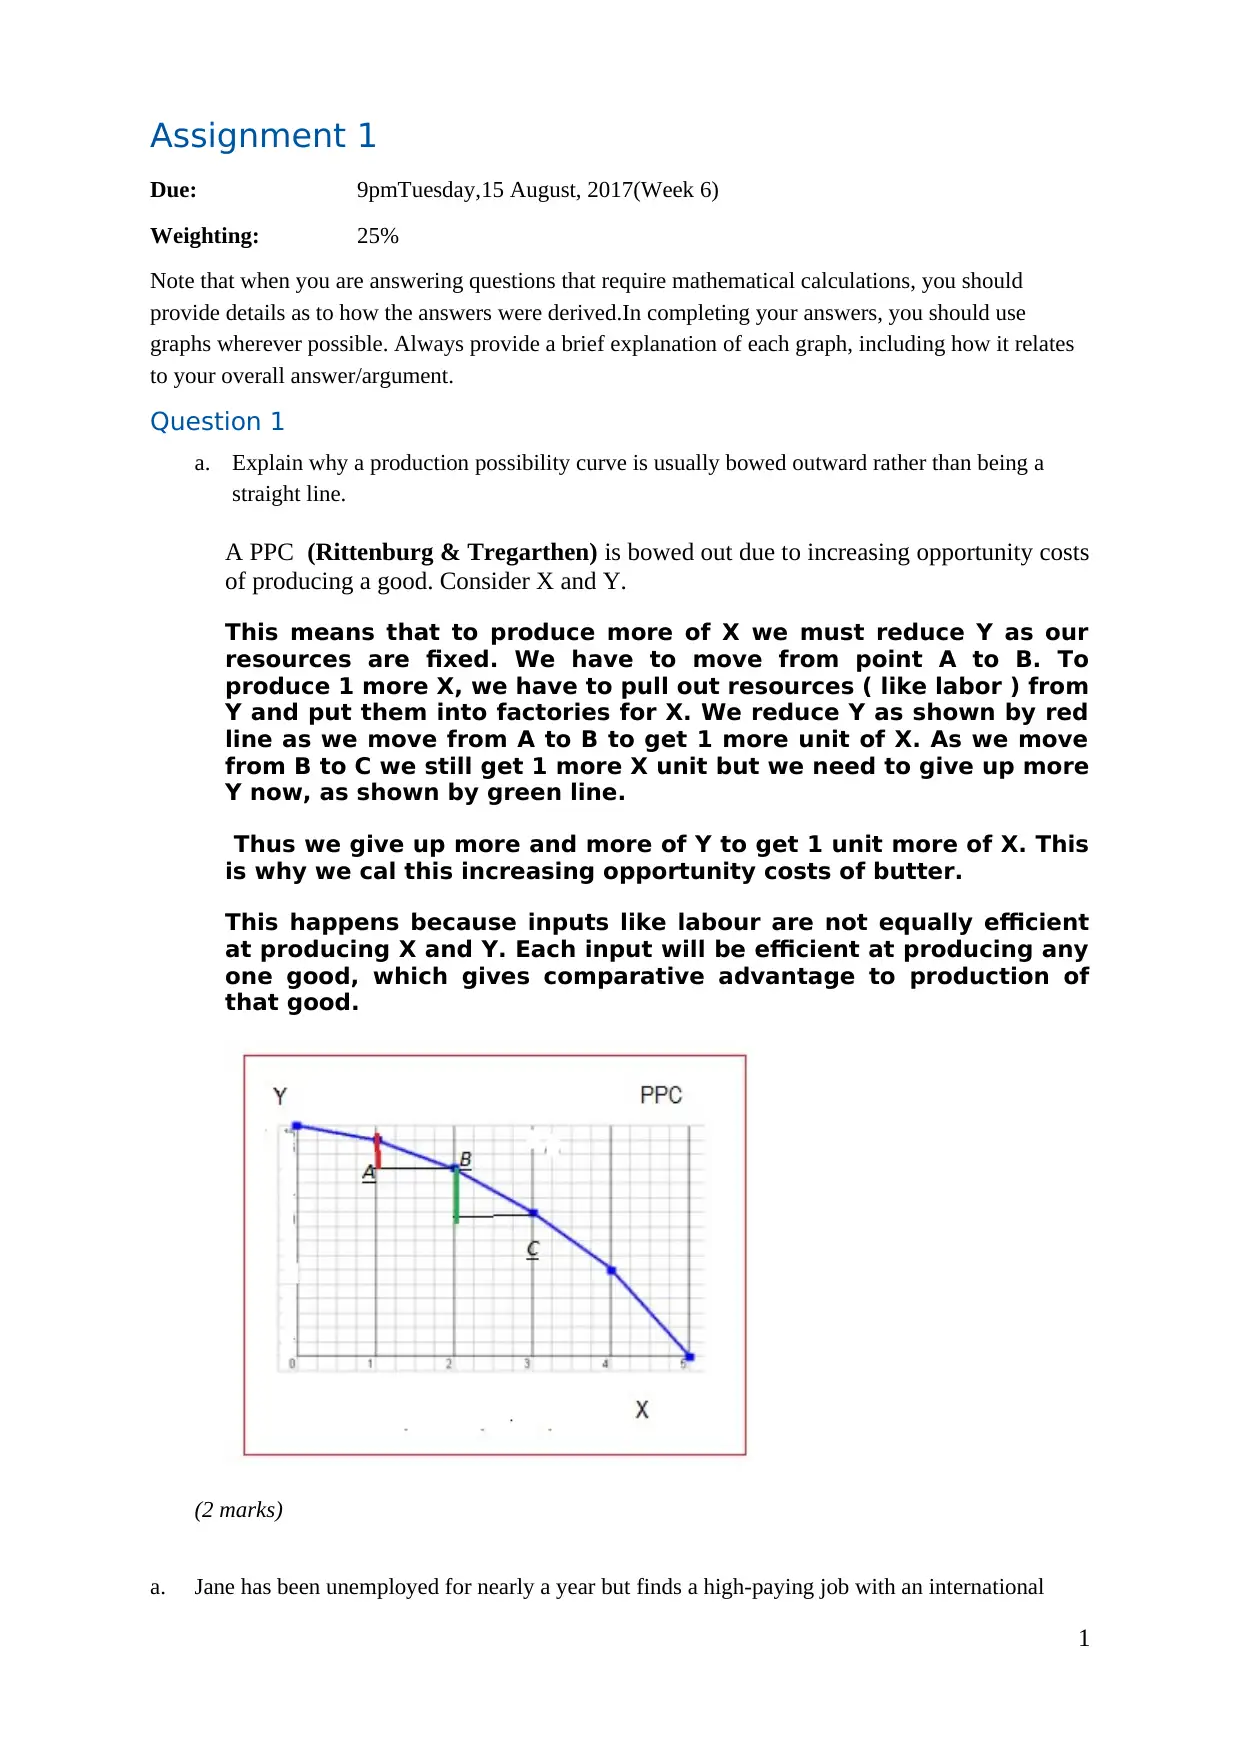
A PPC (Rittenburg & Tregarthen) is bowed out due to increasing opportunity costs
of producing a good. Consider X and Y.
This means that to produce more of X we must reduce Y as our
resources are fixed. We have to move from point A to B. To
produce 1 more X, we have to pull out resources ( like labor ) from
Y and put them into factories for X. We reduce Y as shown by red
line as we move from A to B to get 1 more unit of X. As we move
from B to C we still get 1 more X unit but we need to give up more
Y now, as shown by green line.
Thus we give up more and more of Y to get 1 unit more of X. This
is why we cal this increasing opportunity costs of butter.
This happens because inputs like labour are not equally efficient
at producing X and Y. Each input will be efficient at producing any
one good, which gives comparative advantage to production of
that good.
(2 marks)
a. Jane has been unemployed for nearly a year but finds a high-paying job with an international
1
Due: 9pmTuesday,15 August, 2017(Week 6)
Weighting: 25%
Note that when you are answering questions that require mathematical calculations, you should
provide details as to how the answers were derived.In completing your answers, you should use
graphs wherever possible. Always provide a brief explanation of each graph, including how it relates
to your overall answer/argument.
Question 1
a. Explain why a production possibility curve is usually bowed outward rather than being a
straight line.
A PPC (Rittenburg & Tregarthen) is bowed out due to increasing opportunity costs
of producing a good. Consider X and Y.
This means that to produce more of X we must reduce Y as our
resources are fixed. We have to move from point A to B. To
produce 1 more X, we have to pull out resources ( like labor ) from
Y and put them into factories for X. We reduce Y as shown by red
line as we move from A to B to get 1 more unit of X. As we move
from B to C we still get 1 more X unit but we need to give up more
Y now, as shown by green line.
Thus we give up more and more of Y to get 1 unit more of X. This
is why we cal this increasing opportunity costs of butter.
This happens because inputs like labour are not equally efficient
at producing X and Y. Each input will be efficient at producing any
one good, which gives comparative advantage to production of
that good.
(2 marks)
a. Jane has been unemployed for nearly a year but finds a high-paying job with an international
1
Paraphrase This Document
Need a fresh take? Get an instant paraphrase of this document with our AI Paraphraser
hotel firm. Does this mean that Jane will no longer experience the problem of ‘scarcity’? Explain
the reasons for your answer.
Scarcity is a macro issue, from the economy level. It means that jobs available are lesser than the
no of persons who are looking for work. For each person who has a job there is no scarcity as
long as he has a job. For someone who is unemployed there is scarcity of jobs.
As long as Jane has a job she does not face scarcity. If unemployed there is scarcity of jobs for
her.,
(3 marks)
b. Every country has an economic system that has been established to address the problem of
scarcity. Describe the economic system of a country other than Australia. Justify your assessment
of the system by considering the major factors that determinean economic system within a
country (300 words maximum).
Consider India as a country. When it became free of British colonial rule in 1947 it adopted
mixed economy model of an economic system. It allowed some sectors to have private producers
but reserved many sectors for State production only- defence, heavy machines, etc. This was
done as resources were scarce and the needs of a poor nation were manifold. It was thought that
State allocation of resources is best to overcome the scarcity problem.
India first policy - Industrial Policy of 1948 was framed under the mixed
economy concept, allowing a role for private and public sector. It was
followed by Industrial Policy 1956. IT clearly came out in favour of wide
spread State involvement in industrial activities. 17 industries were made
the exclusive domain of State. No private sector was allowed in these
industries- arms and ammunition, atomic energy, iron and steel, heavy
castings and forgings of iron and steel, heavy machinery, heavy electrical
industries, coal, mineral oil, mining; iron ore and other important minerals
like, copper, lead and zinc; railway transport, aircraft, ship building,
telephone, telegraph and wireless equipment, and generation and
distribution of electricity. (Jadhav, n.d.)
This policy was later reversed in 1991, when India embarked on reforms. The cause of this
change was the difference in economic strenght of India in 1947 and 1991. In 1947 India was
poor and under developed- with scarce resources- financial and non financial. It needed to build
on its limited resources to grow. By 1991 India was better placed and had built up certain basic
industries and started deregulating many industries. The process of privatisation was made
possible due to availability of more resources that were better and more efficient than those in
1947. (Home.fau.edu, n.d.)
This is clear case of resource availability dictating the economic system adopted by a nation.
(5 marks)
2
Question 2
a. The table below shows the demand and supply for ice creams.
Price of an ice cream
($)
Quantity demanded
(‘000)
Quantity supplied
(‘000)
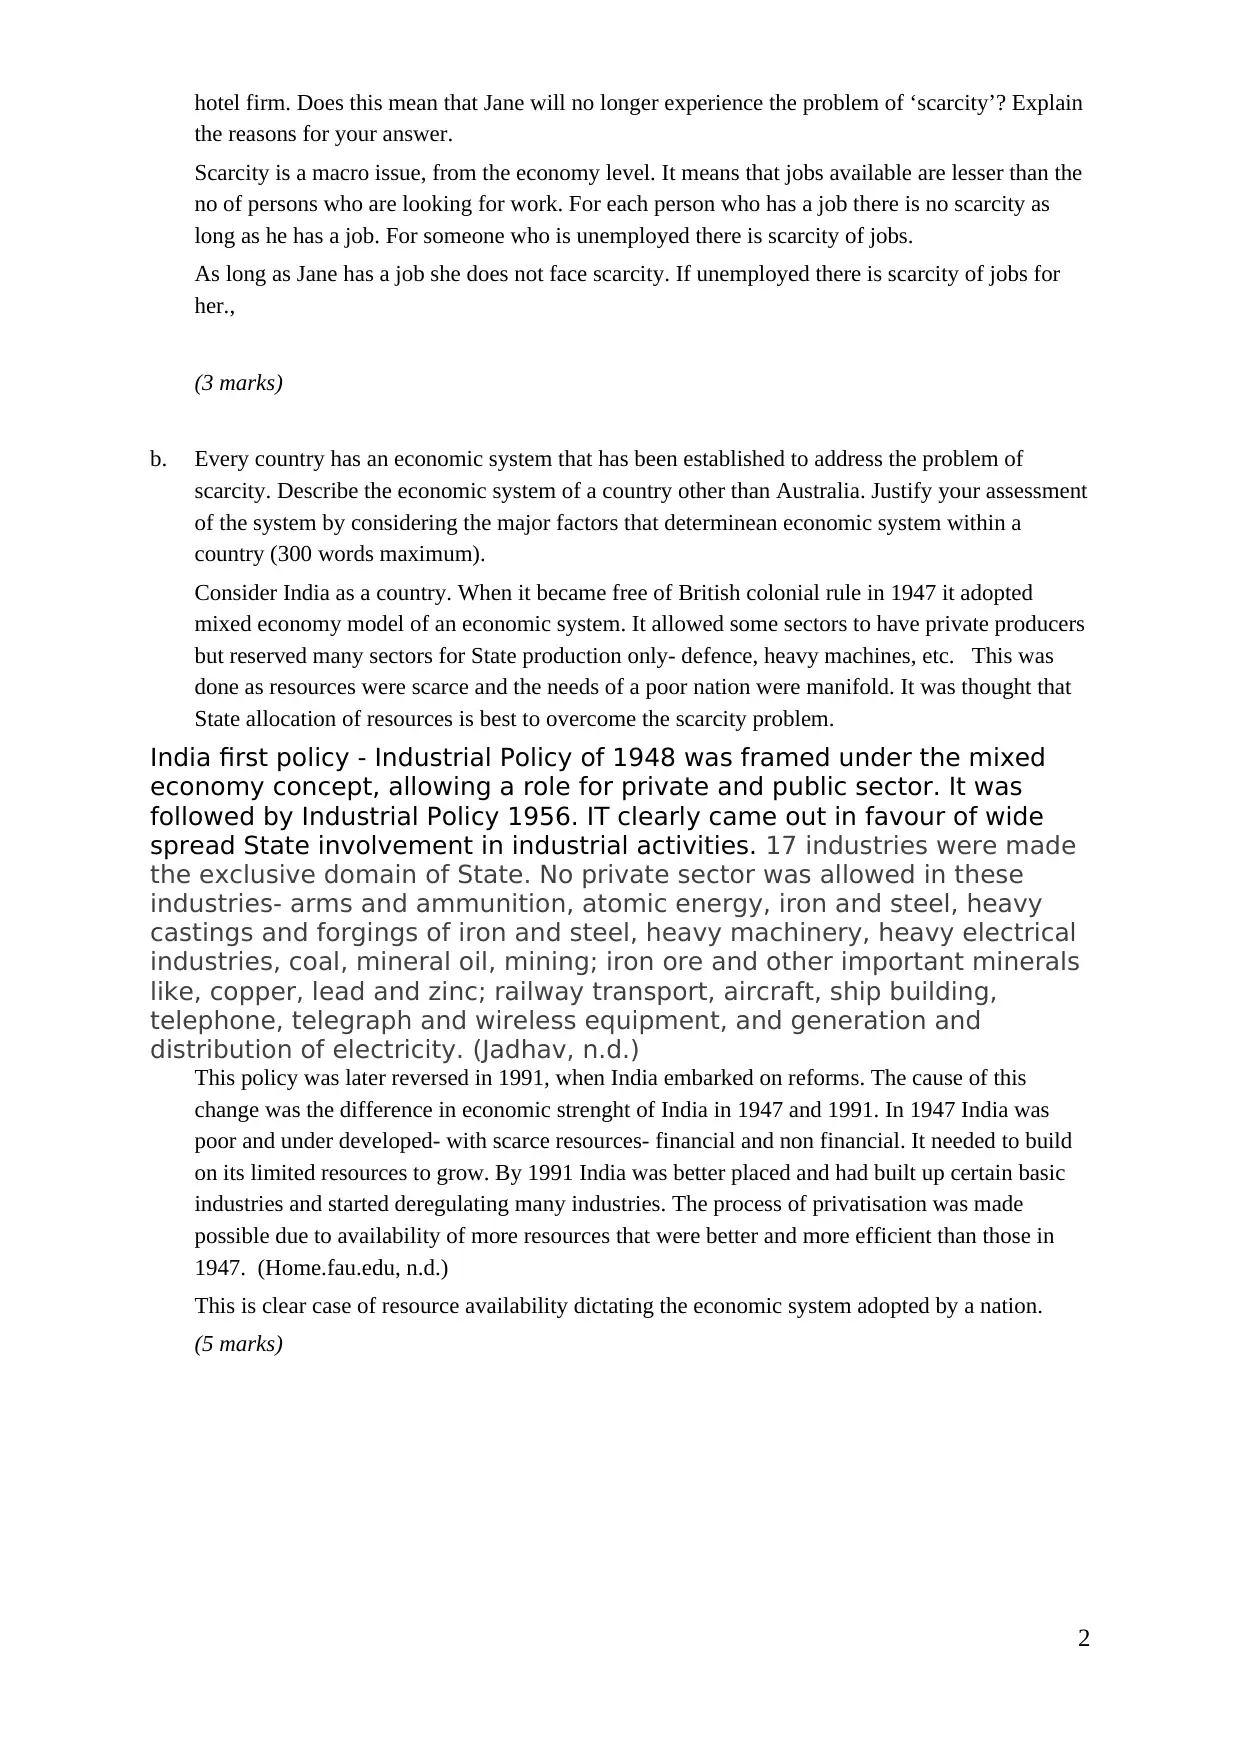
0.00 19 0
0.50 16 0
1.00 13 1
1.50 10 4
2.00 7 7
2.50 4 10
3.00 1 13
i. Graph the following demand and supply schedules.
(2 marks)
3
a. The table below shows the demand and supply for ice creams.
Price of an ice cream
($)
Quantity demanded
(‘000)
Quantity supplied
(‘000)
0.00 19 0
0.50 16 0
1.00 13 1
1.50 10 4
2.00 7 7
2.50 4 10
3.00 1 13
i. Graph the following demand and supply schedules.
(2 marks)
3
⊘ This is a preview!⊘
Do you want full access?
Subscribe today to unlock all pages.
Trusted by 1+ million students worldwide
ii. What is the equilibrium price and quantity in this market for ice creams?
(1 mark)
P = $2 and Q= 7000
iii. Calculate the consumer surplus and producer surplus at the equilibrium in this market.
(4 marks)
We need P when DD is zero. This will happen when P = 3.33 using the logic given in the table
( for every $0.5 change in price demand changes by 3 units)
Consumer surplus = ½ *( 3.33-2) *7000 = 4655
Producer surplus = ½ *( 2-0.5) *7000 = 5250
iv. Assume that the demand schedule for ice creams outlined above is for summer. What do you
think will happen to equilibrium price and quantity for ice creams during winter? Explain the
reason for your answer.
(2 marks)
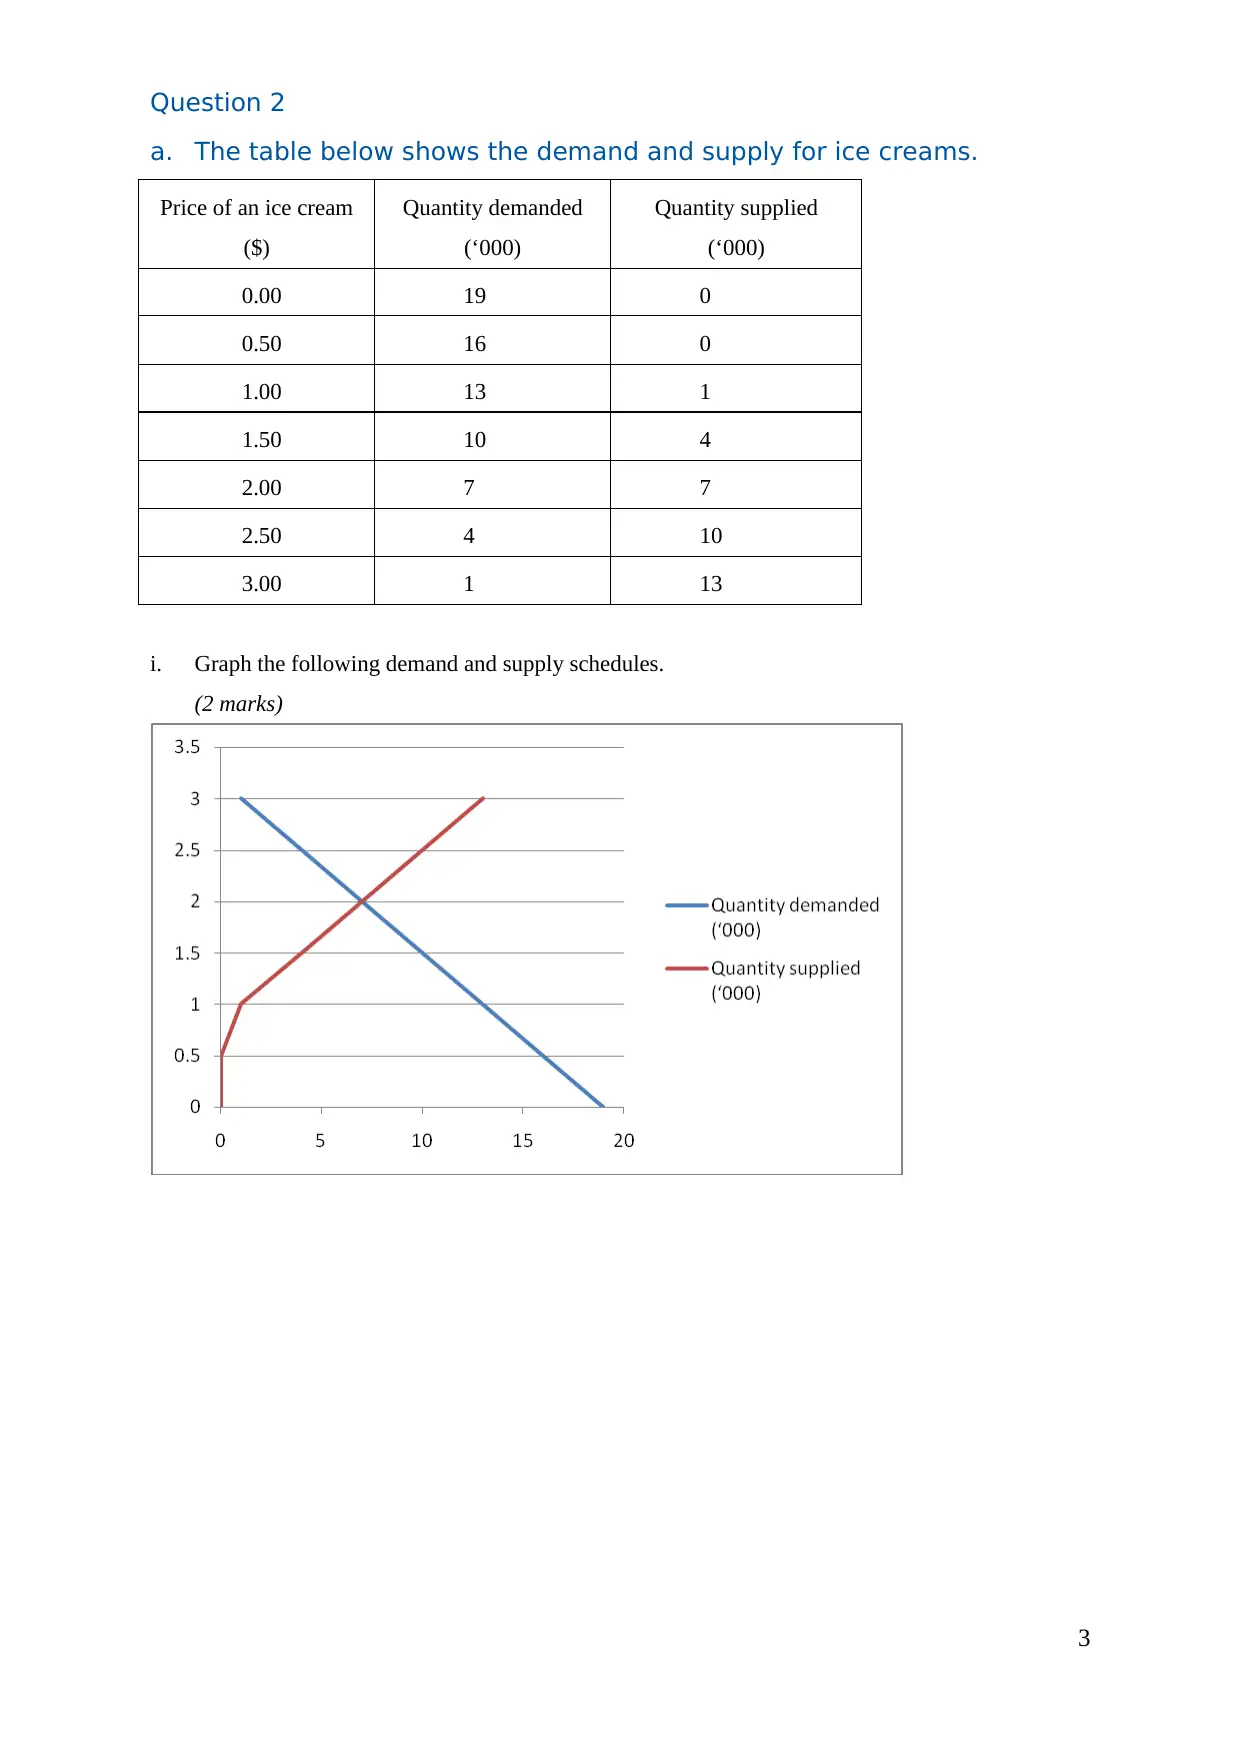
In winters the demand for ice cream is likely to fall. This is shown as a left shift of the DD. This
will cause price and quantity to fall. The assumption is that there is no change in supply or any
other demand determinant ( like income and consumer preferences). The lwinter demand is to
left of original demand so that equilibrium price and quantity is lower.
v. What do you think will happen to consumer and producer surplus as a consequence of the change
in equilibrium price and quantity for ice creams during winter? Explain the reason for your
answer.
(1 mark)
As the price falls in winters, we can expect consumer surplus to rise. However the fall in quantity
must not be larger than fall in price. This is because consumer surplus depends on price and
quantity. In general price decline leads to higher consumer surplus, but we still need to check the
fall in quantity.
If consumer surplus rises we expect producer surplus to fall. This is because total welfare = sum
of consumer and producer surplus. An exact answer needs data on the extent of decline in
demand in winters.
Question 3
4
(1 mark)
P = $2 and Q= 7000
iii. Calculate the consumer surplus and producer surplus at the equilibrium in this market.
(4 marks)
We need P when DD is zero. This will happen when P = 3.33 using the logic given in the table
( for every $0.5 change in price demand changes by 3 units)
Consumer surplus = ½ *( 3.33-2) *7000 = 4655
Producer surplus = ½ *( 2-0.5) *7000 = 5250
iv. Assume that the demand schedule for ice creams outlined above is for summer. What do you
think will happen to equilibrium price and quantity for ice creams during winter? Explain the
reason for your answer.
(2 marks)
In winters the demand for ice cream is likely to fall. This is shown as a left shift of the DD. This
will cause price and quantity to fall. The assumption is that there is no change in supply or any
other demand determinant ( like income and consumer preferences). The lwinter demand is to
left of original demand so that equilibrium price and quantity is lower.
v. What do you think will happen to consumer and producer surplus as a consequence of the change
in equilibrium price and quantity for ice creams during winter? Explain the reason for your
answer.
(1 mark)
As the price falls in winters, we can expect consumer surplus to rise. However the fall in quantity
must not be larger than fall in price. This is because consumer surplus depends on price and
quantity. In general price decline leads to higher consumer surplus, but we still need to check the
fall in quantity.
If consumer surplus rises we expect producer surplus to fall. This is because total welfare = sum
of consumer and producer surplus. An exact answer needs data on the extent of decline in
demand in winters.
Question 3
4
Paraphrase This Document
Need a fresh take? Get an instant paraphrase of this document with our AI Paraphraser
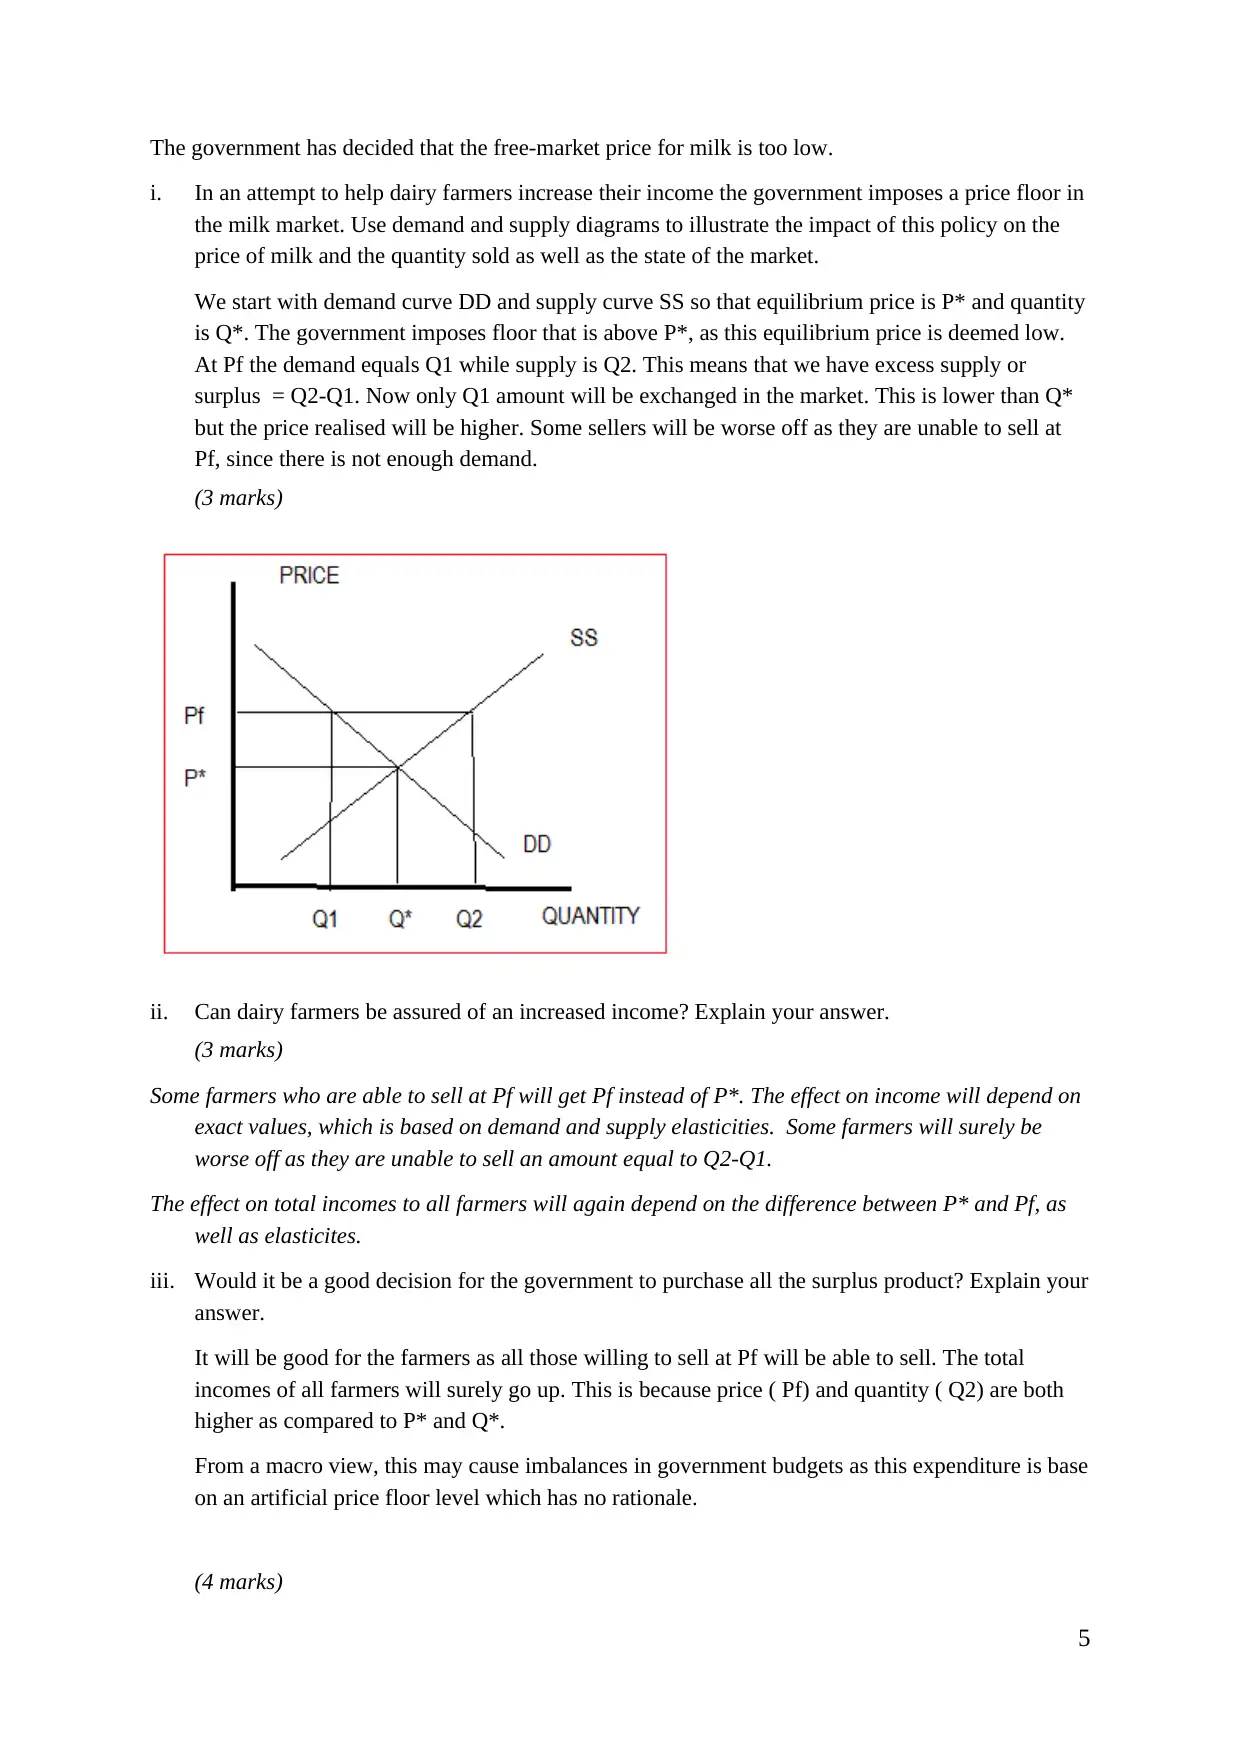
The government has decided that the free-market price for milk is too low.
i. In an attempt to help dairy farmers increase their income the government imposes a price floor in
the milk market. Use demand and supply diagrams to illustrate the impact of this policy on the
price of milk and the quantity sold as well as the state of the market.
We start with demand curve DD and supply curve SS so that equilibrium price is P* and quantity
is Q*. The government imposes floor that is above P*, as this equilibrium price is deemed low.
At Pf the demand equals Q1 while supply is Q2. This means that we have excess supply or
surplus = Q2-Q1. Now only Q1 amount will be exchanged in the market. This is lower than Q*
but the price realised will be higher. Some sellers will be worse off as they are unable to sell at
Pf, since there is not enough demand.
(3 marks)
ii. Can dairy farmers be assured of an increased income? Explain your answer.
(3 marks)
Some farmers who are able to sell at Pf will get Pf instead of P*. The effect on income will depend on
exact values, which is based on demand and supply elasticities. Some farmers will surely be
worse off as they are unable to sell an amount equal to Q2-Q1.
The effect on total incomes to all farmers will again depend on the difference between P* and Pf, as
well as elasticites.
iii. Would it be a good decision for the government to purchase all the surplus product? Explain your
answer.
It will be good for the farmers as all those willing to sell at Pf will be able to sell. The total
incomes of all farmers will surely go up. This is because price ( Pf) and quantity ( Q2) are both
higher as compared to P* and Q*.
From a macro view, this may cause imbalances in government budgets as this expenditure is base
on an artificial price floor level which has no rationale.
(4 marks)
5

6
⊘ This is a preview!⊘
Do you want full access?
Subscribe today to unlock all pages.
Trusted by 1+ million students worldwide
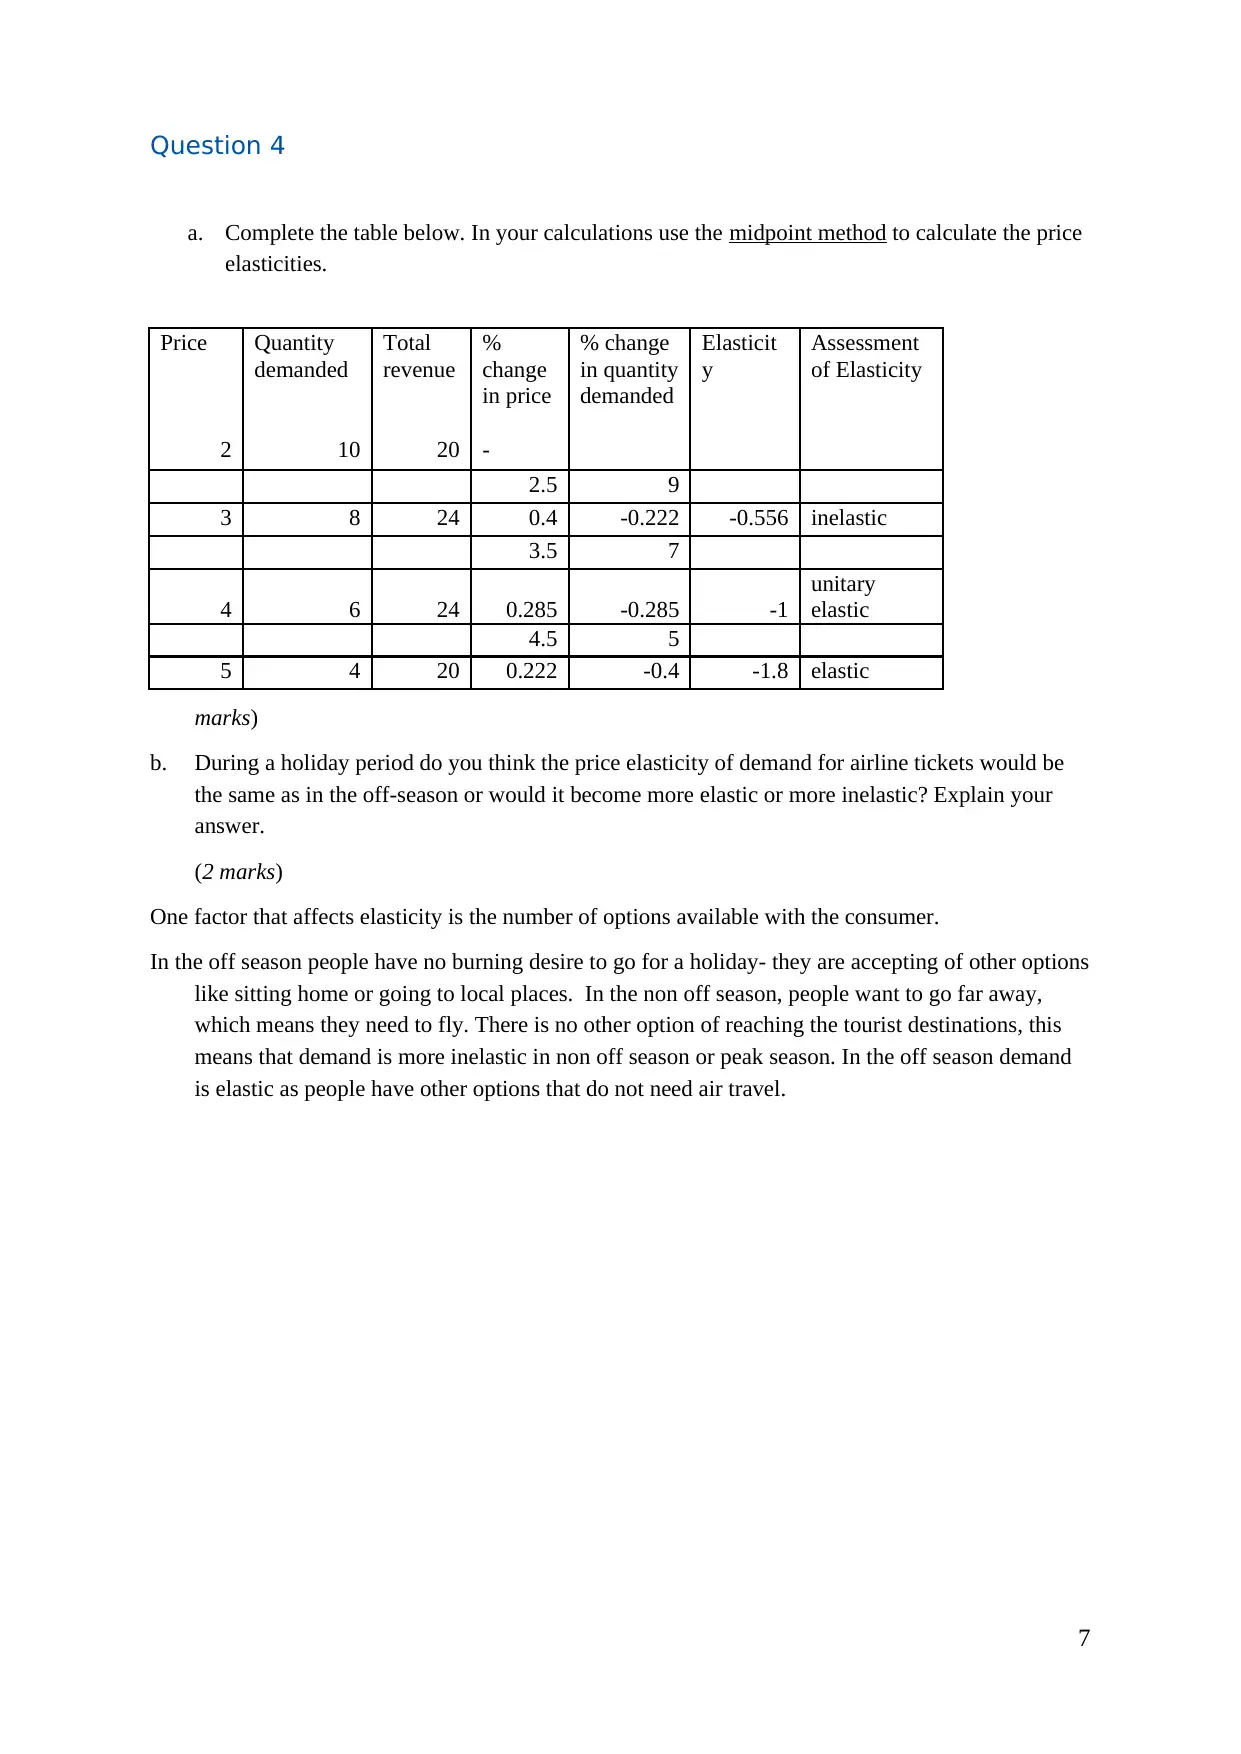
Question 4
a. Complete the table below. In your calculations use the midpoint method to calculate the price
elasticities.
Price Quantity
demanded
Total
revenue
%
change
in price
% change
in quantity
demanded
Elasticit
y
Assessment
of Elasticity
2 10 20 -
2.5 9
3 8 24 0.4 -0.222 -0.556 inelastic
3.5 7
4 6 24 0.285 -0.285 -1
unitary
elastic
4.5 5
5 4 20 0.222 -0.4 -1.8 elastic
marks)
b. During a holiday period do you think the price elasticity of demand for airline tickets would be
the same as in the off-season or would it become more elastic or more inelastic? Explain your
answer.
(2 marks)
One factor that affects elasticity is the number of options available with the consumer.
In the off season people have no burning desire to go for a holiday- they are accepting of other options
like sitting home or going to local places. In the non off season, people want to go far away,
which means they need to fly. There is no other option of reaching the tourist destinations, this
means that demand is more inelastic in non off season or peak season. In the off season demand
is elastic as people have other options that do not need air travel.
7
Paraphrase This Document
Need a fresh take? Get an instant paraphrase of this document with our AI Paraphraser
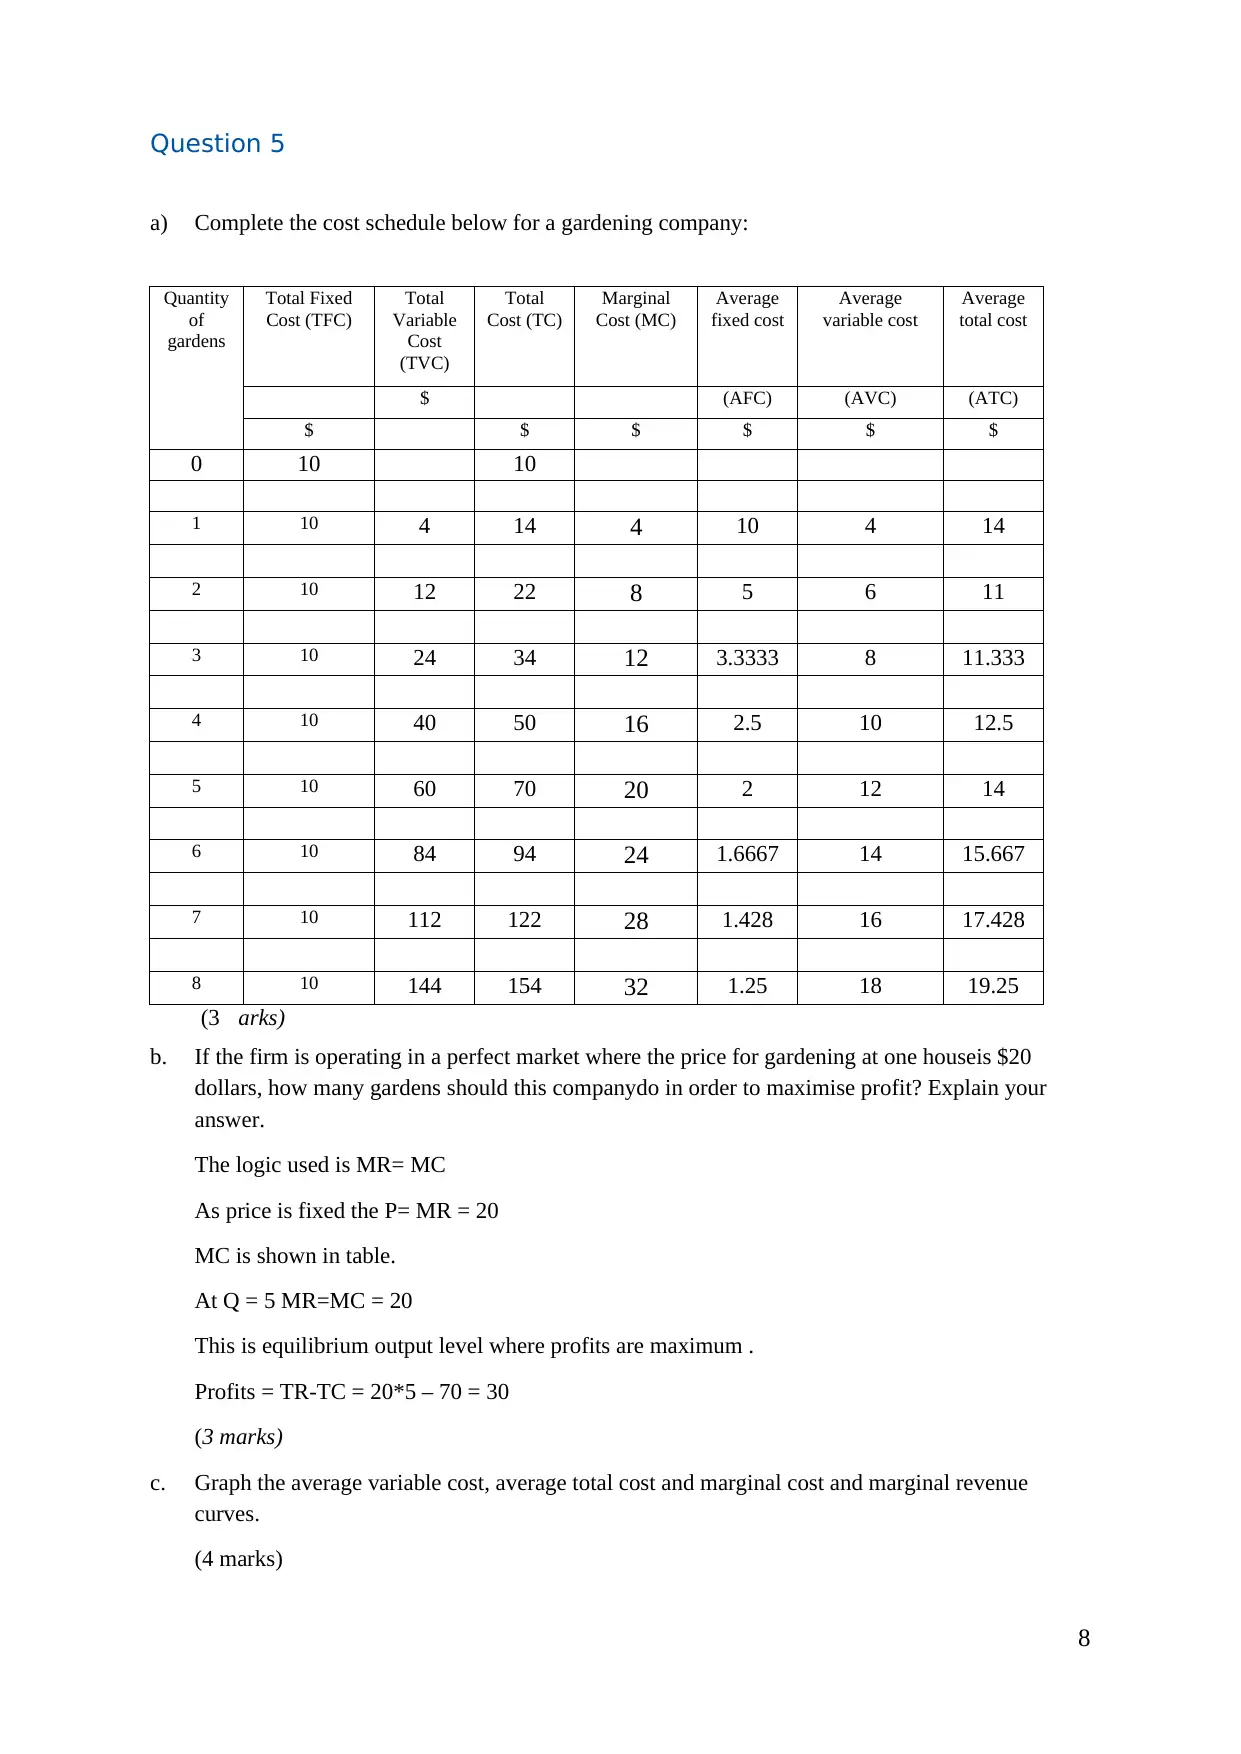
Question 5
a) Complete the cost schedule below for a gardening company:
Quantity
of
gardens
Total Fixed
Cost (TFC)
Total
Variable
Cost
(TVC)
Total
Cost (TC)
Marginal
Cost (MC)
Average
fixed cost
Average
variable cost
Average
total cost
$ (AFC) (AVC) (ATC)
$ $ $ $ $ $
0 10 10
1 10 4 14 4 10 4 14
2 10 12 22 8 5 6 11
3 10 24 34 12 3.3333 8 11.333
4 10 40 50 16 2.5 10 12.5
5 10 60 70 20 2 12 14
6 10 84 94 24 1.6667 14 15.667
7 10 112 122 28 1.428 16 17.428
8 10 144 154 32 1.25 18 19.25
(3 arks)
b. If the firm is operating in a perfect market where the price for gardening at one houseis $20
dollars, how many gardens should this companydo in order to maximise profit? Explain your
answer.
The logic used is MR= MC
As price is fixed the P= MR = 20
MC is shown in table.
At Q = 5 MR=MC = 20
This is equilibrium output level where profits are maximum .
Profits = TR-TC = 20*5 – 70 = 30
(3 marks)
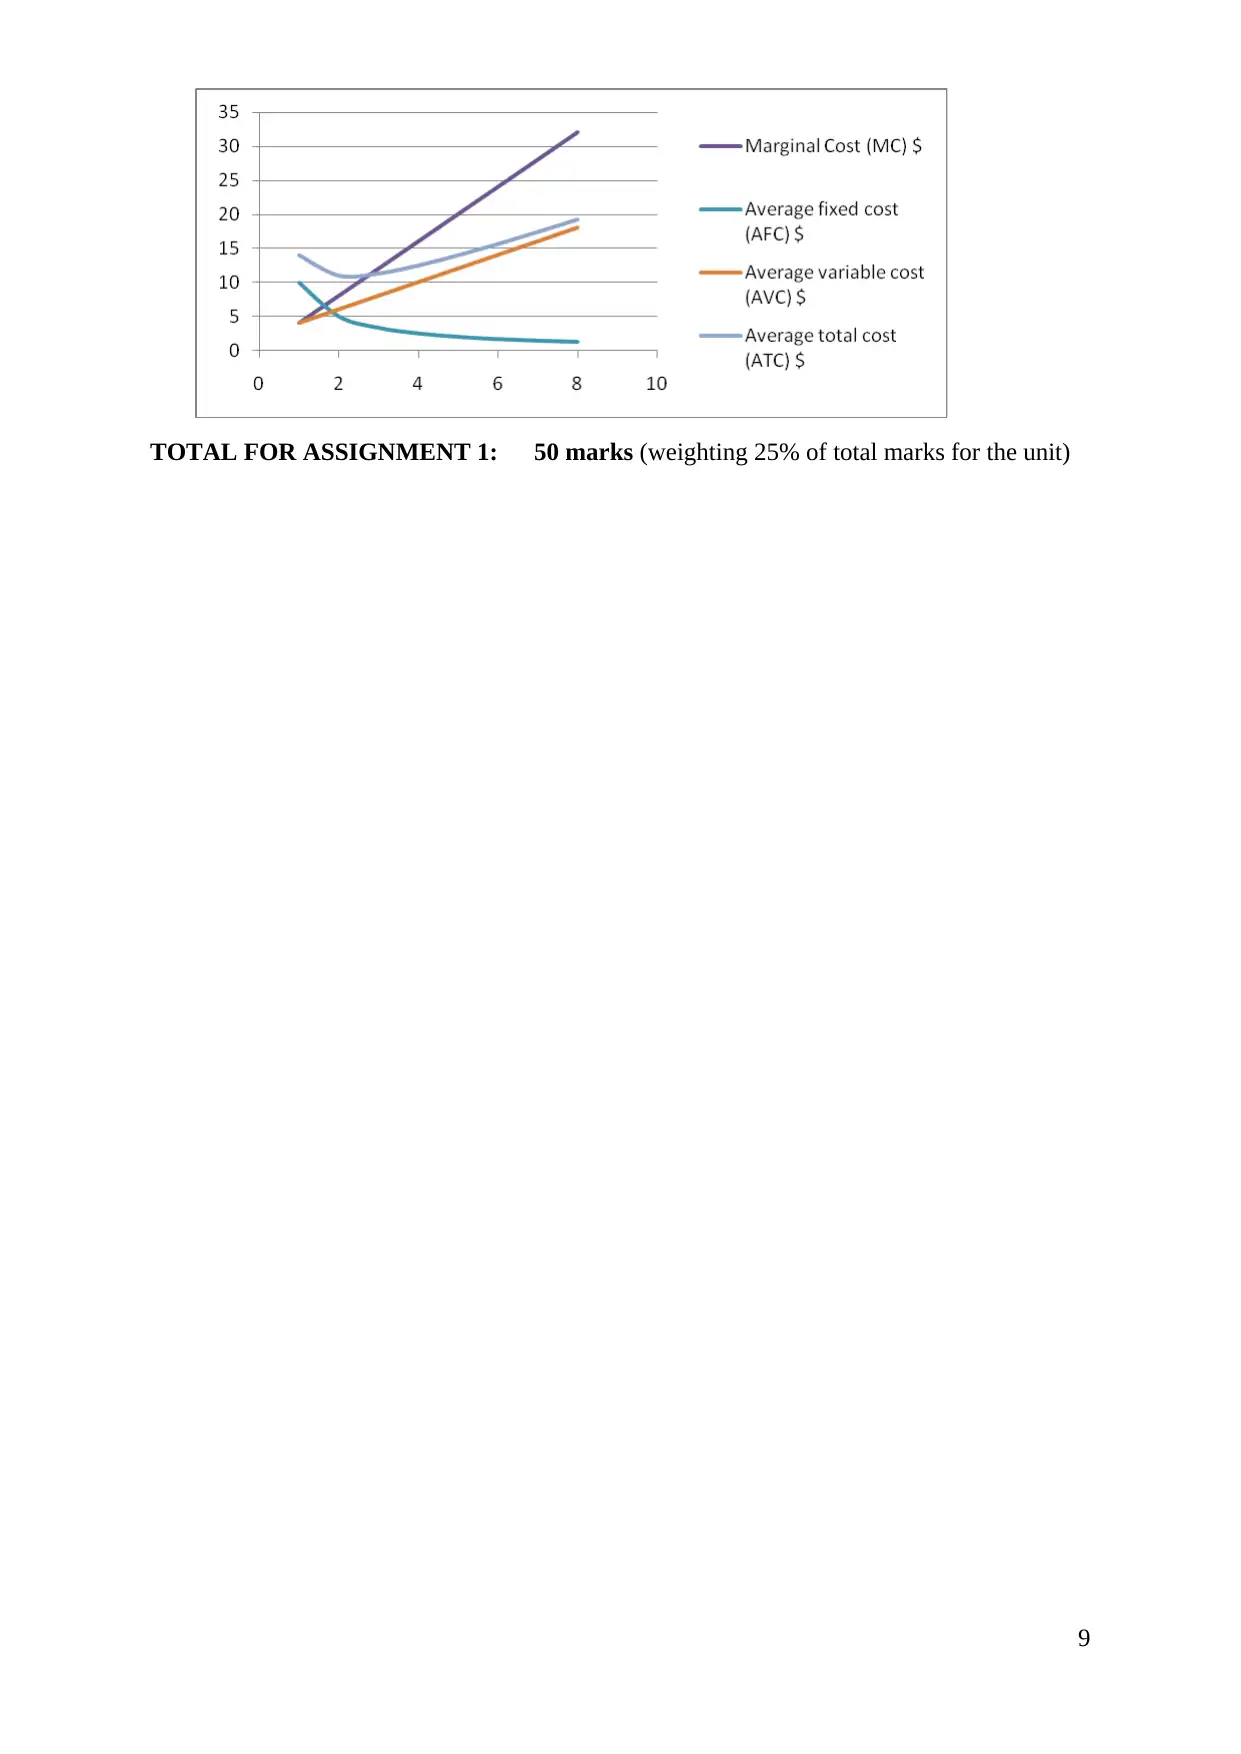
c. Graph the average variable cost, average total cost and marginal cost and marginal revenue
curves.
(4 marks)
8
a) Complete the cost schedule below for a gardening company:
Quantity
of
gardens
Total Fixed
Cost (TFC)
Total
Variable
Cost
(TVC)
Total
Cost (TC)
Marginal
Cost (MC)
Average
fixed cost
Average
variable cost
Average
total cost
$ (AFC) (AVC) (ATC)
$ $ $ $ $ $
0 10 10
1 10 4 14 4 10 4 14
2 10 12 22 8 5 6 11
3 10 24 34 12 3.3333 8 11.333
4 10 40 50 16 2.5 10 12.5
5 10 60 70 20 2 12 14
6 10 84 94 24 1.6667 14 15.667
7 10 112 122 28 1.428 16 17.428
8 10 144 154 32 1.25 18 19.25
(3 arks)
b. If the firm is operating in a perfect market where the price for gardening at one houseis $20
dollars, how many gardens should this companydo in order to maximise profit? Explain your
answer.
The logic used is MR= MC
As price is fixed the P= MR = 20
MC is shown in table.
At Q = 5 MR=MC = 20
This is equilibrium output level where profits are maximum .
Profits = TR-TC = 20*5 – 70 = 30
(3 marks)
c. Graph the average variable cost, average total cost and marginal cost and marginal revenue
curves.
(4 marks)
8
TOTAL FOR ASSIGNMENT 1: 50 marks (weighting 25% of total marks for the unit)
9
9
⊘ This is a preview!⊘
Do you want full access?
Subscribe today to unlock all pages.
Trusted by 1+ million students worldwide
Bibliography
Courseera.org, n.d. MR=MC rule. [Online] Available at: HYPERLINK
"https://www.coursera.org/learn/principles-of-microeconomics/lecture/zKD8R/pricing-and-
production-rules-p-mr-mc-the-shutdown-rule" https://www.coursera.org/learn/principles-of-
microeconomics/lecture/zKD8R/pricing-and-production-rules-p-mr-mc-the-shutdown-rule
[Accessed 2 August 2017].
CSun.edu, n.d. Microeconomics. [Online] Available at: HYPERLINK
"http://www.csun.edu/sites/default/files/micro3.pdf"
http://www.csun.edu/sites/default/files/micro3.pdf [Accessed 2 June 2017].
Econ.ohio-state.edu, n.d. Elasticity. [Online] Available at: HYPERLINK
"http://www.econ.ohio-state.edu/jpeck/H200/EconH200L5.pdf" http://www.econ.ohio-
state.edu/jpeck/H200/EconH200L5.pdf [Accessed 30 May 2017].
Econport.org, n.d. Impact of Shifts in demand and supply. [Online] Available at:
HYPERLINK "http://www.econport.org/content/handbook/Equilibrium/Impact-.html"
http://www.econport.org/content/handbook/Equilibrium/Impact-.html [Accessed 3 June
2017].
Gallo, A., n.d. A refresher on price elasticity. [Online] Available at: HYPERLINK
"https://hbr.org/2015/08/a-refresher-on-price-elasticity" https://hbr.org/2015/08/a-refresher-
on-price-elasticity [Accessed 15 August 2017].
Home.fau.edu, n.d. Indian Economy since Independence. [Online] Available at:
HYPERLINK "http://home.fau.edu/sghosh/web/images/India%20talk.pdf"
http://home.fau.edu/sghosh/web/images/India%20talk.pdf [Accessed 15 Aug 2017].
Jadhav, N., n.d. Industrial Policy since 1956. [Online] Available at: HYPERLINK
"http://www.drnarendrajadhav.info/drjadhav-data_files/Published%20papers/Indian
%20Industrial%20Policy%20Since%201956.pdf"
http://www.drnarendrajadhav.info/drjadhav-data_files/Published%20papers/Indian
%20Industrial%20Policy%20Since%201956.pdf [Accessed 15 Aug 2017].
Rittenburg, L. & Tregarthen, T., n.d. Principles of Economics V 1.0. [Online] Available at:
HYPERLINK "https://catalog.flatworldknowledge.com/bookhub/22?e=rittenecon-ch02_s03"
https://catalog.flatworldknowledge.com/bookhub/22?e=rittenecon-ch02_s03 [Accessed 14
August 2017].
10
1 out of 10
Related Documents


Your All-in-One AI-Powered Toolkit for Academic Success.
+13062052269
info@desklib.com
Available 24*7 on WhatsApp / Email
![[object Object]](/_next/static/media/star-bottom.7253800d.svg)
Unlock your academic potential
Copyright © 2020–2026 A2Z Services. All Rights Reserved. Developed and managed by ZUCOL.