Economics Assignment Solution: Statistical Analysis of Economic Data

Verified

Added on  2020/04/21

|6
|481
|268
Homework Assignment
AI Summary
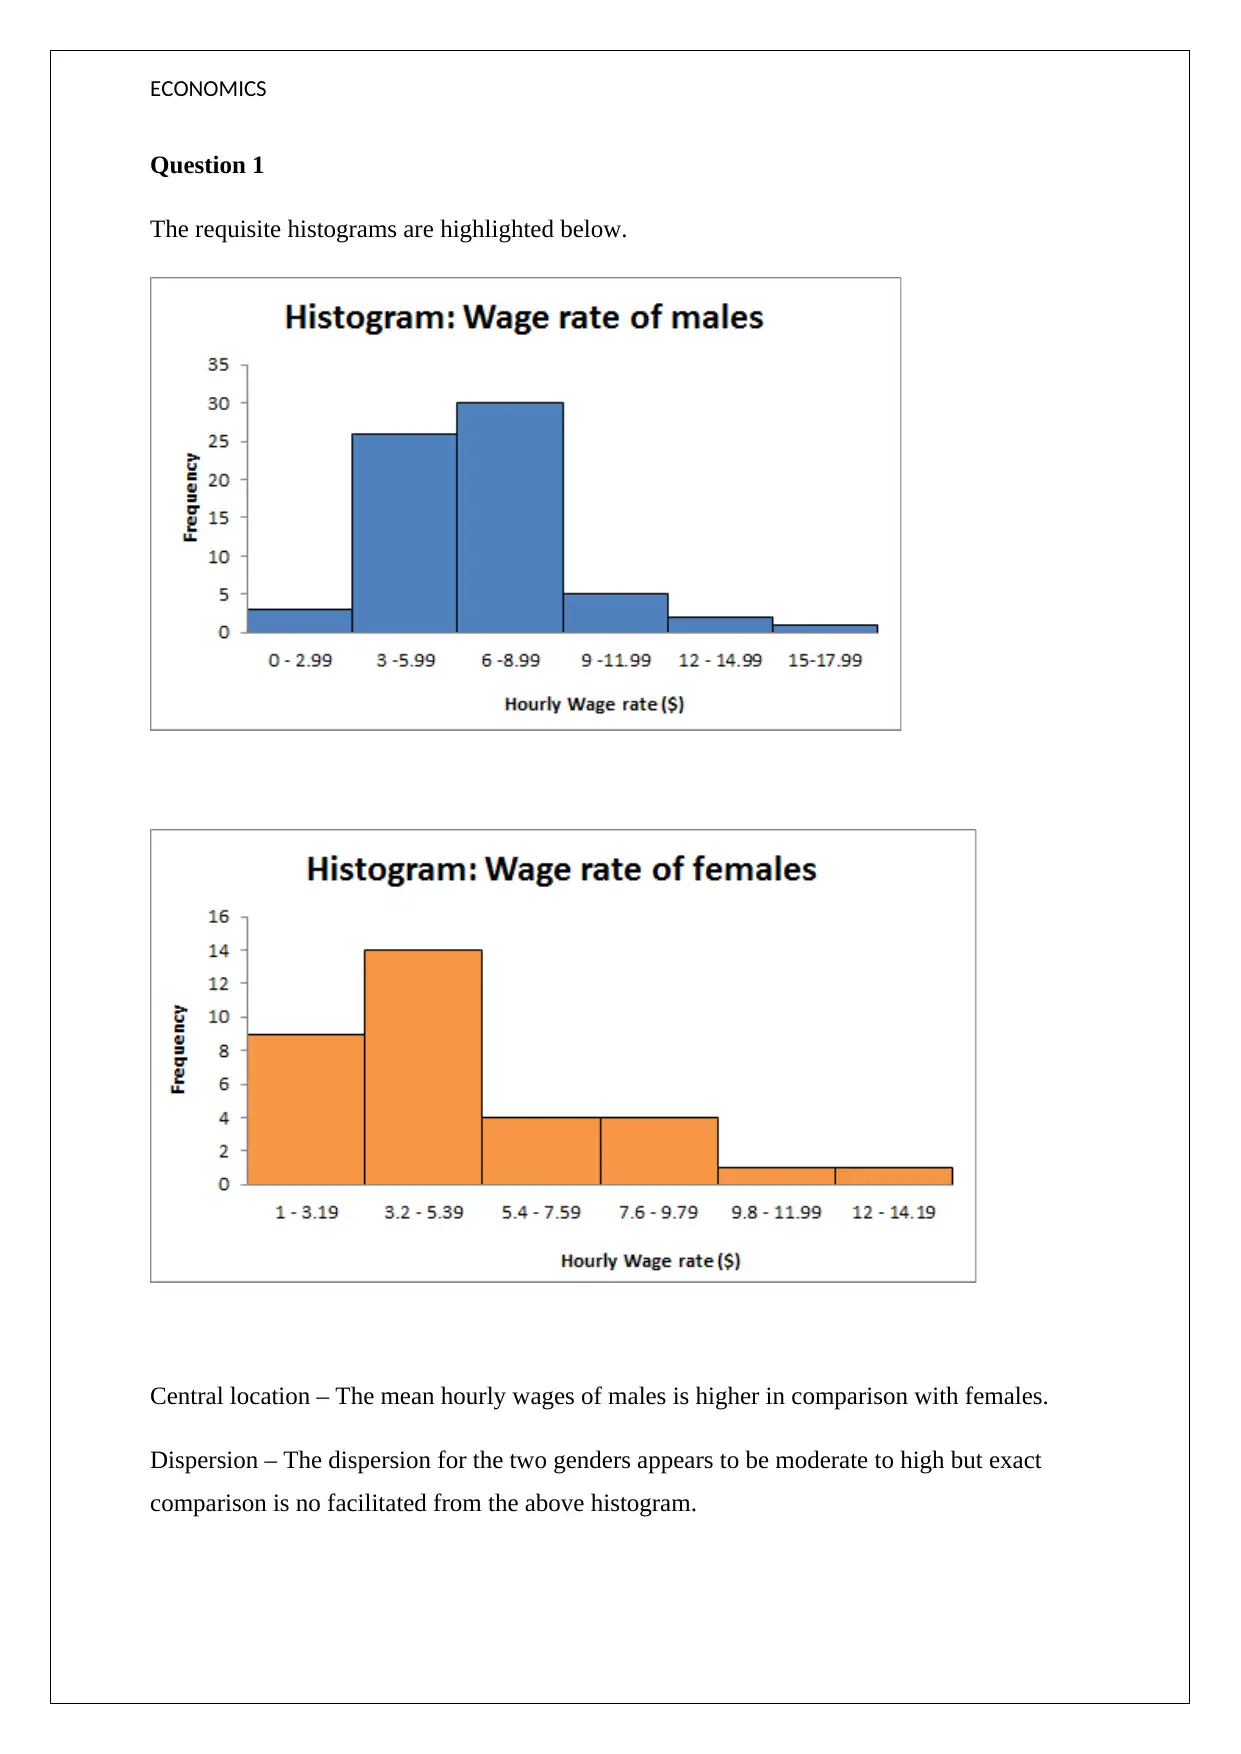
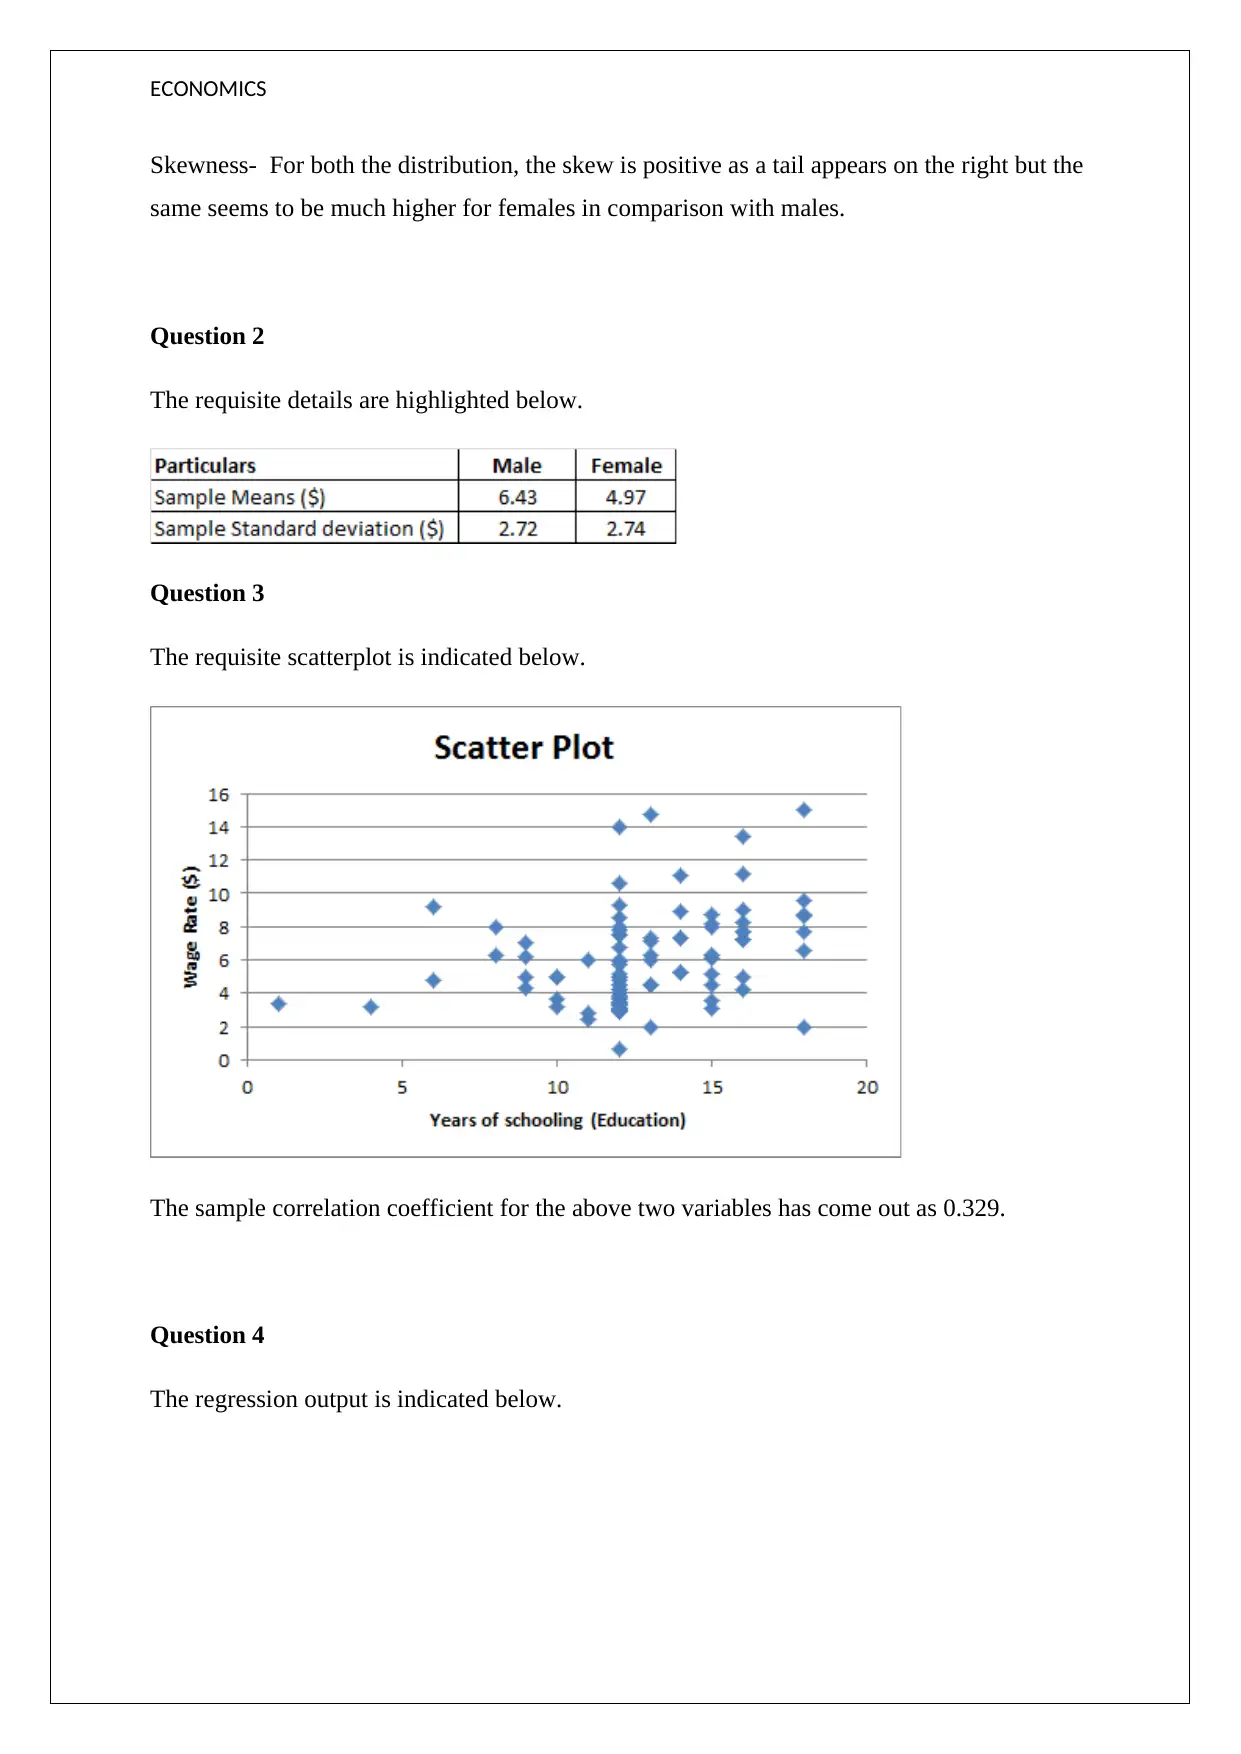
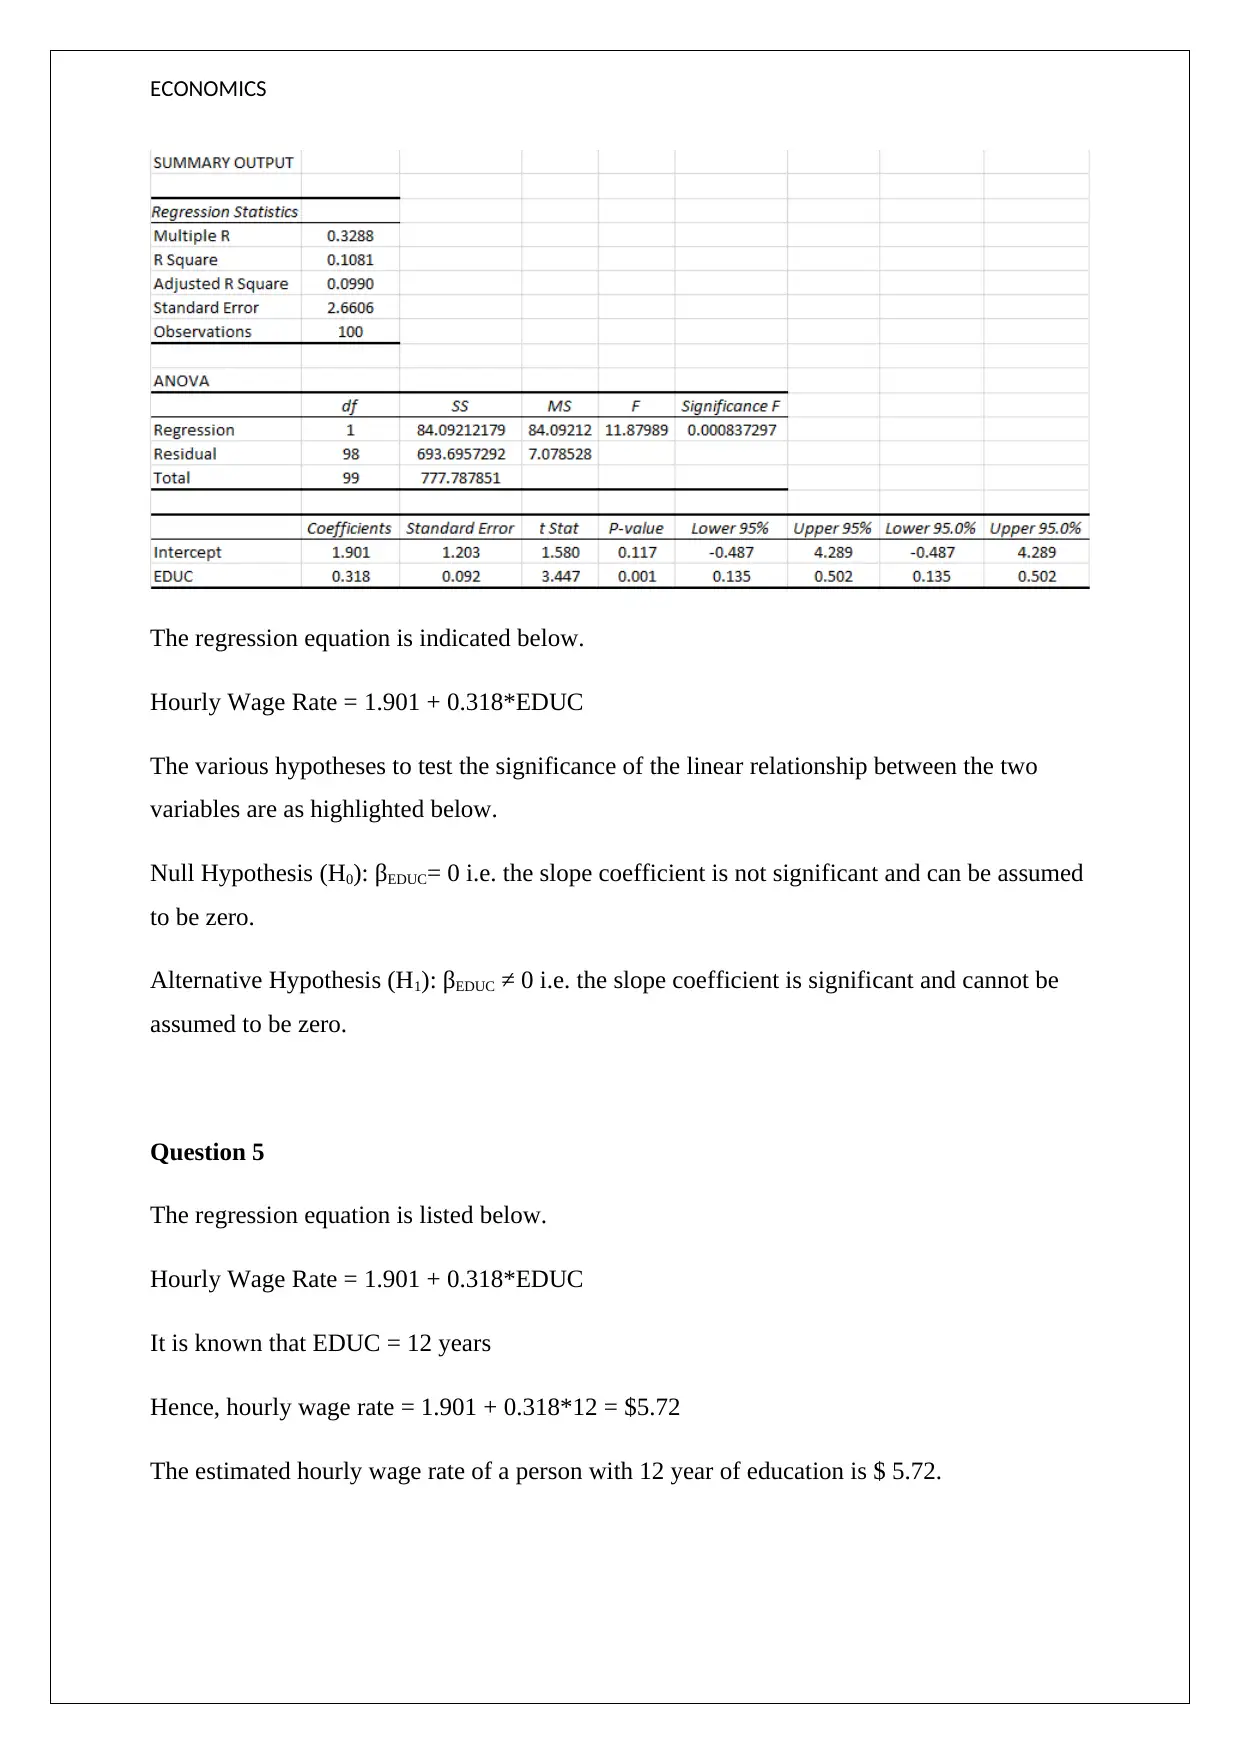
This economics assignment solution delves into various aspects of statistical analysis within the field of economics. The solution begins by examining the distribution of hourly wages, comparing males and females through histograms and discussing central location, dispersion, and skewness. It then explores the relationship between education and hourly wages using regression analysis, calculating the correlation coefficient and developing a regression equation. The solution tests the significance of the linear relationship between education and wages, formulating null and alternative hypotheses, and interpreting t-statistics and p-values. The document also calculates estimated wage rates based on education levels. Furthermore, it conducts hypothesis testing to compare wage rates between genders using t-tests and ANOVA, providing conclusions based on the significance levels. The assignment covers a range of statistical techniques and their application to economic data, offering a comprehensive analysis of the variables involved.
Document Page
ECONOMICS
STUDENT ID:
[Pick the date]
tabler-icon-diamond-filled.svg

Paraphrase This Document

Need a fresh take? Get an instant paraphrase of this document with our AI Paraphraser
Document Page
ECONOMICS
Question 1
The requisite histograms are highlighted below.
Central location – The mean hourly wages of males is higher in comparison with females.
Dispersion – The dispersion for the two genders appears to be moderate to high but exact
comparison is no facilitated from the above histogram.
Document Page
ECONOMICS
Skewness- For both the distribution, the skew is positive as a tail appears on the right but the
same seems to be much higher for females in comparison with males.
Question 2
The requisite details are highlighted below.
Question 3
The requisite scatterplot is indicated below.
The sample correlation coefficient for the above two variables has come out as 0.329.
Question 4
The regression output is indicated below.
Document Page
ECONOMICS
The regression equation is indicated below.
Hourly Wage Rate = 1.901 + 0.318*EDUC
The various hypotheses to test the significance of the linear relationship between the two
variables are as highlighted below.
Null Hypothesis (H0): βEDUC= 0 i.e. the slope coefficient is not significant and can be assumed
to be zero.
Alternative Hypothesis (H1): βEDUC ≠ 0 i.e. the slope coefficient is significant and cannot be
assumed to be zero.
Question 5
The regression equation is listed below.
Hourly Wage Rate = 1.901 + 0.318*EDUC
It is known that EDUC = 12 years
Hence, hourly wage rate = 1.901 + 0.318*12 = $5.72
The estimated hourly wage rate of a person with 12 year of education is $ 5.72.
tabler-icon-diamond-filled.svg

Paraphrase This Document

Need a fresh take? Get an instant paraphrase of this document with our AI Paraphraser
Document Page
ECONOMICS
Question 6
The relevant output for hypothesis testing is indicated below.
It is apparent that the slope coefficient of EDUC has a t statistic of 3.447 and a corresponding
p value of 0.001. Hence, assuming a significance level of 5%, it would be fair to conclude
that the null hypothesis would be rejected and alternative hypothesis would be accepted.
Hence, the linear relationship between the education level and hourly wages is significant.
The same can be also concluded through the ANOVA output indicated below.
Question 7
Null hypothesis H0 μmale=μfemale It indicates that the wage rate for man and women are same.
Alternative hypothesis H1 :μmale μfemaleIt indicates that the wage rate for man and women are
not same.
Question 10
It can be seen that t test with equal variance would be used in the present case.
Document Page
ECONOMICS
The corresponding p value for two tailed comes out to be 0.0134.
Assuming 5 % of level of significance, it can be seen that p value is lower than level of
significance and therefore, sufficient evidence present to reject null hypothesis and to accept
alternative hypothesis. Hence, the conclusion can be made that the wage rate for man and
women are not same.
chevron_up_icon
1 out of 6
circle_padding
hide_on_mobile
zoom_out_icon
[object Object]