University Economics: Principles Assignment Solution
VerifiedAdded on 2021/05/31
|8
|1471
|23
Homework Assignment
AI Summary
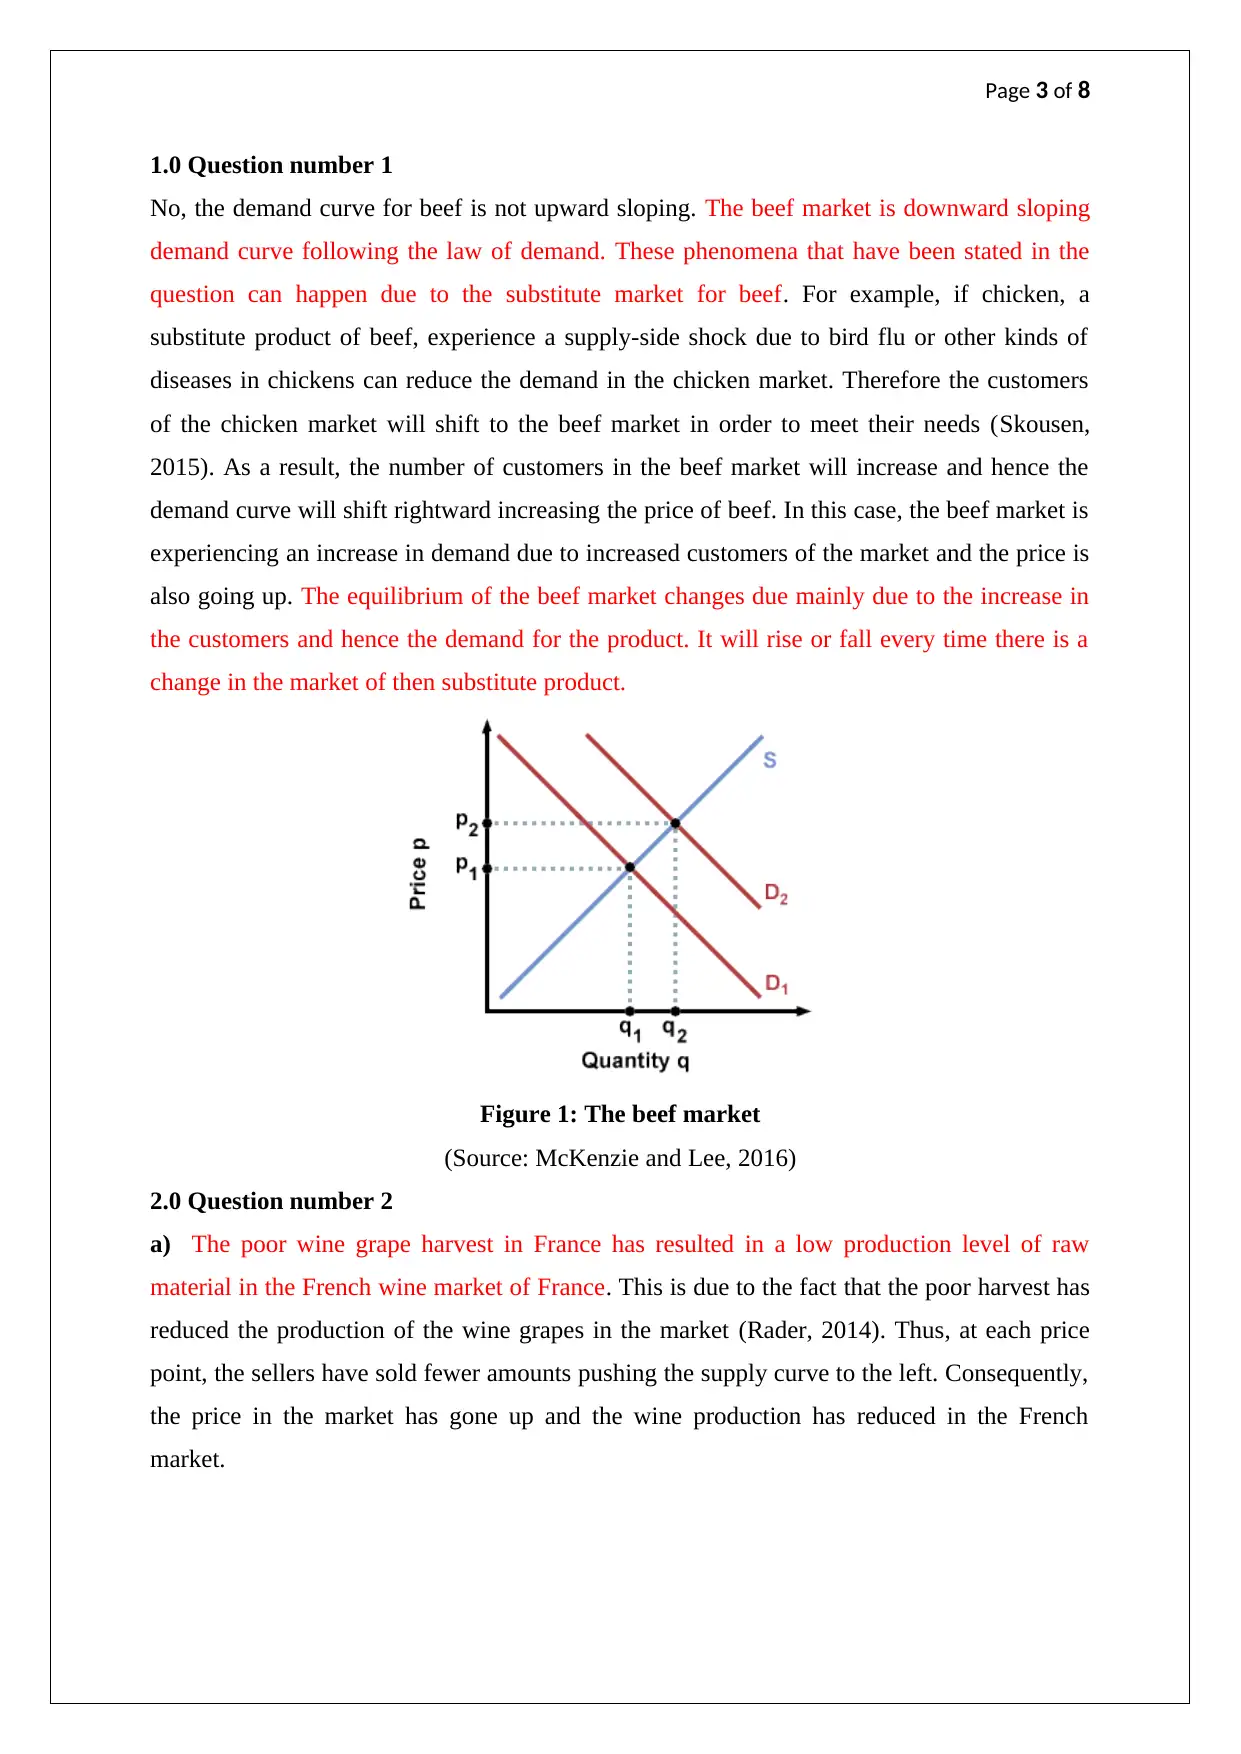
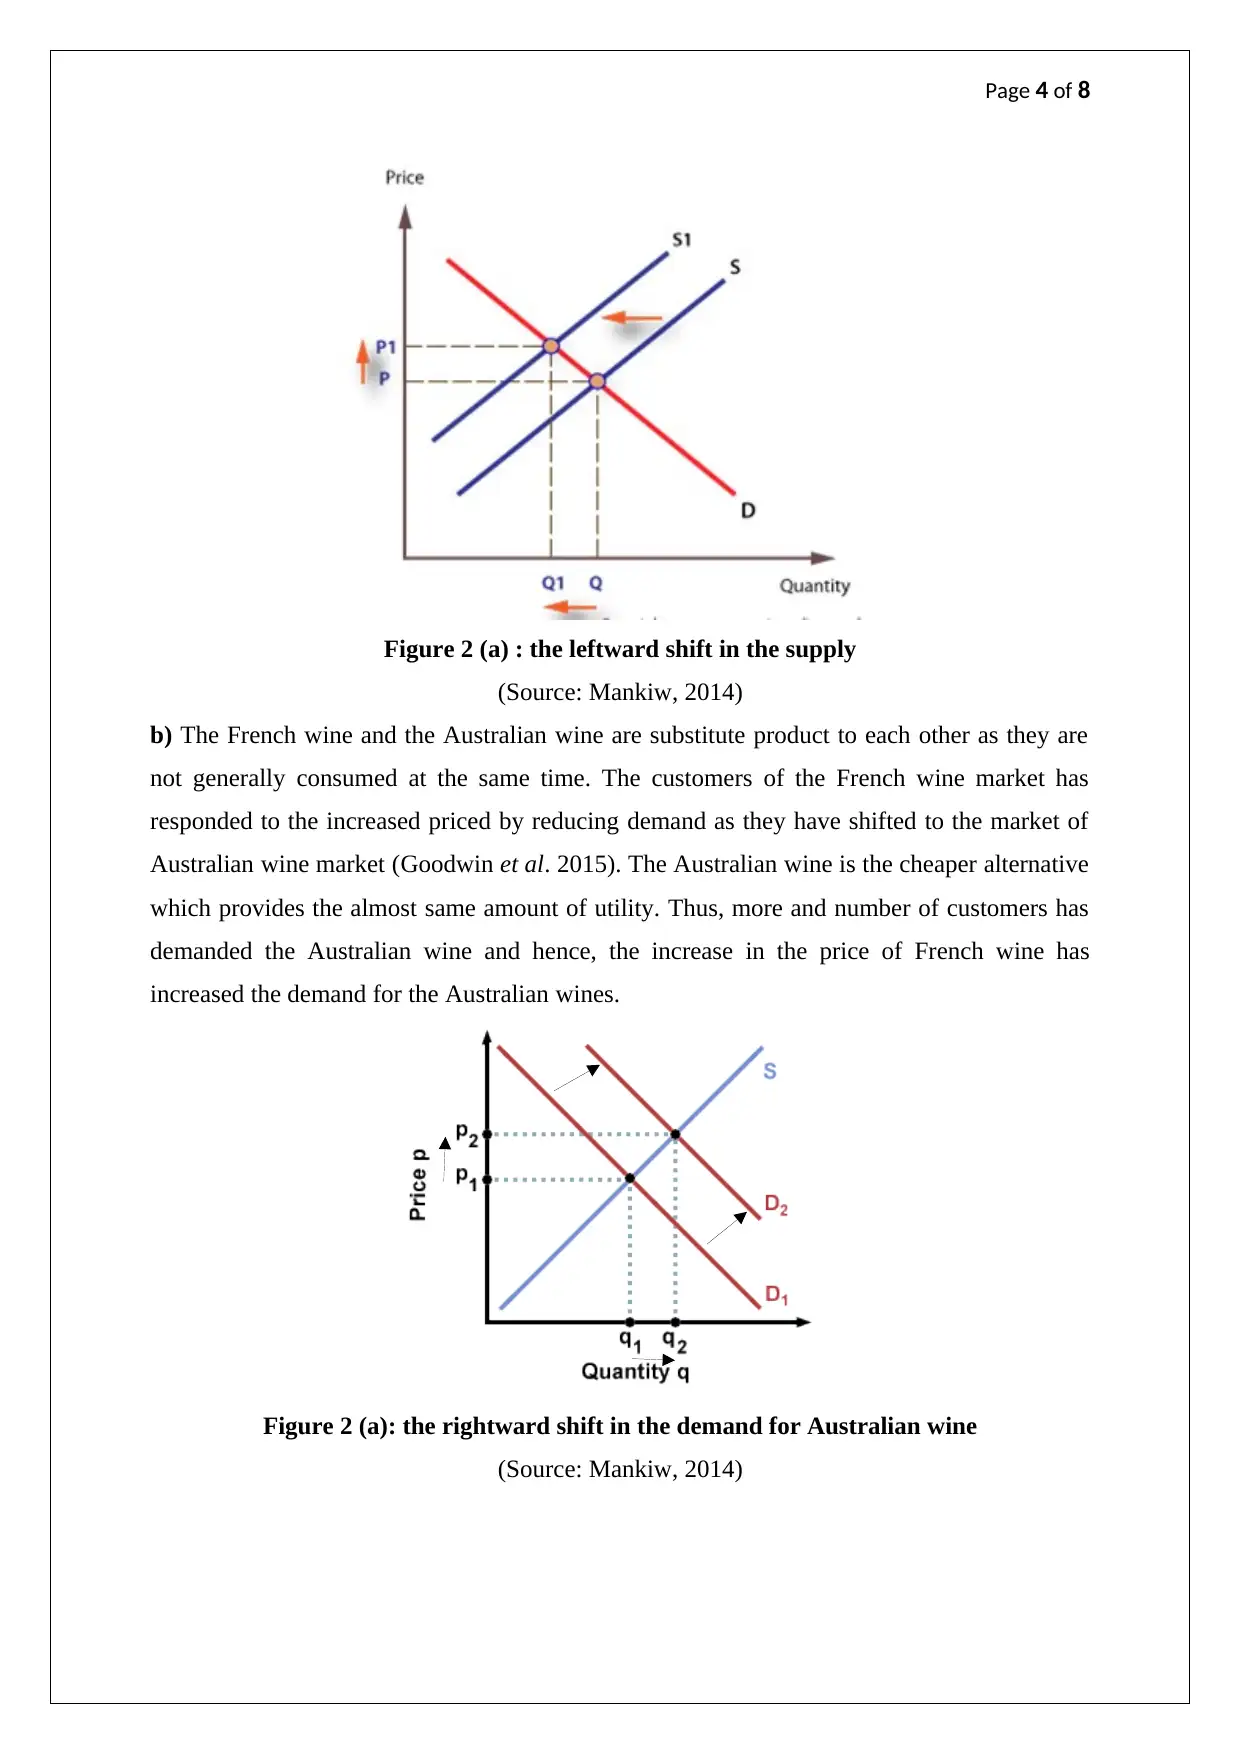
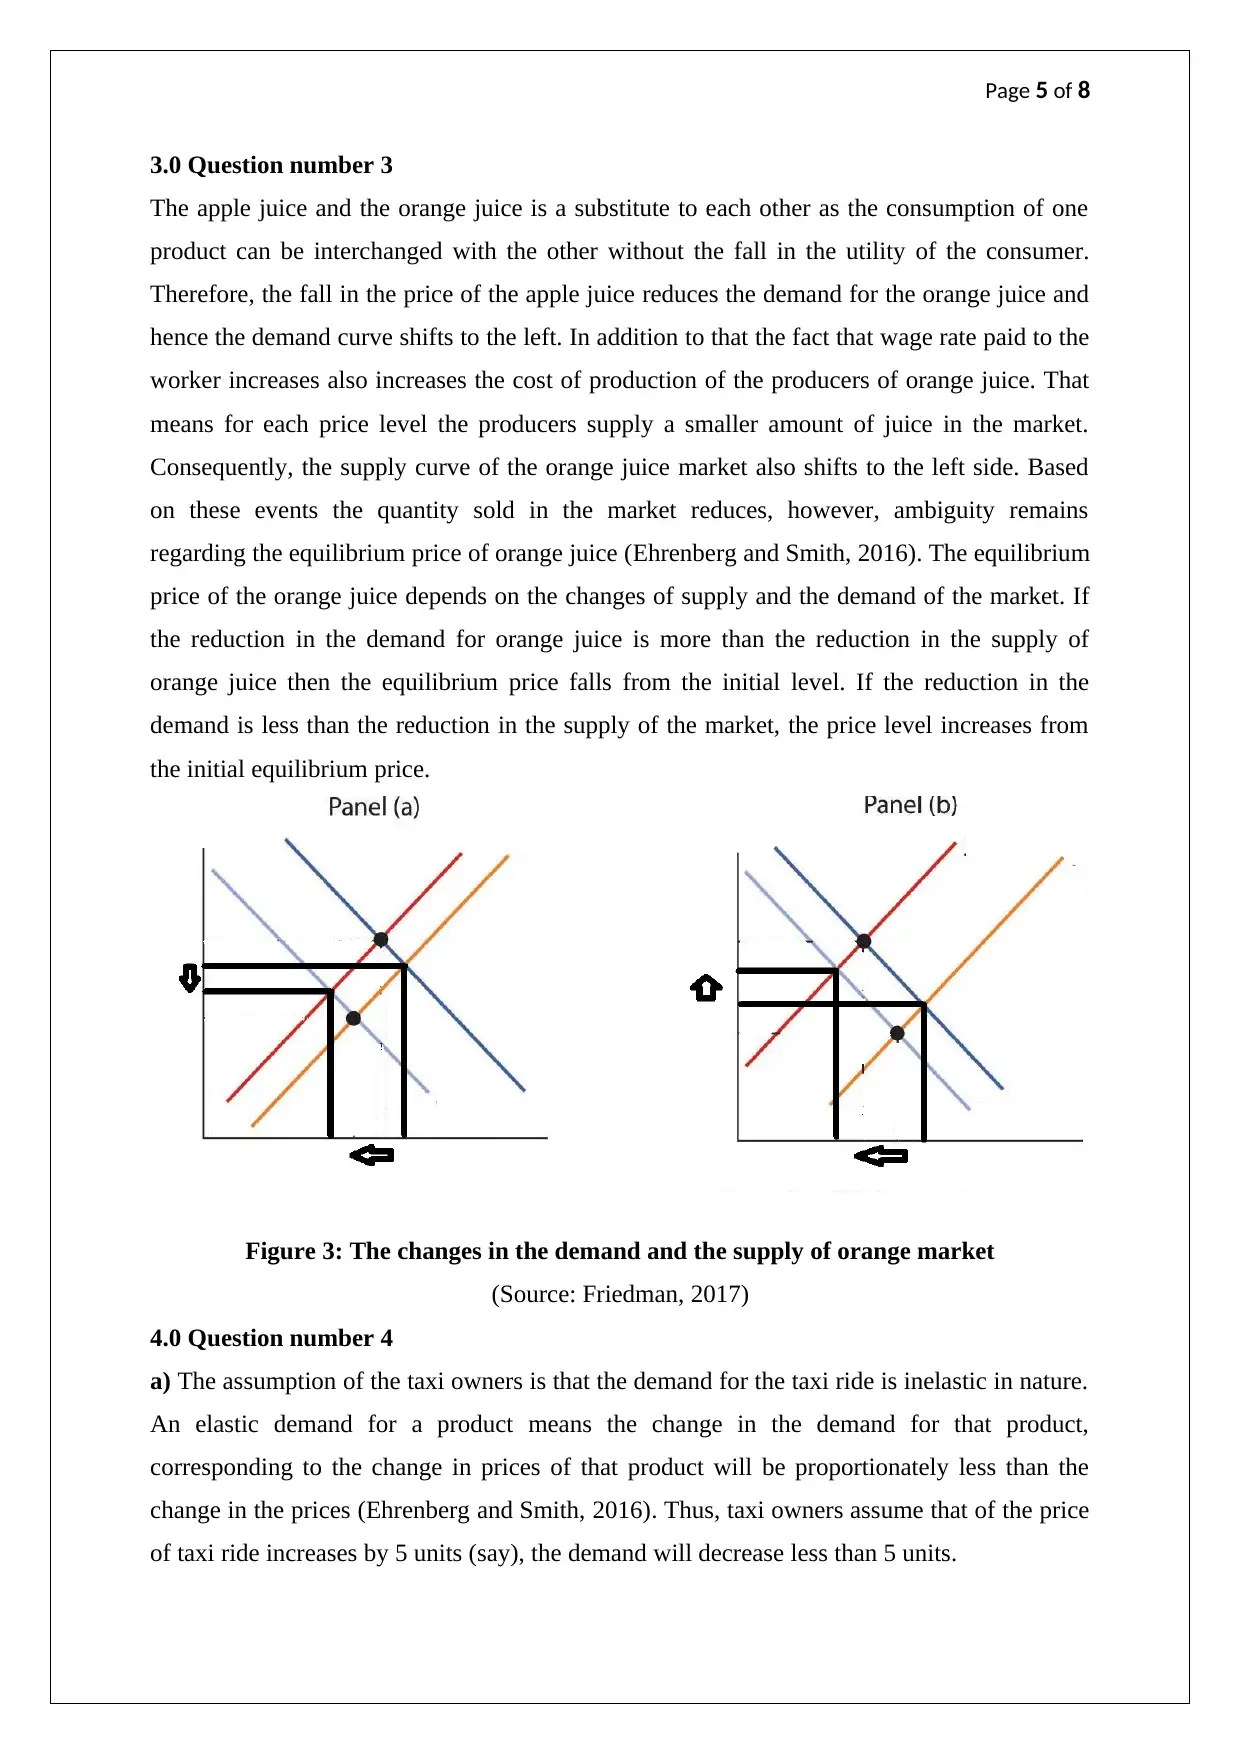
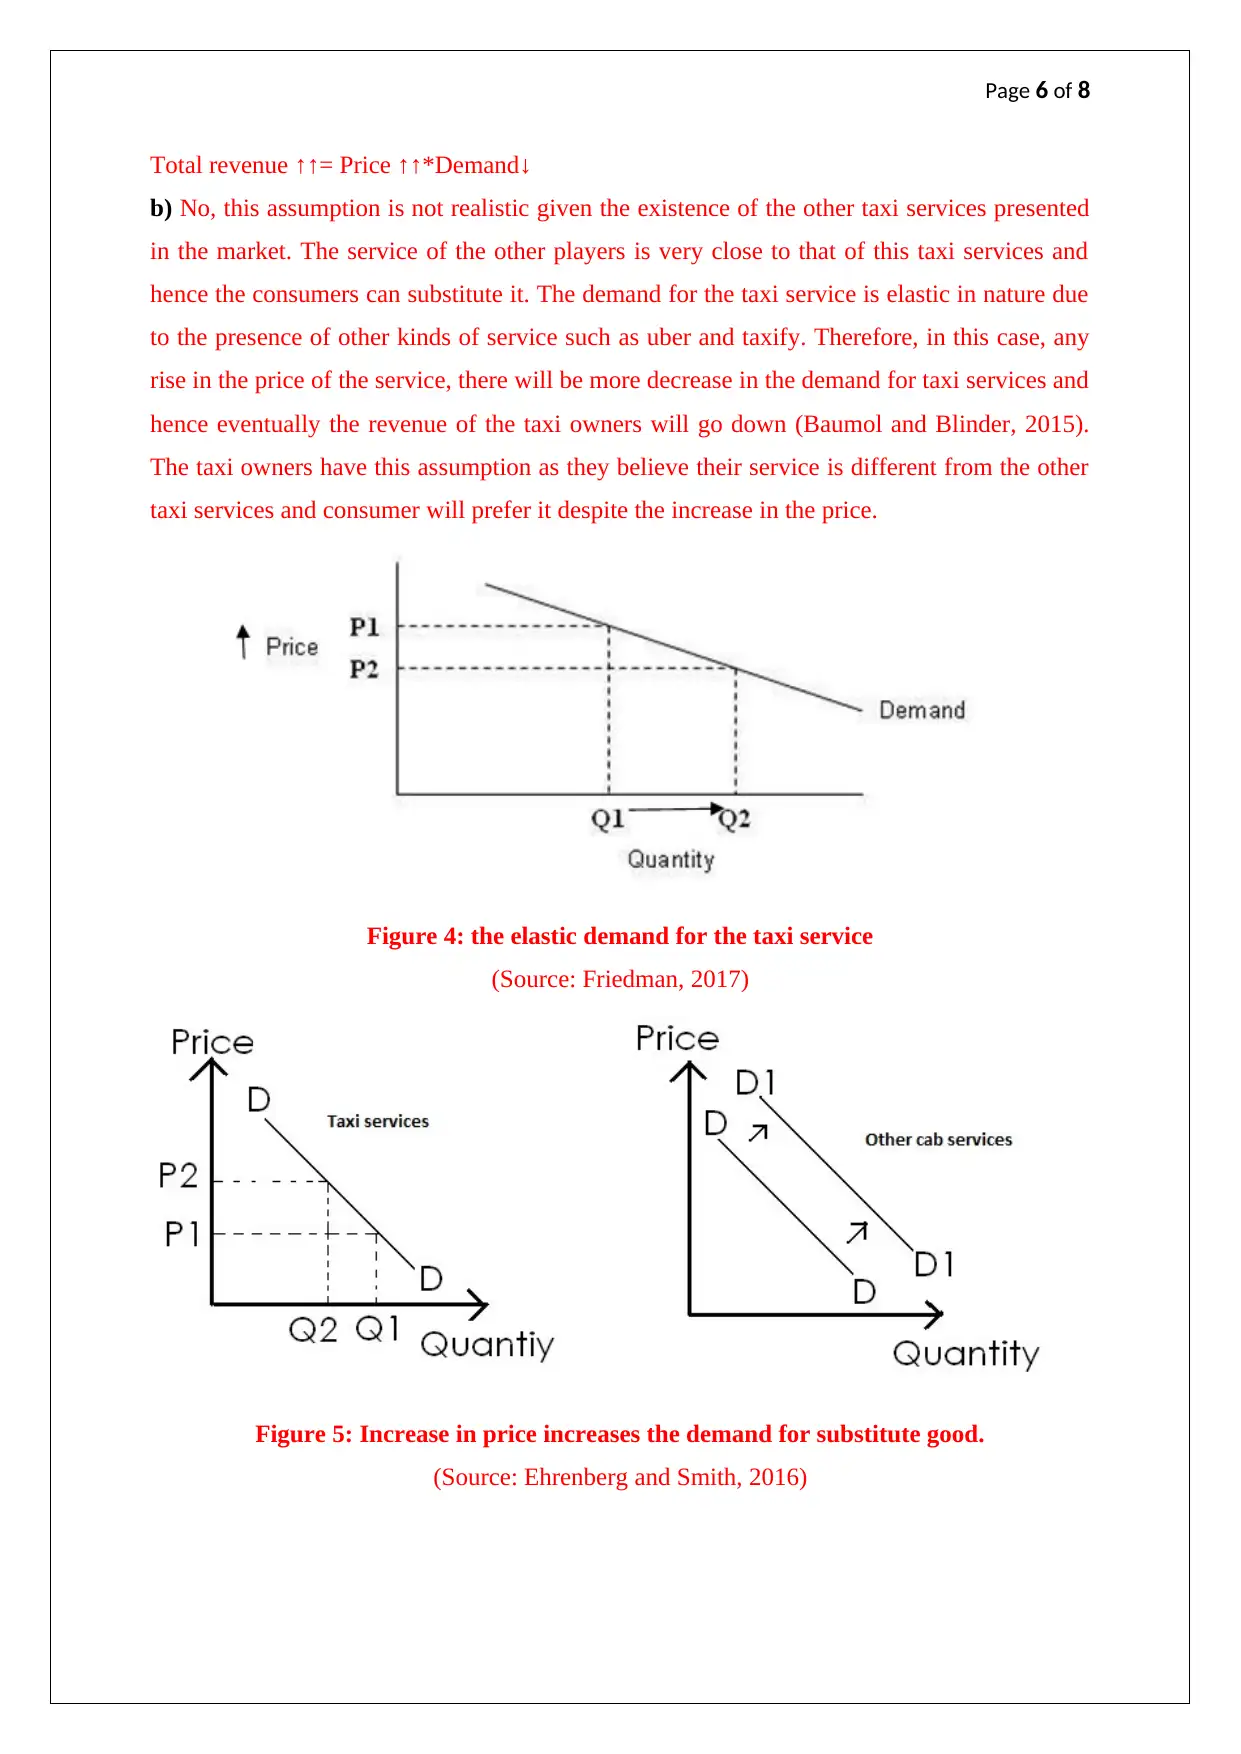
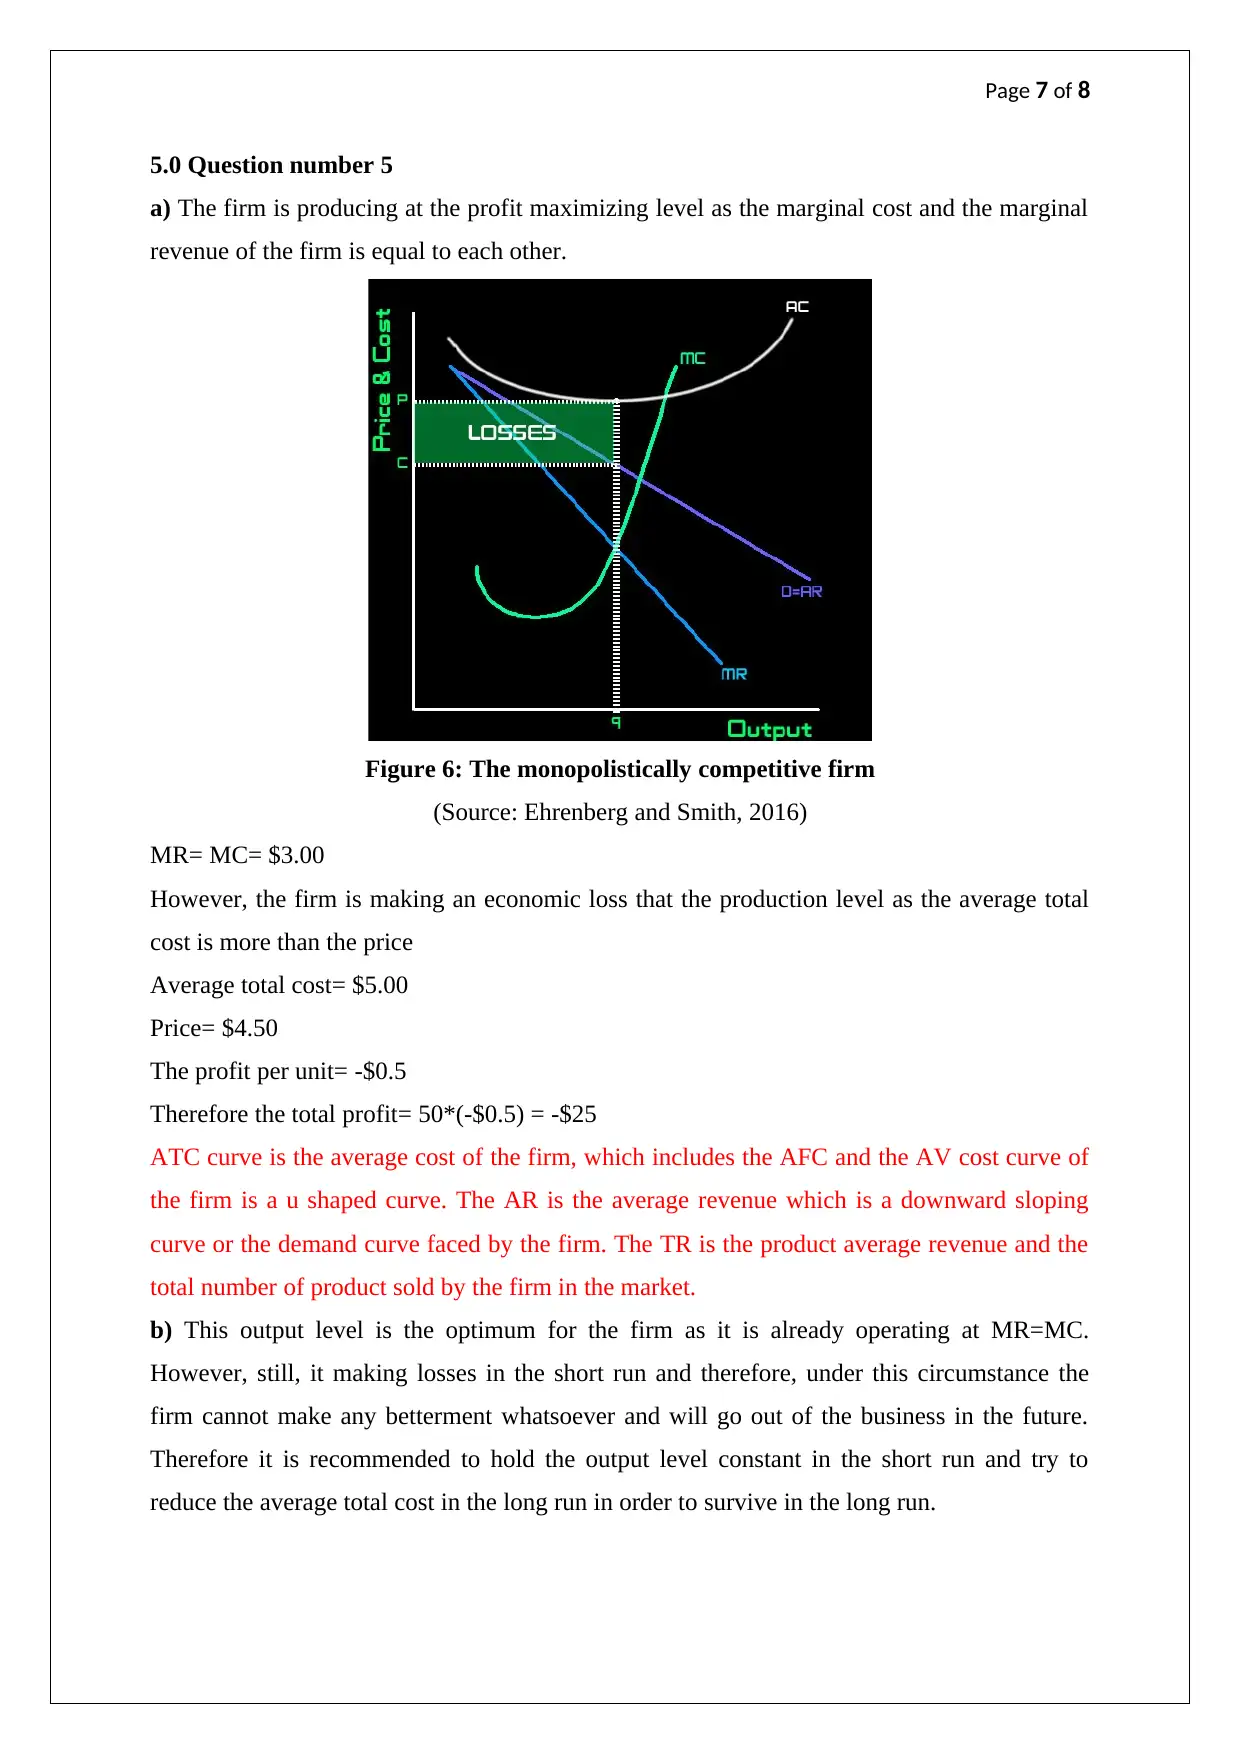
This economics assignment solution addresses key microeconomic principles through the analysis of five questions. The first question examines the demand curve for beef, considering the impact of substitute goods like chicken. The second question explores the effects of a poor wine grape harvest in France on supply and the subsequent impact on the Australian wine market, which is a substitute product. Question three delves into the interplay between apple and orange juice as substitutes, analyzing how changes in price and production costs affect market equilibrium. Question four assesses the validity of taxi owners' assumptions about the elasticity of demand for their services, considering the presence of competitors like Uber and Taxify. Finally, question five analyzes a firm operating in a monopolistically competitive market, determining its profit-maximizing output level, economic losses, and recommendations for the short and long run. The solution incorporates relevant economic concepts and provides graphical representations to illustrate market dynamics.

Page 1 of 8
ECONOMIC PRINCIPLE
ECONOMIC PRINCIPLE
Paraphrase This Document
Need a fresh take? Get an instant paraphrase of this document with our AI Paraphraser

Page 2 of 8
Table of contents
1.0 Question number 1...............................................................................................................3
2.0 Question number 2...............................................................................................................3
3.0 Question number 3...............................................................................................................4
4.0 Question number 4...............................................................................................................5
5.0 Question number 5...............................................................................................................6
Reference....................................................................................................................................7

Page 3 of 8
1.0 Question number 1
No, the demand curve for beef is not upward sloping. The beef market is downward sloping
demand curve following the law of demand. These phenomena that have been stated in the
question can happen due to the substitute market for beef. For example, if chicken, a
substitute product of beef, experience a supply-side shock due to bird flu or other kinds of
diseases in chickens can reduce the demand in the chicken market. Therefore the customers
of the chicken market will shift to the beef market in order to meet their needs (Skousen,
2015). As a result, the number of customers in the beef market will increase and hence the
demand curve will shift rightward increasing the price of beef. In this case, the beef market is
experiencing an increase in demand due to increased customers of the market and the price is
also going up. The equilibrium of the beef market changes due mainly due to the increase in
the customers and hence the demand for the product. It will rise or fall every time there is a
change in the market of then substitute product.
Figure 1: The beef market
(Source: McKenzie and Lee, 2016)
2.0 Question number 2
a) The poor wine grape harvest in France has resulted in a low production level of raw
material in the French wine market of France. This is due to the fact that the poor harvest has
reduced the production of the wine grapes in the market (Rader, 2014). Thus, at each price
point, the sellers have sold fewer amounts pushing the supply curve to the left. Consequently,
the price in the market has gone up and the wine production has reduced in the French
market.
⊘ This is a preview!⊘
Do you want full access?
Subscribe today to unlock all pages.

Trusted by 1+ million students worldwide

Page 4 of 8
Figure 2 (a) : the leftward shift in the supply
(Source: Mankiw, 2014)
b) The French wine and the Australian wine are substitute product to each other as they are
not generally consumed at the same time. The customers of the French wine market has
responded to the increased priced by reducing demand as they have shifted to the market of
Australian wine market (Goodwin et al. 2015). The Australian wine is the cheaper alternative
which provides the almost same amount of utility. Thus, more and number of customers has
demanded the Australian wine and hence, the increase in the price of French wine has
increased the demand for the Australian wines.
Figure 2 (a): the rightward shift in the demand for Australian wine
(Source: Mankiw, 2014)
Paraphrase This Document
Need a fresh take? Get an instant paraphrase of this document with our AI Paraphraser

Page 5 of 8
3.0 Question number 3
The apple juice and the orange juice is a substitute to each other as the consumption of one
product can be interchanged with the other without the fall in the utility of the consumer.
Therefore, the fall in the price of the apple juice reduces the demand for the orange juice and
hence the demand curve shifts to the left. In addition to that the fact that wage rate paid to the
worker increases also increases the cost of production of the producers of orange juice. That
means for each price level the producers supply a smaller amount of juice in the market.
Consequently, the supply curve of the orange juice market also shifts to the left side. Based
on these events the quantity sold in the market reduces, however, ambiguity remains
regarding the equilibrium price of orange juice (Ehrenberg and Smith, 2016). The equilibrium
price of the orange juice depends on the changes of supply and the demand of the market. If
the reduction in the demand for orange juice is more than the reduction in the supply of
orange juice then the equilibrium price falls from the initial level. If the reduction in the
demand is less than the reduction in the supply of the market, the price level increases from
the initial equilibrium price.
Figure 3: The changes in the demand and the supply of orange market
(Source: Friedman, 2017)
4.0 Question number 4
a) The assumption of the taxi owners is that the demand for the taxi ride is inelastic in nature.
An elastic demand for a product means the change in the demand for that product,
corresponding to the change in prices of that product will be proportionately less than the
change in the prices (Ehrenberg and Smith, 2016). Thus, taxi owners assume that of the price
of taxi ride increases by 5 units (say), the demand will decrease less than 5 units.

Page 6 of 8
Total revenue ↑↑= Price ↑↑*Demand↓
b) No, this assumption is not realistic given the existence of the other taxi services presented
in the market. The service of the other players is very close to that of this taxi services and
hence the consumers can substitute it. The demand for the taxi service is elastic in nature due
to the presence of other kinds of service such as uber and taxify. Therefore, in this case, any
rise in the price of the service, there will be more decrease in the demand for taxi services and
hence eventually the revenue of the taxi owners will go down (Baumol and Blinder, 2015).
The taxi owners have this assumption as they believe their service is different from the other
taxi services and consumer will prefer it despite the increase in the price.
Figure 4: the elastic demand for the taxi service
(Source: Friedman, 2017)
Figure 5: Increase in price increases the demand for substitute good.
(Source: Ehrenberg and Smith, 2016)
⊘ This is a preview!⊘
Do you want full access?
Subscribe today to unlock all pages.

Trusted by 1+ million students worldwide

Page 7 of 8
5.0 Question number 5
a) The firm is producing at the profit maximizing level as the marginal cost and the marginal
revenue of the firm is equal to each other.
Figure 6: The monopolistically competitive firm
(Source: Ehrenberg and Smith, 2016)
MR= MC= $3.00
However, the firm is making an economic loss that the production level as the average total
cost is more than the price
Average total cost= $5.00
Price= $4.50
The profit per unit= -$0.5
Therefore the total profit= 50*(-$0.5) = -$25
ATC curve is the average cost of the firm, which includes the AFC and the AV cost curve of
the firm is a u shaped curve. The AR is the average revenue which is a downward sloping
curve or the demand curve faced by the firm. The TR is the product average revenue and the
total number of product sold by the firm in the market.
b) This output level is the optimum for the firm as it is already operating at MR=MC.
However, still, it making losses in the short run and therefore, under this circumstance the
firm cannot make any betterment whatsoever and will go out of the business in the future.
Therefore it is recommended to hold the output level constant in the short run and try to
reduce the average total cost in the long run in order to survive in the long run.
Paraphrase This Document
Need a fresh take? Get an instant paraphrase of this document with our AI Paraphraser

Page 8 of 8
Reference
Baumol, W.J. and Blinder, A.S., 2015. Microeconomics: Principles and policy. Cengage
Learning.
Ehrenberg, R.G. and Smith, R.S., 2016. Modern labor economics: Theory and public policy.
Routledge.
Friedman, M., 2017. Price theory. Routledge.
Goodwin, N., Harris, J.M., Nelson, J.A., Roach, B. and Torras, M., 2015. Principles of
economics in context. Routledge.
Mankiw, N.G., 2014. Principles of macroeconomics. Cengage Learning.
McKenzie, R.B. and Lee, D.R., 2016. Microeconomics for MBAs. Cambridge University
Press.
Rader, T., 2014. Theory of microeconomics. Academic Press.
Skousen, M., 2015. The making of modern economics: The lives and ideas of great thinkers.
Routledge.
1 out of 8
Related Documents

Your All-in-One AI-Powered Toolkit for Academic Success.
+13062052269
info@desklib.com
Available 24*7 on WhatsApp / Email
Unlock your academic potential
Copyright © 2020–2025 A2Z Services. All Rights Reserved. Developed and managed by ZUCOL.


