BEO1105 - Concepts of Economics and Market Analysis Assignment
VerifiedAdded on 2022/11/14
|11
|1645
|436
Homework Assignment
AI Summary
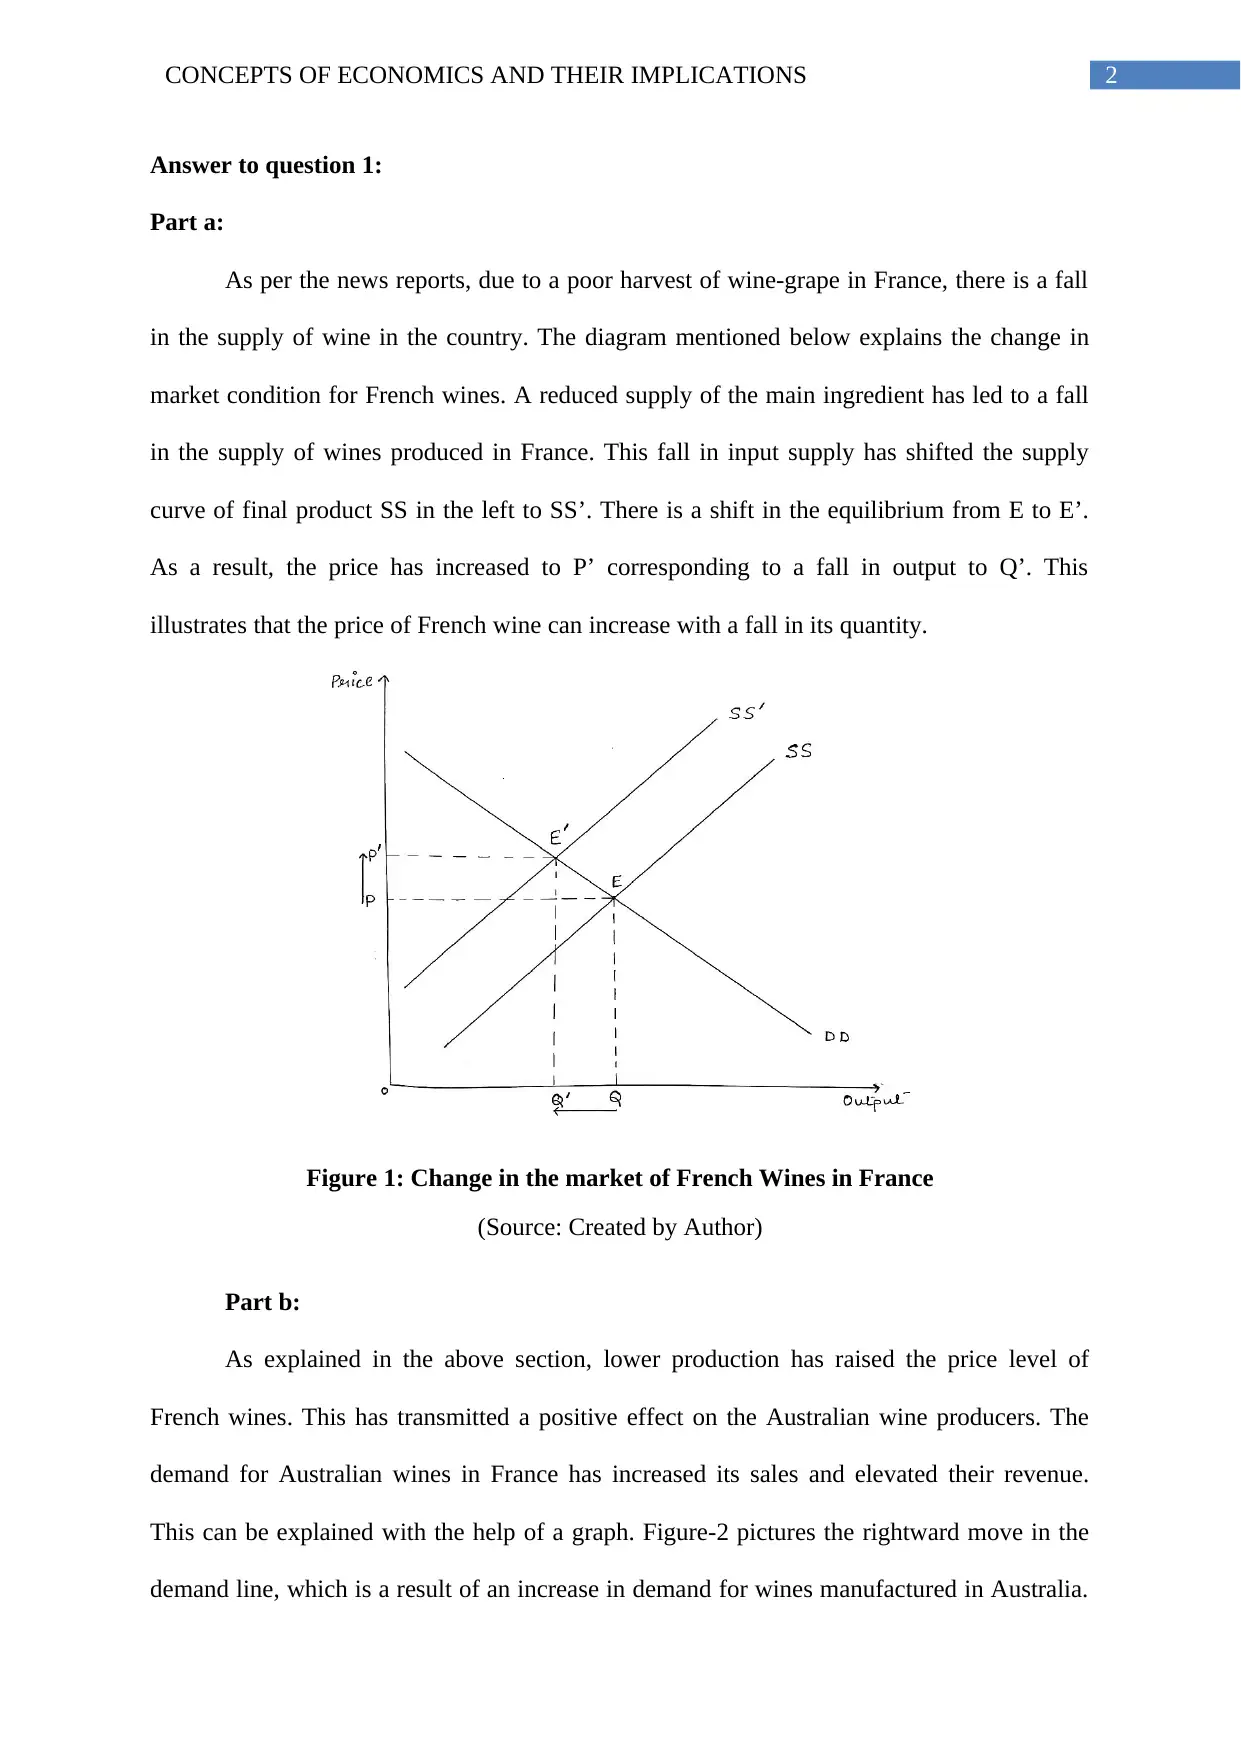
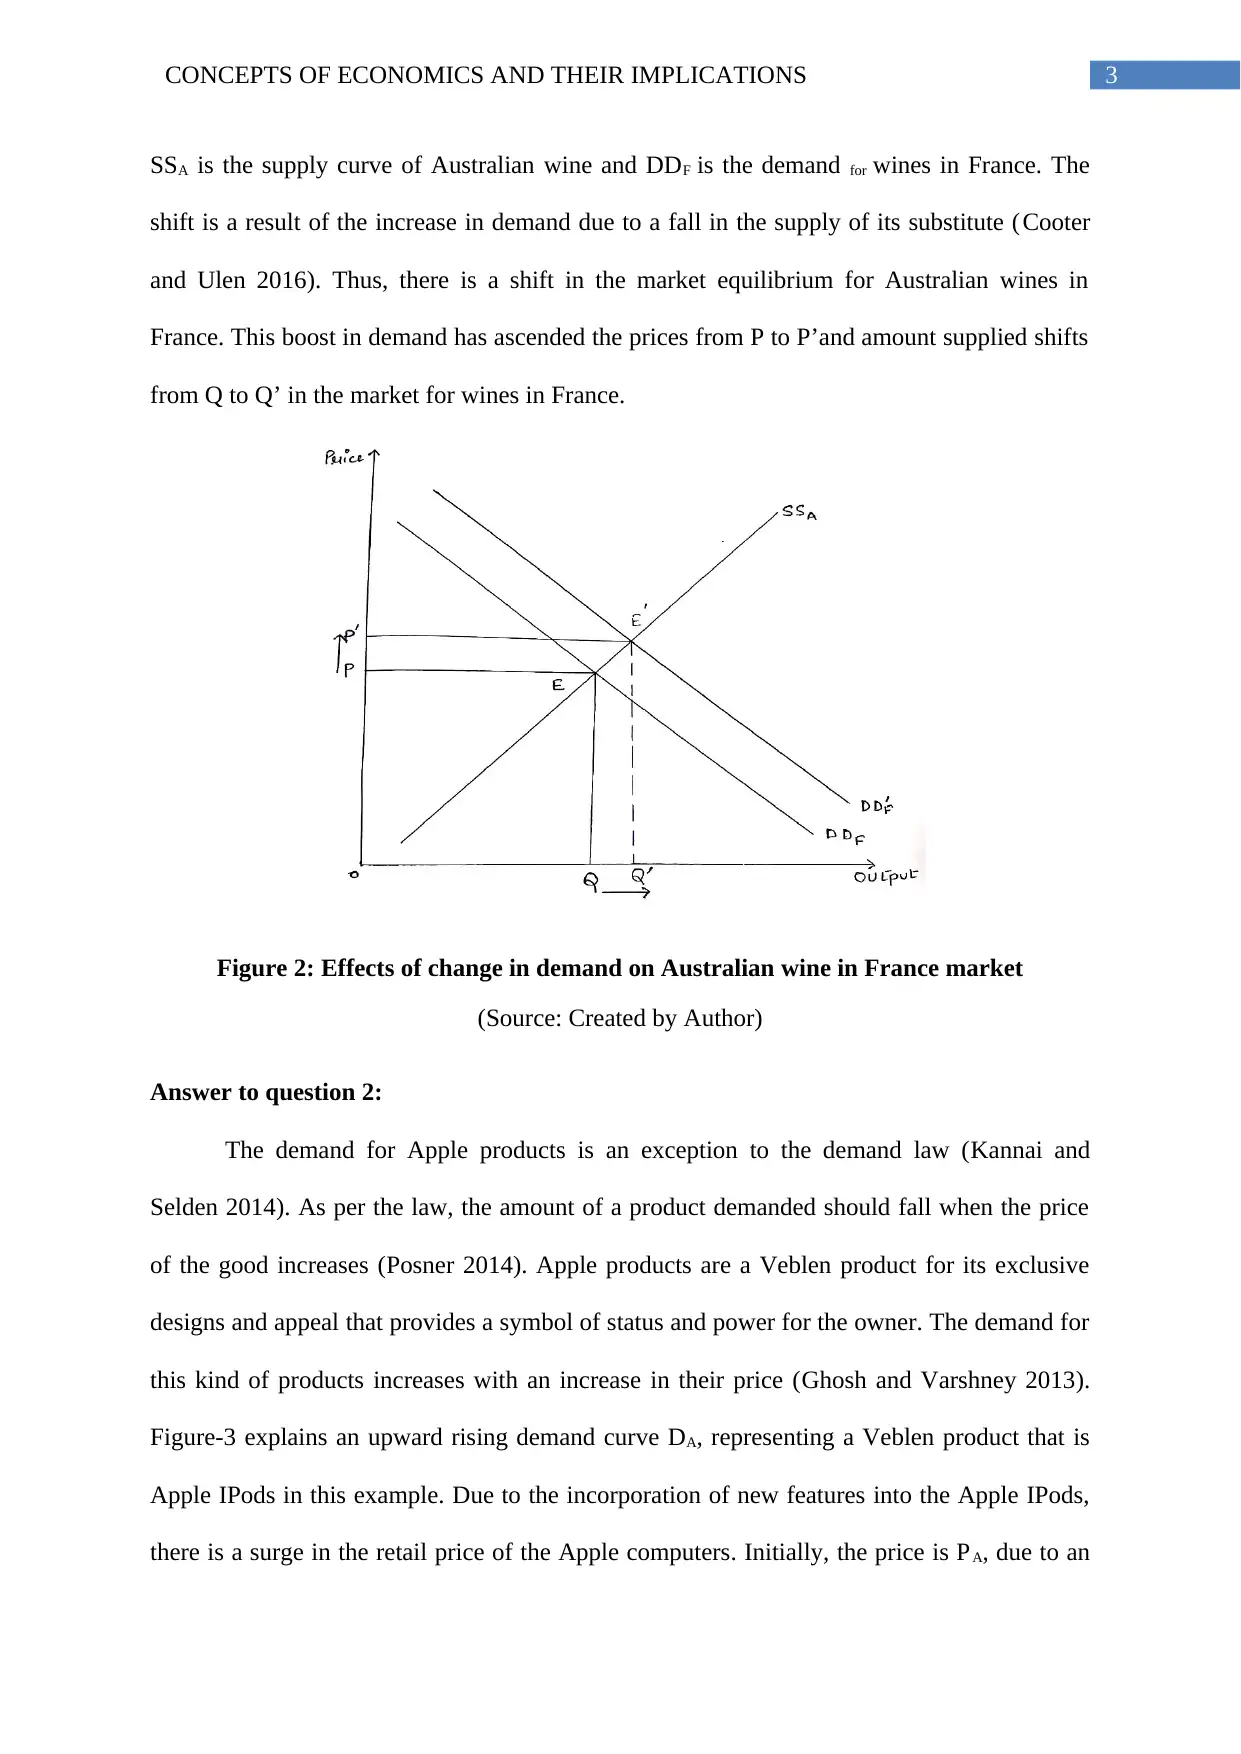
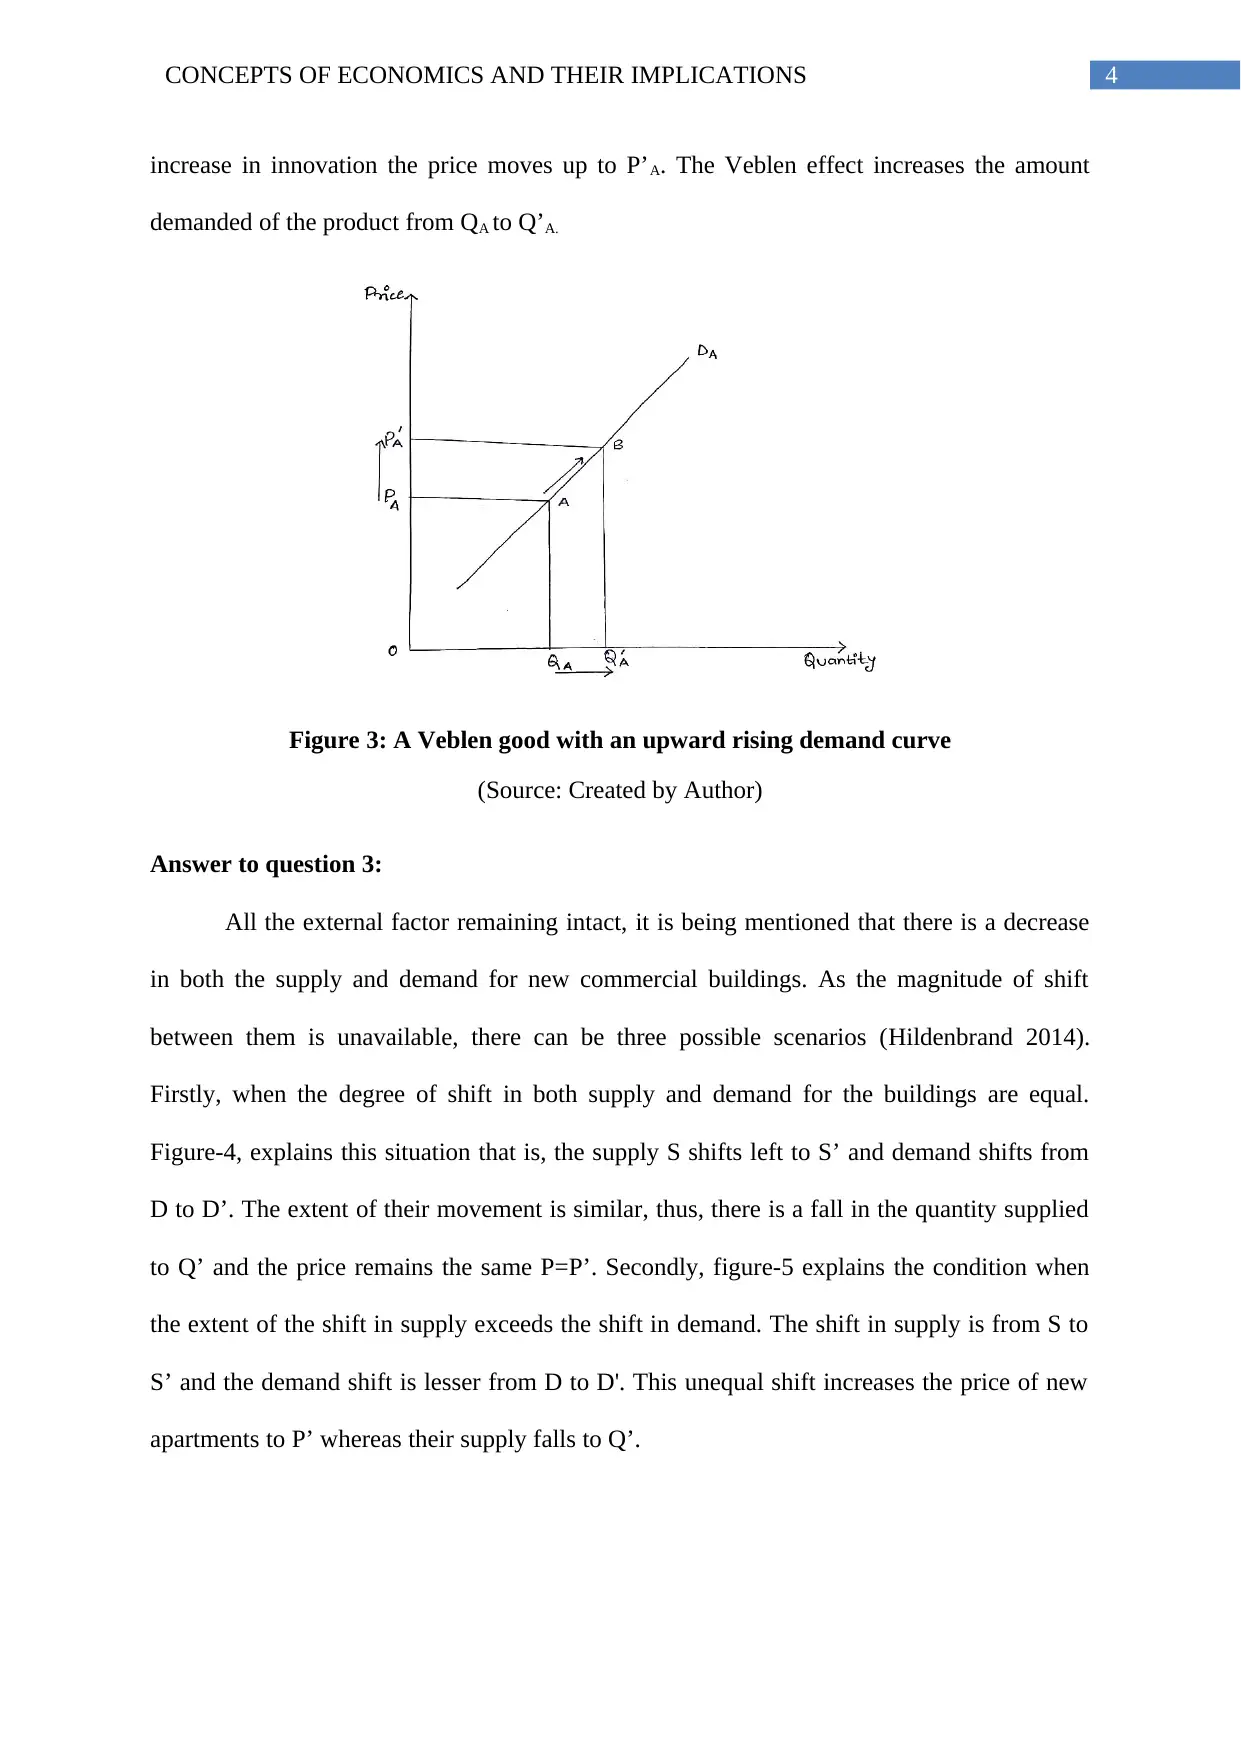
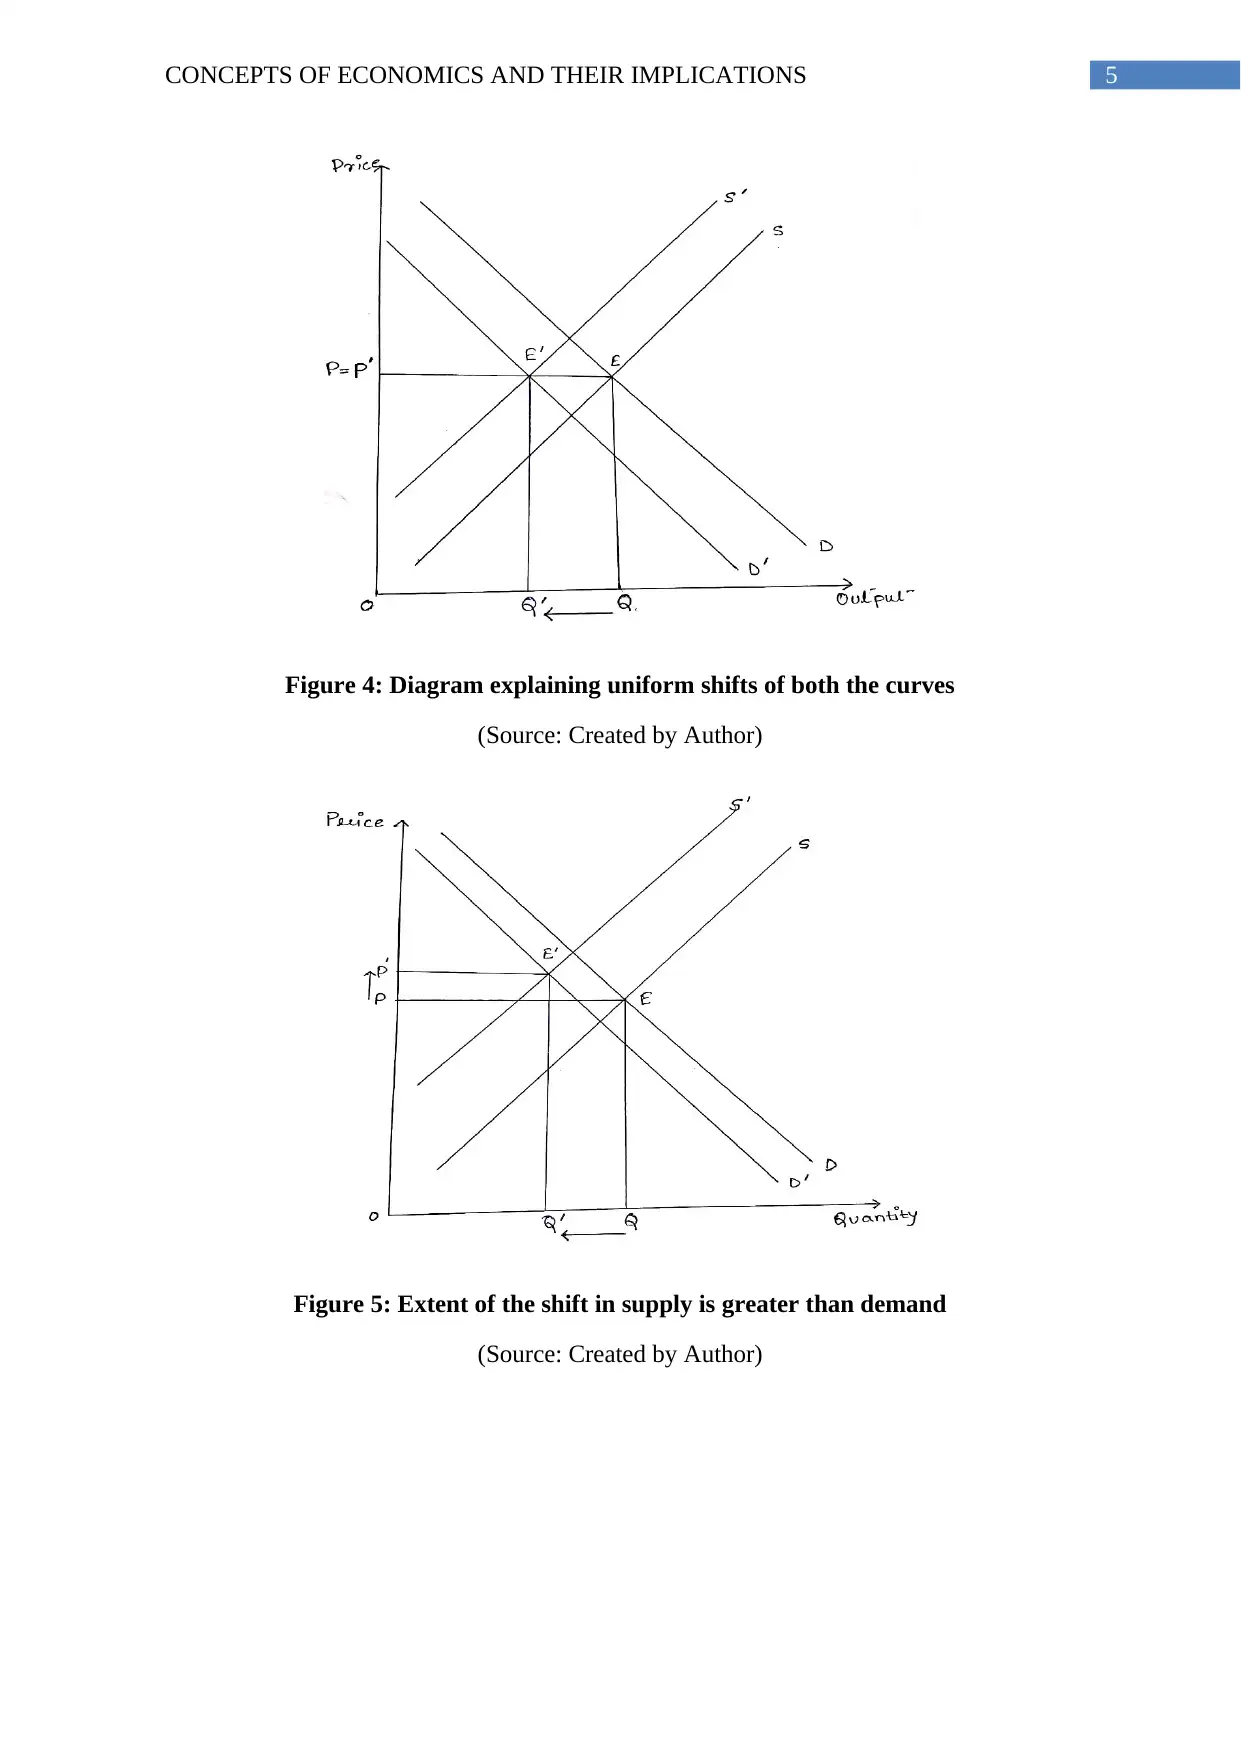
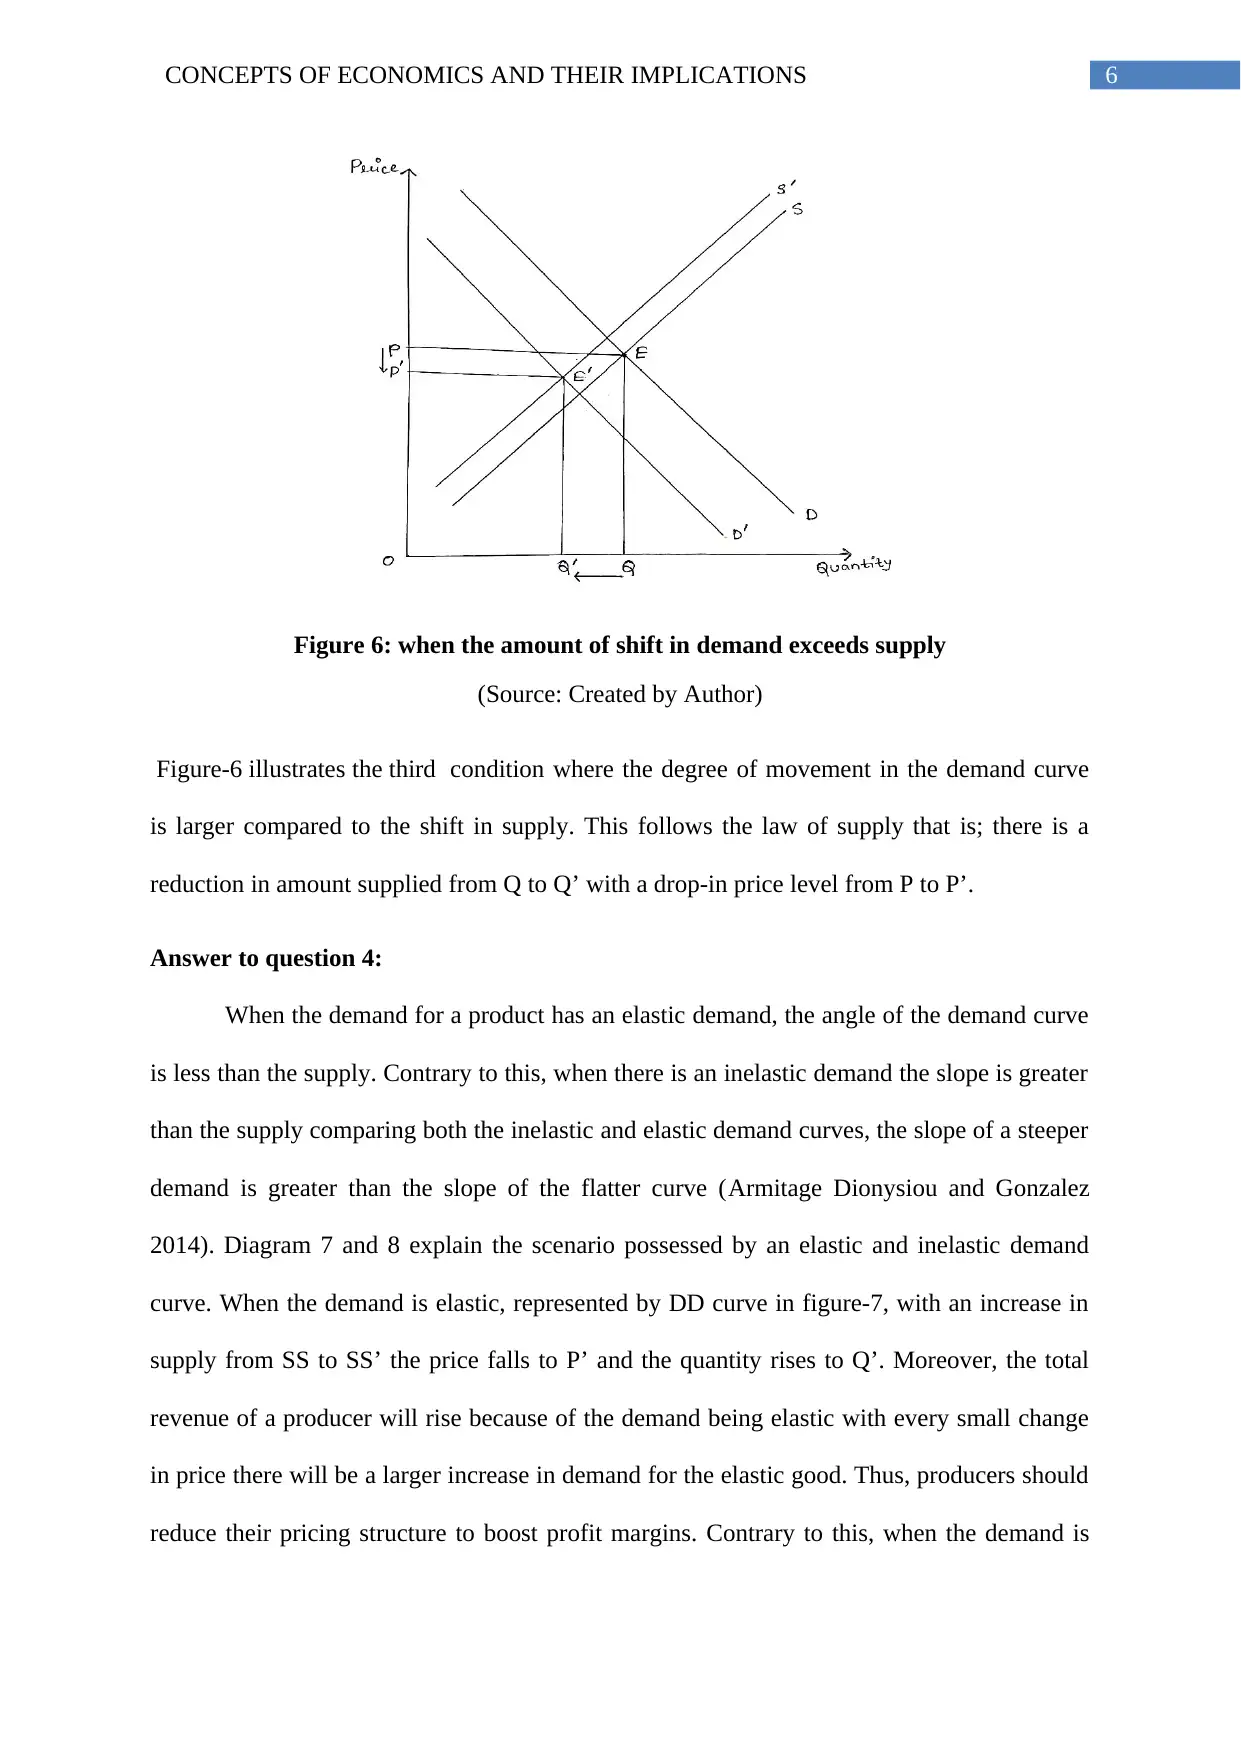
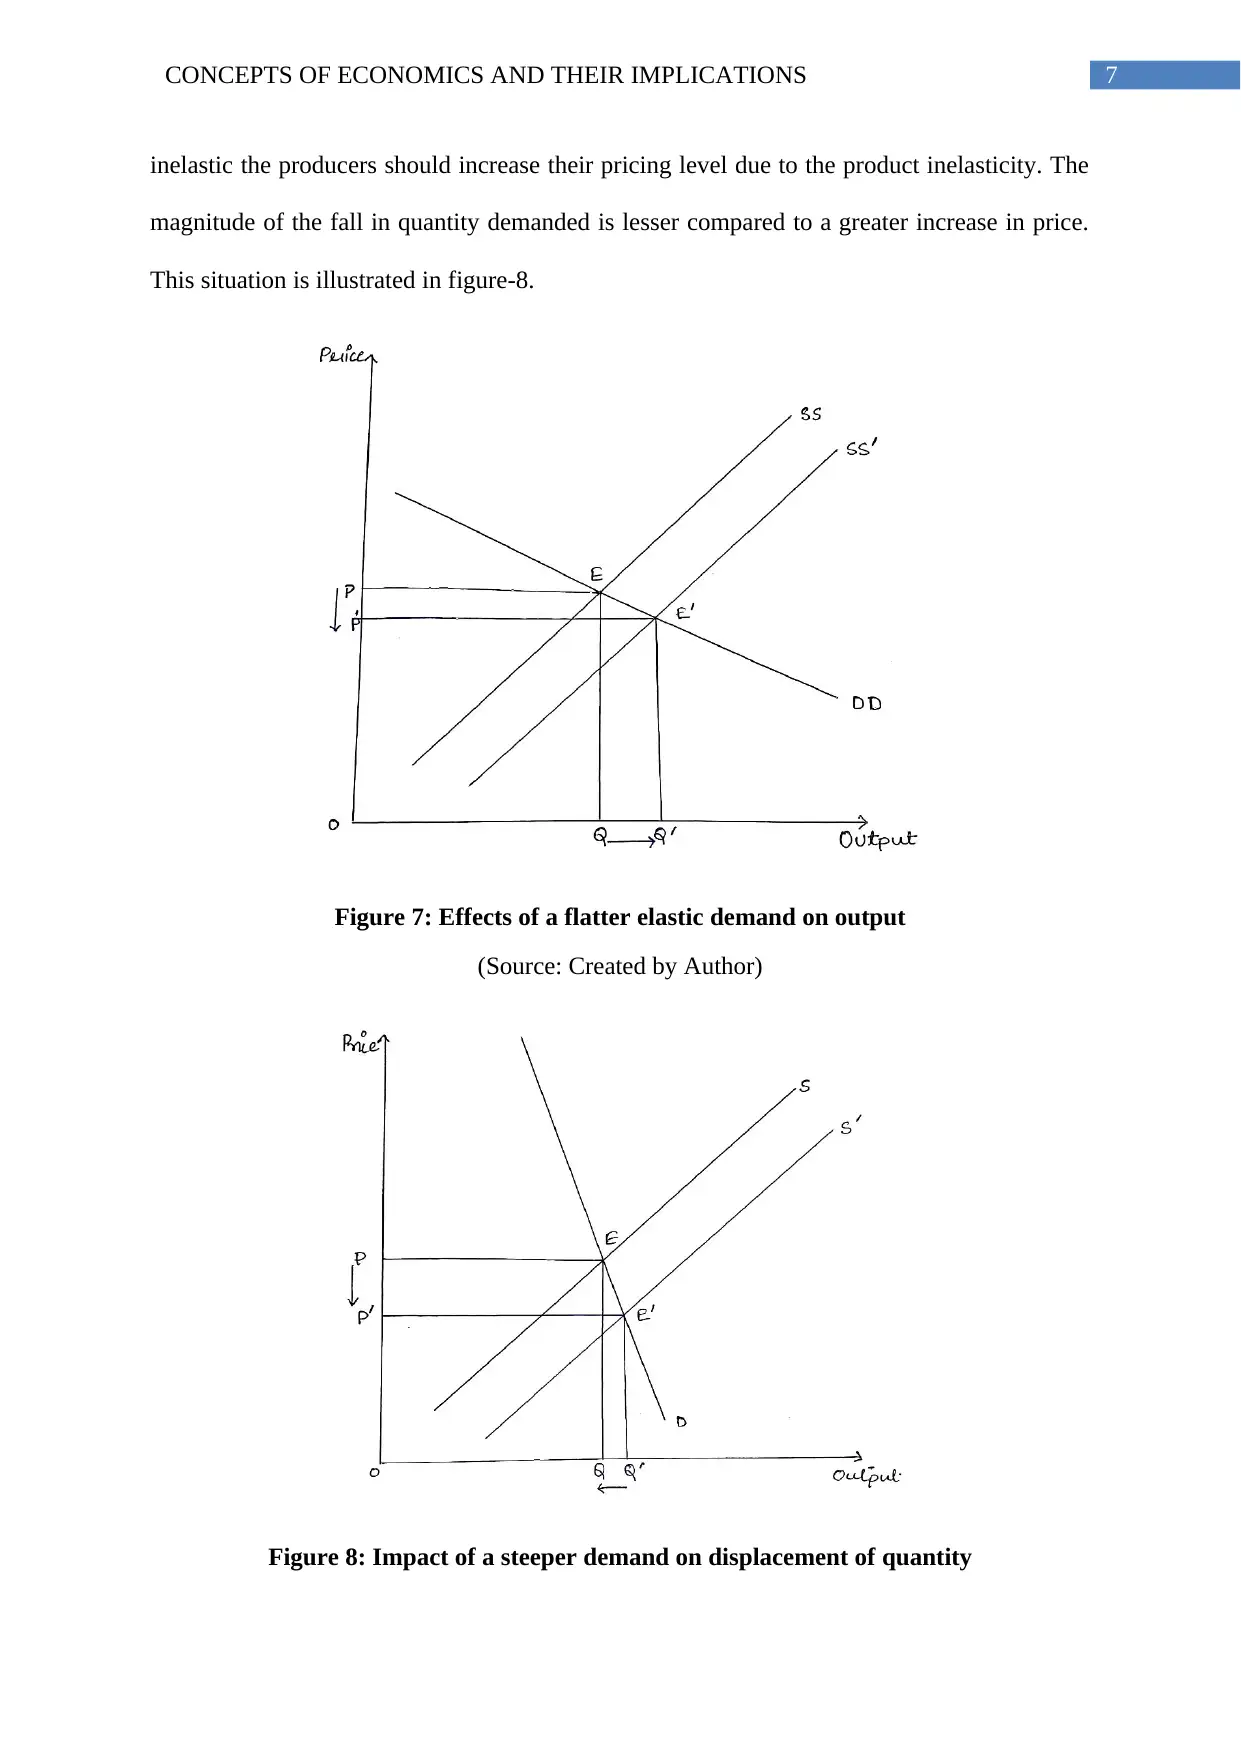
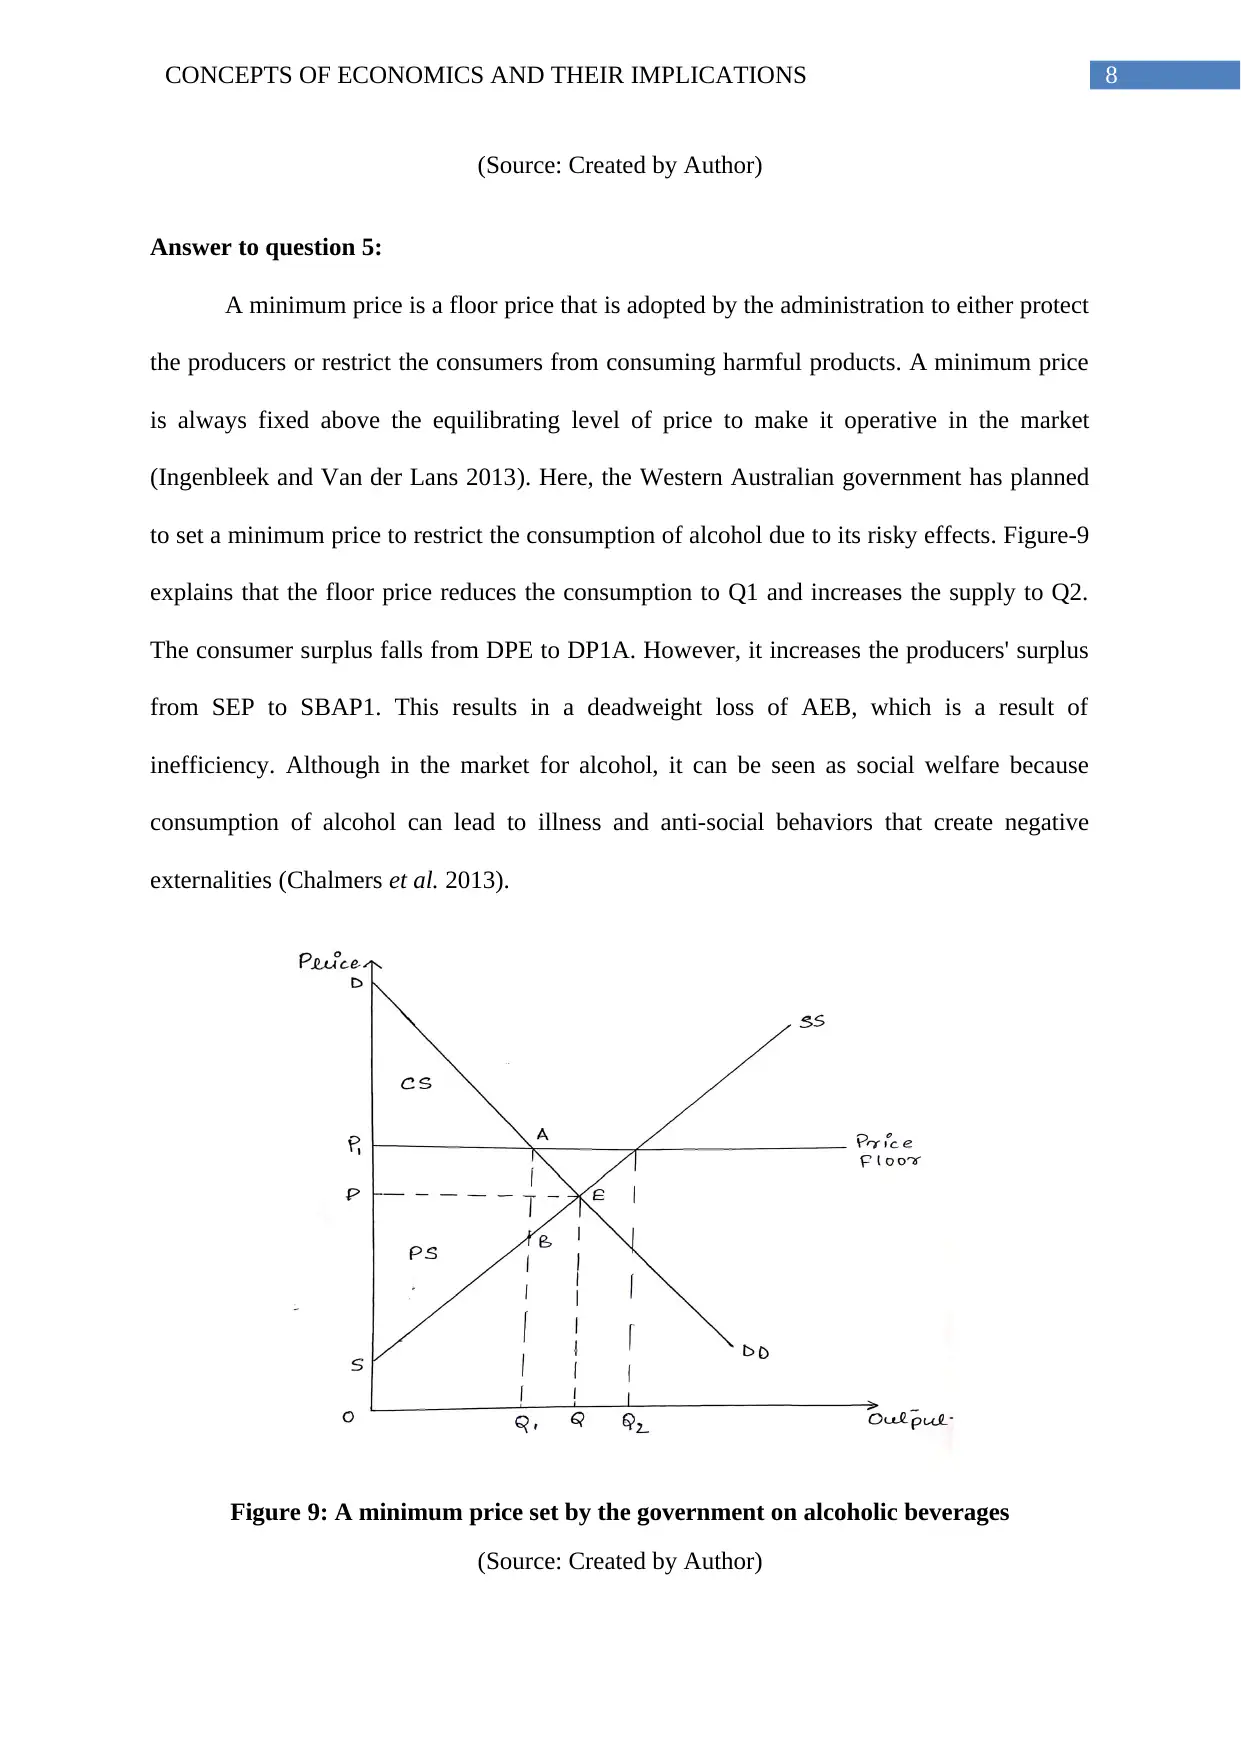
This economics assignment analyzes various market scenarios and economic concepts. The first question examines the impact of a poor wine-grape harvest in France on both the French and Australian wine markets, including shifts in supply and demand curves. The second question delves into the concept of Veblen goods, using Apple products as an example, and explains how their demand can increase with rising prices, contrary to the law of demand. The third question explores the effects of simultaneous decreases in both the supply and demand for commercial buildings, considering three possible scenarios based on the magnitude of the shifts. The fourth question contrasts elastic and inelastic demand curves, illustrating how producers should adjust pricing strategies based on demand elasticity. Finally, the fifth question discusses the implications of a minimum price set by the government on alcoholic beverages in Western Australia, analyzing its effects on consumer and producer surplus, and deadweight loss.

1 out of 11
Related Documents


Your All-in-One AI-Powered Toolkit for Academic Success.
+13062052269
info@desklib.com
Available 24*7 on WhatsApp / Email
![[object Object]](/_next/static/media/star-bottom.7253800d.svg)
Copyright © 2020–2026 A2Z Services. All Rights Reserved. Developed and managed by ZUCOL.