Economics for Business 2: GDP and Economic Growth in Australia
VerifiedAdded on 2021/06/17
|17
|3703
|50
Report
AI Summary
This report provides an in-depth analysis of the Australian economy, focusing on the Gross Domestic Product (GDP) and its components. It examines the dynamics of nominal and real GDP, highlighting the significance of macroeconomic indicators in assessing a country's economic performance. The report uses the Australian economy as a case study, analyzing the contributions of consumption, investment, government expenditure, and net exports to its GDP. It then delves into the trends of Australia's GDP over the last five years, including growth rates and per capita GDP, and the economic well-being of the population. Furthermore, the report explores the broader concept of economic growth, encompassing factors beyond GDP, such as employment rates, price levels, and consumption expenditure. The report also presents data on unemployment, consumption expenditure, and inflation in Australia from 2012 to 2017, demonstrating their impact on economic growth. The analysis underscores the interconnectedness of these indicators and their collective influence on the overall economic health and prosperity of the country.
Running head: ECONOMICS FOR BUSINESS
Economics for Business
Name of the Student
Name of the University
Author Note
Economics for Business
Name of the Student
Name of the University
Author Note
Paraphrase This Document
Need a fresh take? Get an instant paraphrase of this document with our AI Paraphraser
1ECONOMICS FOR BUSINESS
Introduction
Over the years, the global economic scenario has experienced considerable dynamics
and growth owing to the changing trends in the economies of the different economies of the
countries across the globe. The economic performance and growth of a country, in turn, can
be considerably measured by the dynamics and trends in several macroeconomic variables
and indicators of the country over the years (Canto, Joines and Laffer 2014). These
macroeconomic indicators, each having their own implications on the economy as a whole,
are of considerable significance as much of the health of the economy as well as the
economic well being of the population of the country depends on the same.
One of the most important macroeconomic indicators in this context is that of the
Gross Domestic Product of a country and its dynamics. The Gross Domestic Product of a
country within a particular period of time shows the value of the final goods as well as
services which are produced within the geographical domain of the country within that
particular period (Eichhorn 2013). Thus, the GDP growth of a country shows the growth in
the total productivity of the country, which in turn reflects towards the total income, total
expenditure as well as on the employment and economic well being of the population of the
country.
GDP on the other hand can be of two types- Nominal and Real. While the Nominal
GDP of the country shows the money value of the total production of the country without
adjustment of inflation, the Real GDP shows the total economic output the value of which is
inflation adjusted (Kubiszewski et al. 2013). Thus, a positive growth of GDP is associated
with economic boom and a negative one with that of recession and the overall dynamics of
GDP of a country reflects the general economic performance of the country to a considerable
extent.
2ECONOMICS FOR BUSINESS
Components of GDP: Case study of Australia
The Gross Domestic Product of a country within a period of time, is usually
composed of four major components, which can be seen with the help of the following
expression:
GDP (Y) = C + I + G + NX
[Where, C is the personal consumption expenditure in the economy, I shows the
business investment expenditure, G is the expenditure or purchases of the government of the
country and NX denotes the net exports of the country, which in turn shows the value left
after deducting the value of imports from the value of exports (X-M)]
Each of these components are as follows:
C- The primary as well as the most significant component of GDP of any country is the
personal consumption expenditure in the country, which in turn is spent in buying different
goods and services in the country.
I- This shows the business investment expenditure of a country, which usually include the
purchases which the companies make in the domestic boundaries in order to produce goods
and services in the country. However, purchase for replacing any existing commodity is not
counted in the GDP (Papell and Prodan 2012).
G- This component of the GDP of a country shows the total expenditures which are made by
the government of the concerned country, which includes expenditures in the aspects of
industry, public goods and services, infrastructural development and others.
⊘ This is a preview!⊘
Do you want full access?
Subscribe today to unlock all pages.
Trusted by 1+ million students worldwide
3ECONOMICS FOR BUSINESS
NX- Exports add to the value of the GDP of the country while imports subtract from the
same. The Net Exports of a country, thus shows the value which is left after deducting the
total import value from the value of the total exports.
Australian Economy
In this context, one of the most significantly developed economies across the globe
over the years, has been the economy of Australia, whose growth and development can be
seen in its robust GDP statistics (Mathur). The GDP of the country in 2017, can be seen to be
1.69 trillion AUD dollars and the country is also seen to be ranking fourteenth globally in
terms of Nominal GDP and twentieth largest in terms of the PPP adjusted GDP in the global
scenario and is counted as the second wealthiest nation in terms of per adult wealth, ranking
just behind Switzerland, thereby appearing as one of the most dominant and significant
economies in the global framework (Pocock, Charlesworth and Chapman 2013).
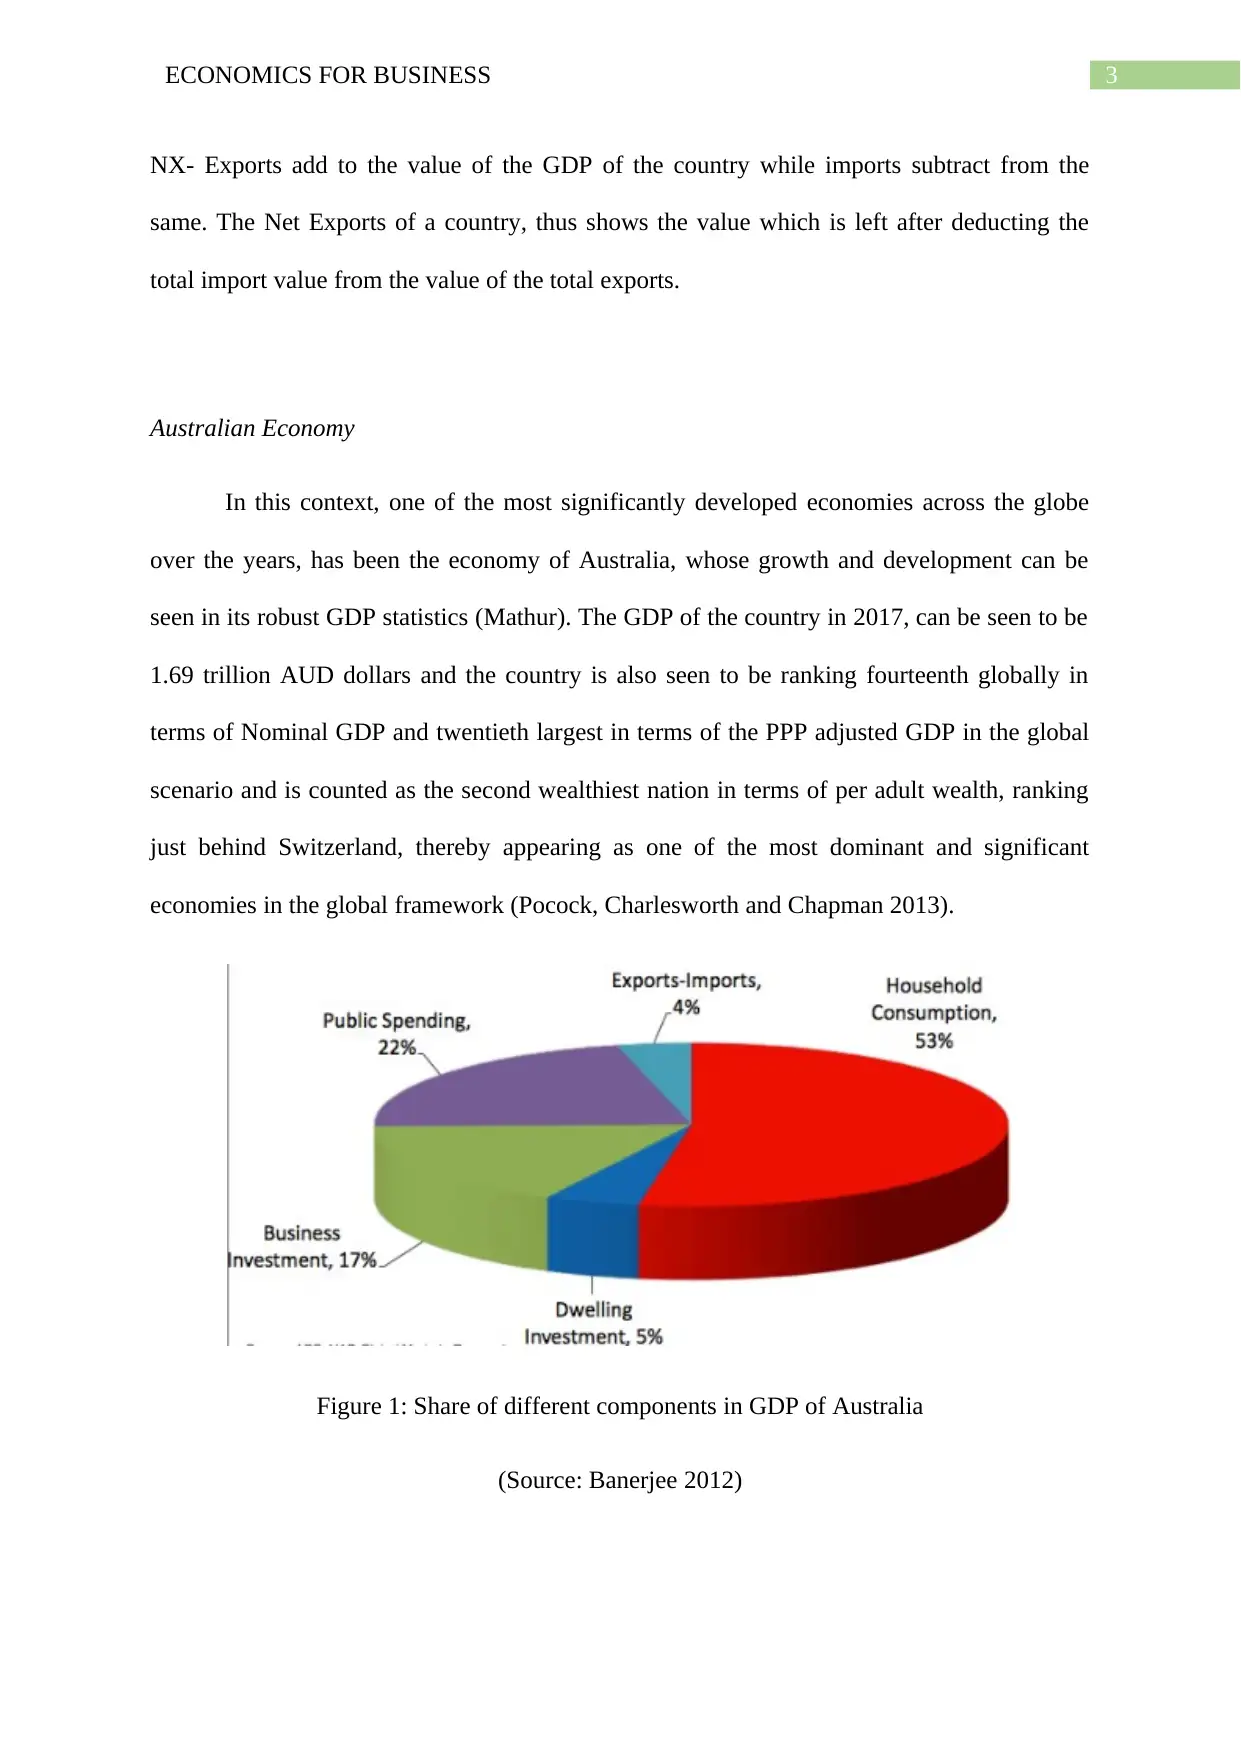
Figure 1: Share of different components in GDP of Australia
(Source: Banerjee 2012)
NX- Exports add to the value of the GDP of the country while imports subtract from the
same. The Net Exports of a country, thus shows the value which is left after deducting the
total import value from the value of the total exports.
Australian Economy
In this context, one of the most significantly developed economies across the globe
over the years, has been the economy of Australia, whose growth and development can be
seen in its robust GDP statistics (Mathur). The GDP of the country in 2017, can be seen to be
1.69 trillion AUD dollars and the country is also seen to be ranking fourteenth globally in
terms of Nominal GDP and twentieth largest in terms of the PPP adjusted GDP in the global
scenario and is counted as the second wealthiest nation in terms of per adult wealth, ranking
just behind Switzerland, thereby appearing as one of the most dominant and significant
economies in the global framework (Pocock, Charlesworth and Chapman 2013).
Figure 1: Share of different components in GDP of Australia
(Source: Banerjee 2012)
Paraphrase This Document
Need a fresh take? Get an instant paraphrase of this document with our AI Paraphraser
4ECONOMICS FOR BUSINESS
As is evident from the above figure, the consumption is the biggest component in the
GDP of Australia, followed by the government expenditure and investment statistics.
GDP dynamics of Australia in the last five years
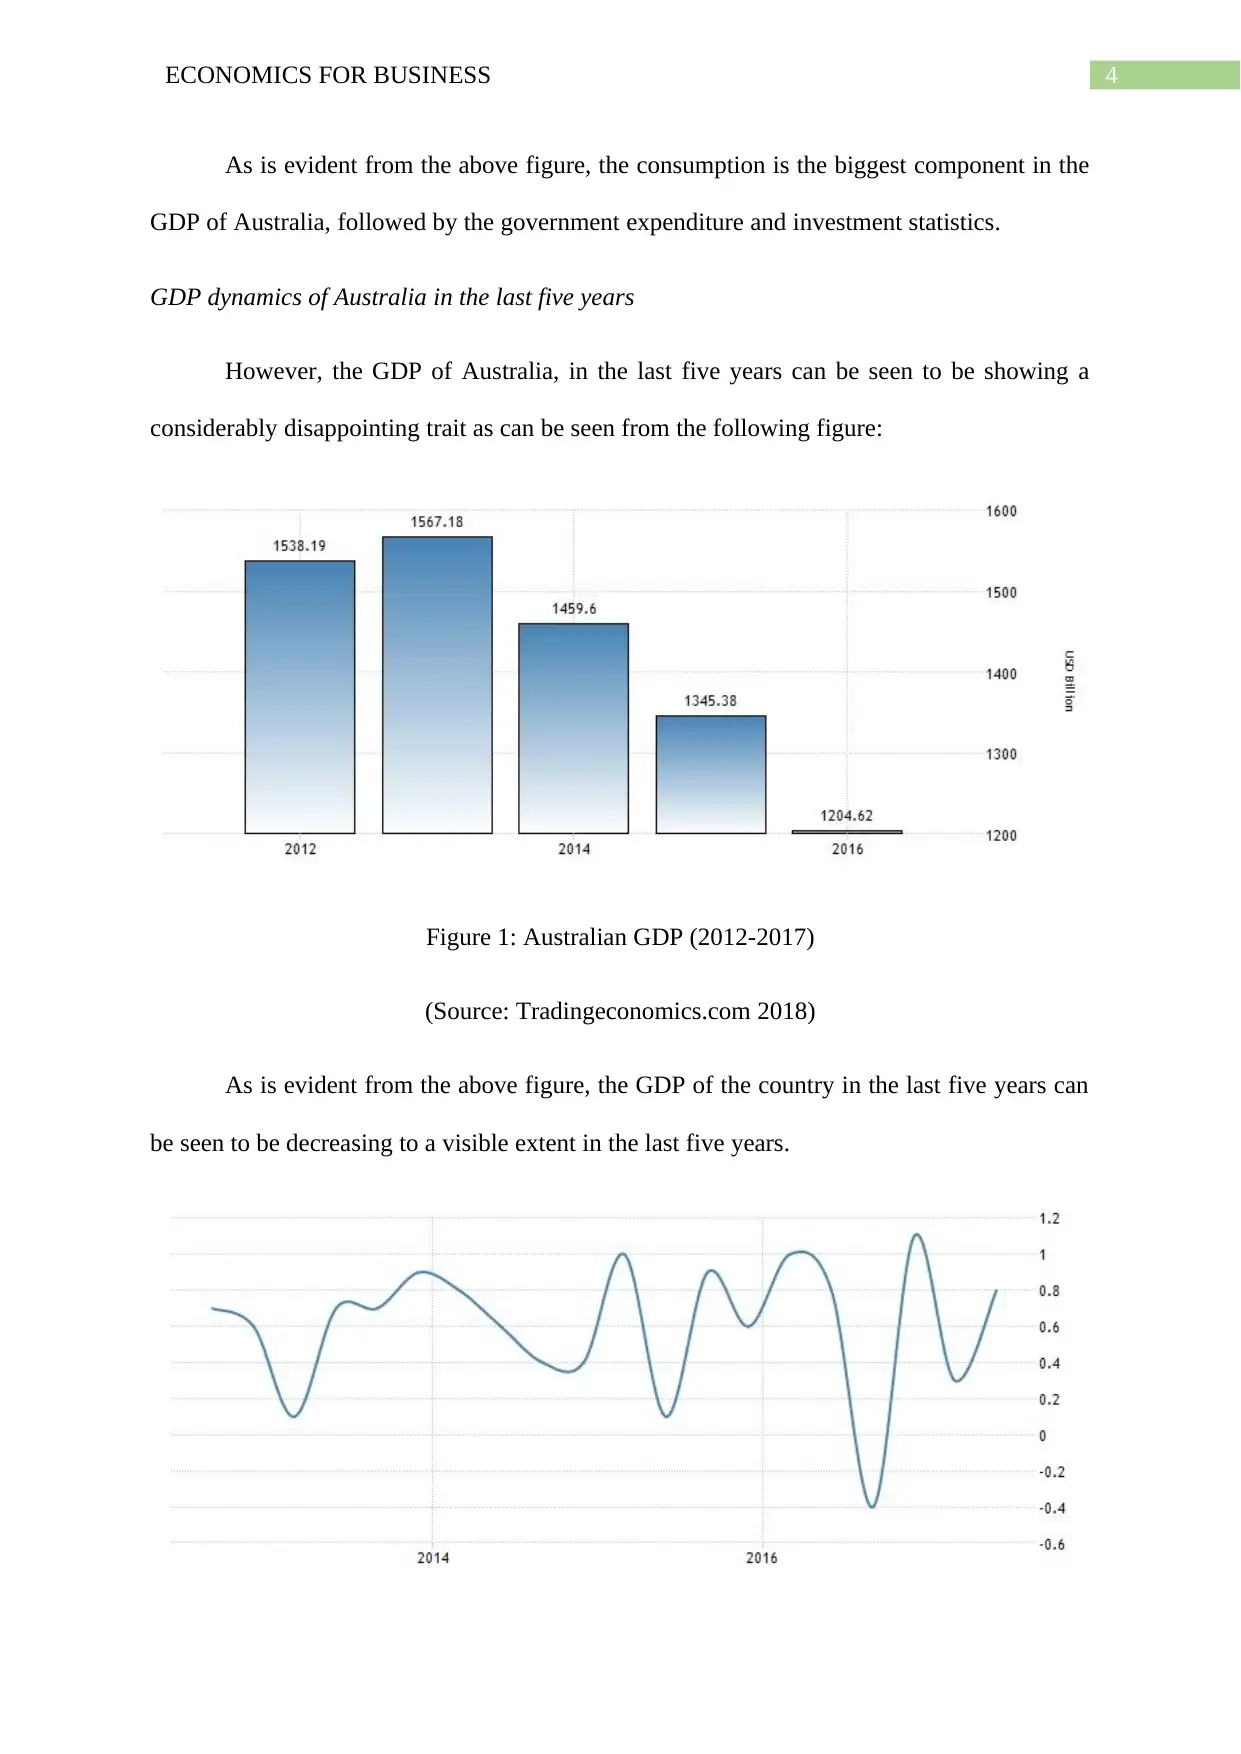
However, the GDP of Australia, in the last five years can be seen to be showing a
considerably disappointing trait as can be seen from the following figure:
Figure 1: Australian GDP (2012-2017)
(Source: Tradingeconomics.com 2018)
As is evident from the above figure, the GDP of the country in the last five years can
be seen to be decreasing to a visible extent in the last five years.
As is evident from the above figure, the consumption is the biggest component in the
GDP of Australia, followed by the government expenditure and investment statistics.
GDP dynamics of Australia in the last five years
However, the GDP of Australia, in the last five years can be seen to be showing a
considerably disappointing trait as can be seen from the following figure:
Figure 1: Australian GDP (2012-2017)
(Source: Tradingeconomics.com 2018)
As is evident from the above figure, the GDP of the country in the last five years can
be seen to be decreasing to a visible extent in the last five years.
5ECONOMICS FOR BUSINESS
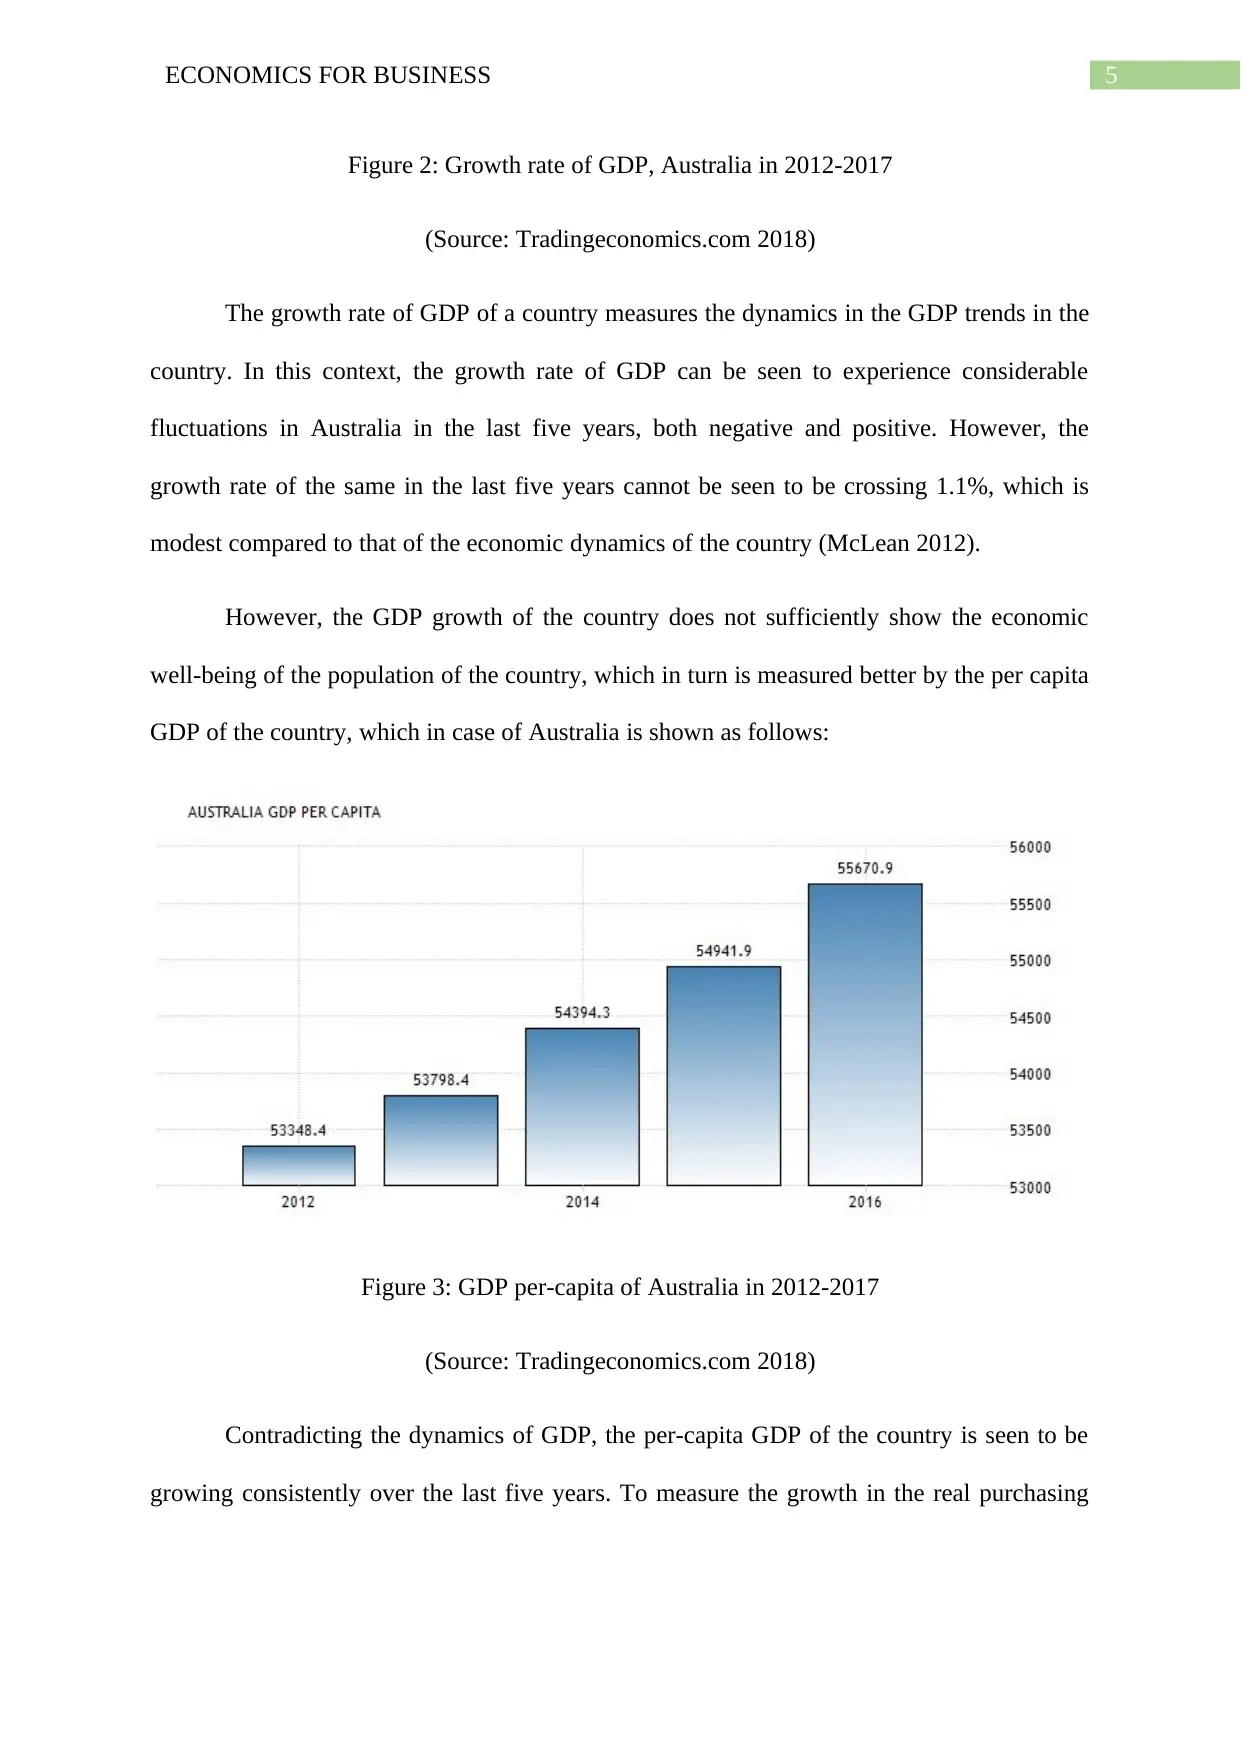
Figure 2: Growth rate of GDP, Australia in 2012-2017
(Source: Tradingeconomics.com 2018)
The growth rate of GDP of a country measures the dynamics in the GDP trends in the
country. In this context, the growth rate of GDP can be seen to experience considerable
fluctuations in Australia in the last five years, both negative and positive. However, the
growth rate of the same in the last five years cannot be seen to be crossing 1.1%, which is
modest compared to that of the economic dynamics of the country (McLean 2012).
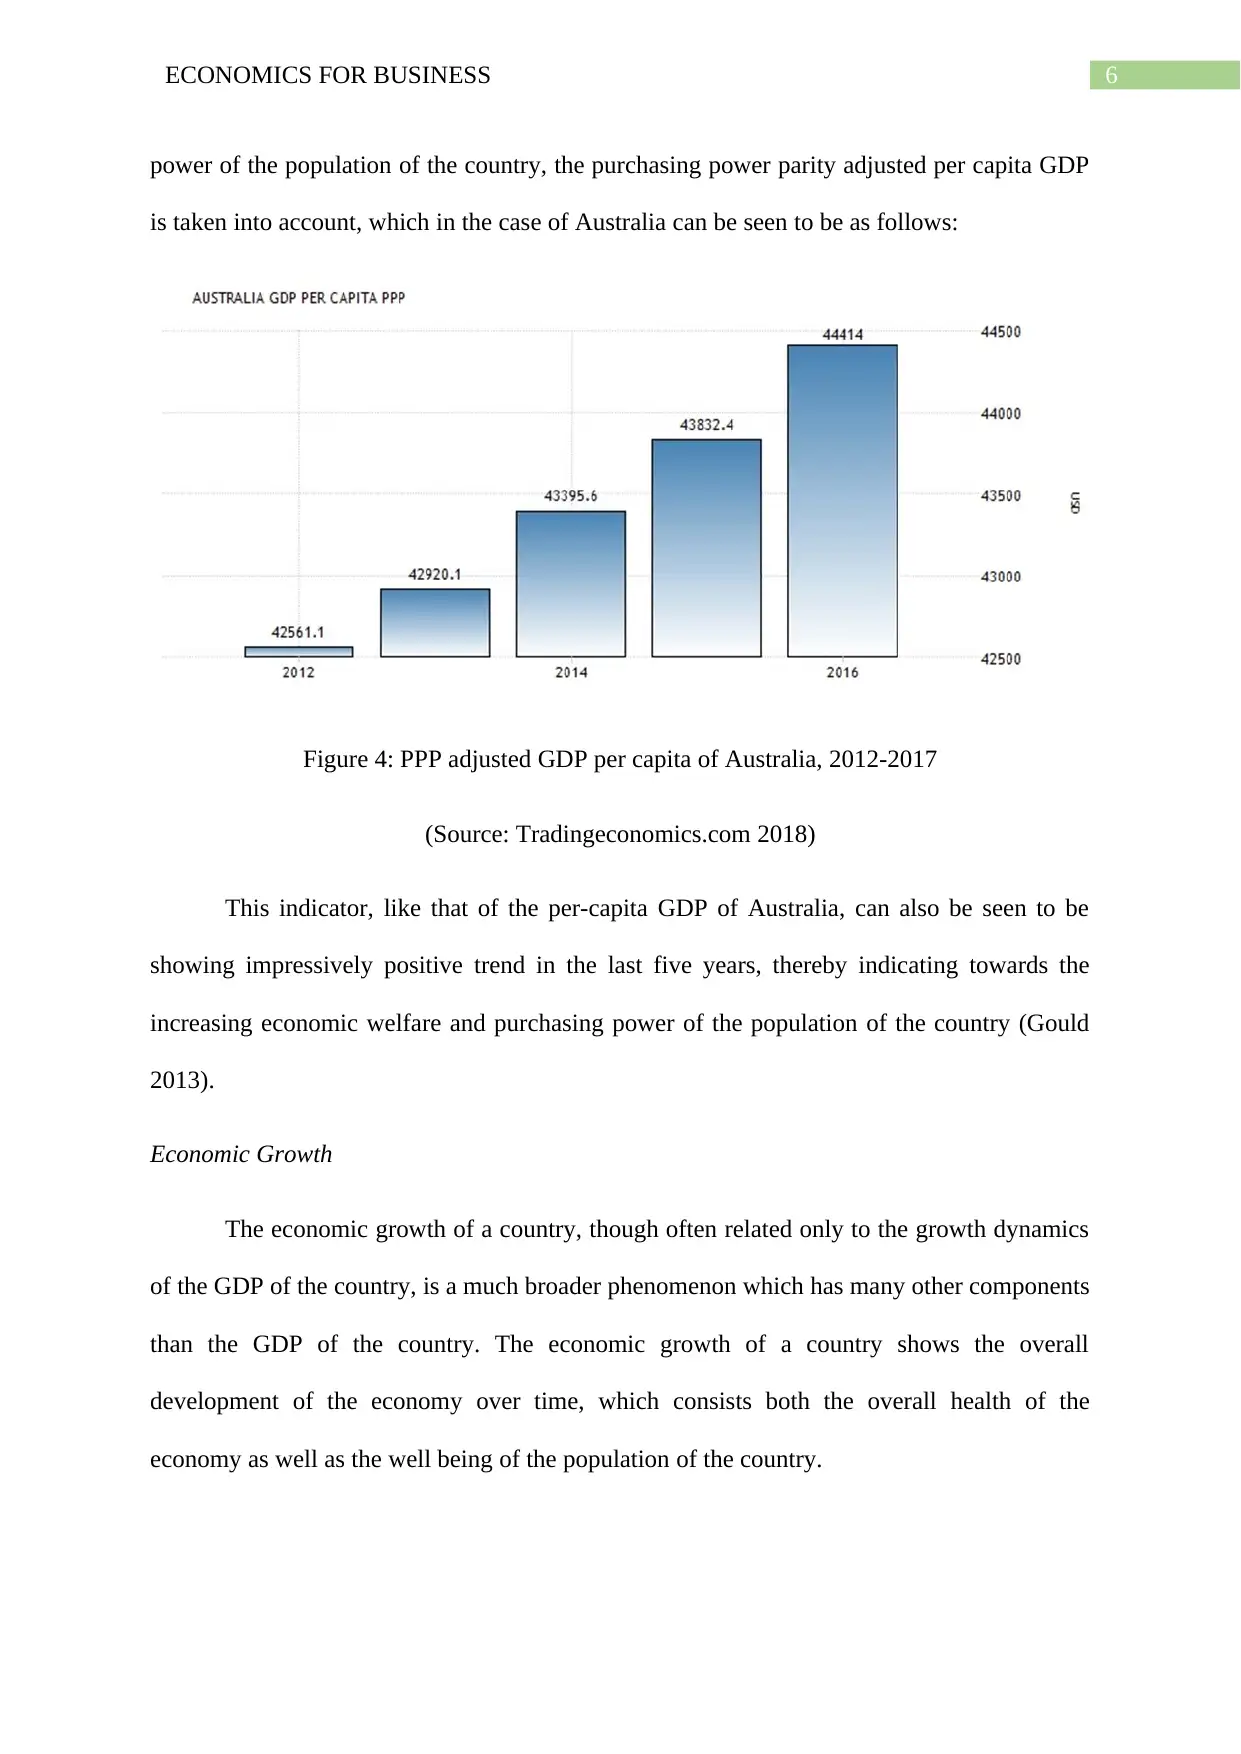
However, the GDP growth of the country does not sufficiently show the economic
well-being of the population of the country, which in turn is measured better by the per capita
GDP of the country, which in case of Australia is shown as follows:
Figure 3: GDP per-capita of Australia in 2012-2017
(Source: Tradingeconomics.com 2018)
Contradicting the dynamics of GDP, the per-capita GDP of the country is seen to be
growing consistently over the last five years. To measure the growth in the real purchasing
Figure 2: Growth rate of GDP, Australia in 2012-2017
(Source: Tradingeconomics.com 2018)
The growth rate of GDP of a country measures the dynamics in the GDP trends in the
country. In this context, the growth rate of GDP can be seen to experience considerable
fluctuations in Australia in the last five years, both negative and positive. However, the
growth rate of the same in the last five years cannot be seen to be crossing 1.1%, which is
modest compared to that of the economic dynamics of the country (McLean 2012).
However, the GDP growth of the country does not sufficiently show the economic
well-being of the population of the country, which in turn is measured better by the per capita
GDP of the country, which in case of Australia is shown as follows:
Figure 3: GDP per-capita of Australia in 2012-2017
(Source: Tradingeconomics.com 2018)
Contradicting the dynamics of GDP, the per-capita GDP of the country is seen to be
growing consistently over the last five years. To measure the growth in the real purchasing
⊘ This is a preview!⊘
Do you want full access?
Subscribe today to unlock all pages.
Trusted by 1+ million students worldwide
6ECONOMICS FOR BUSINESS
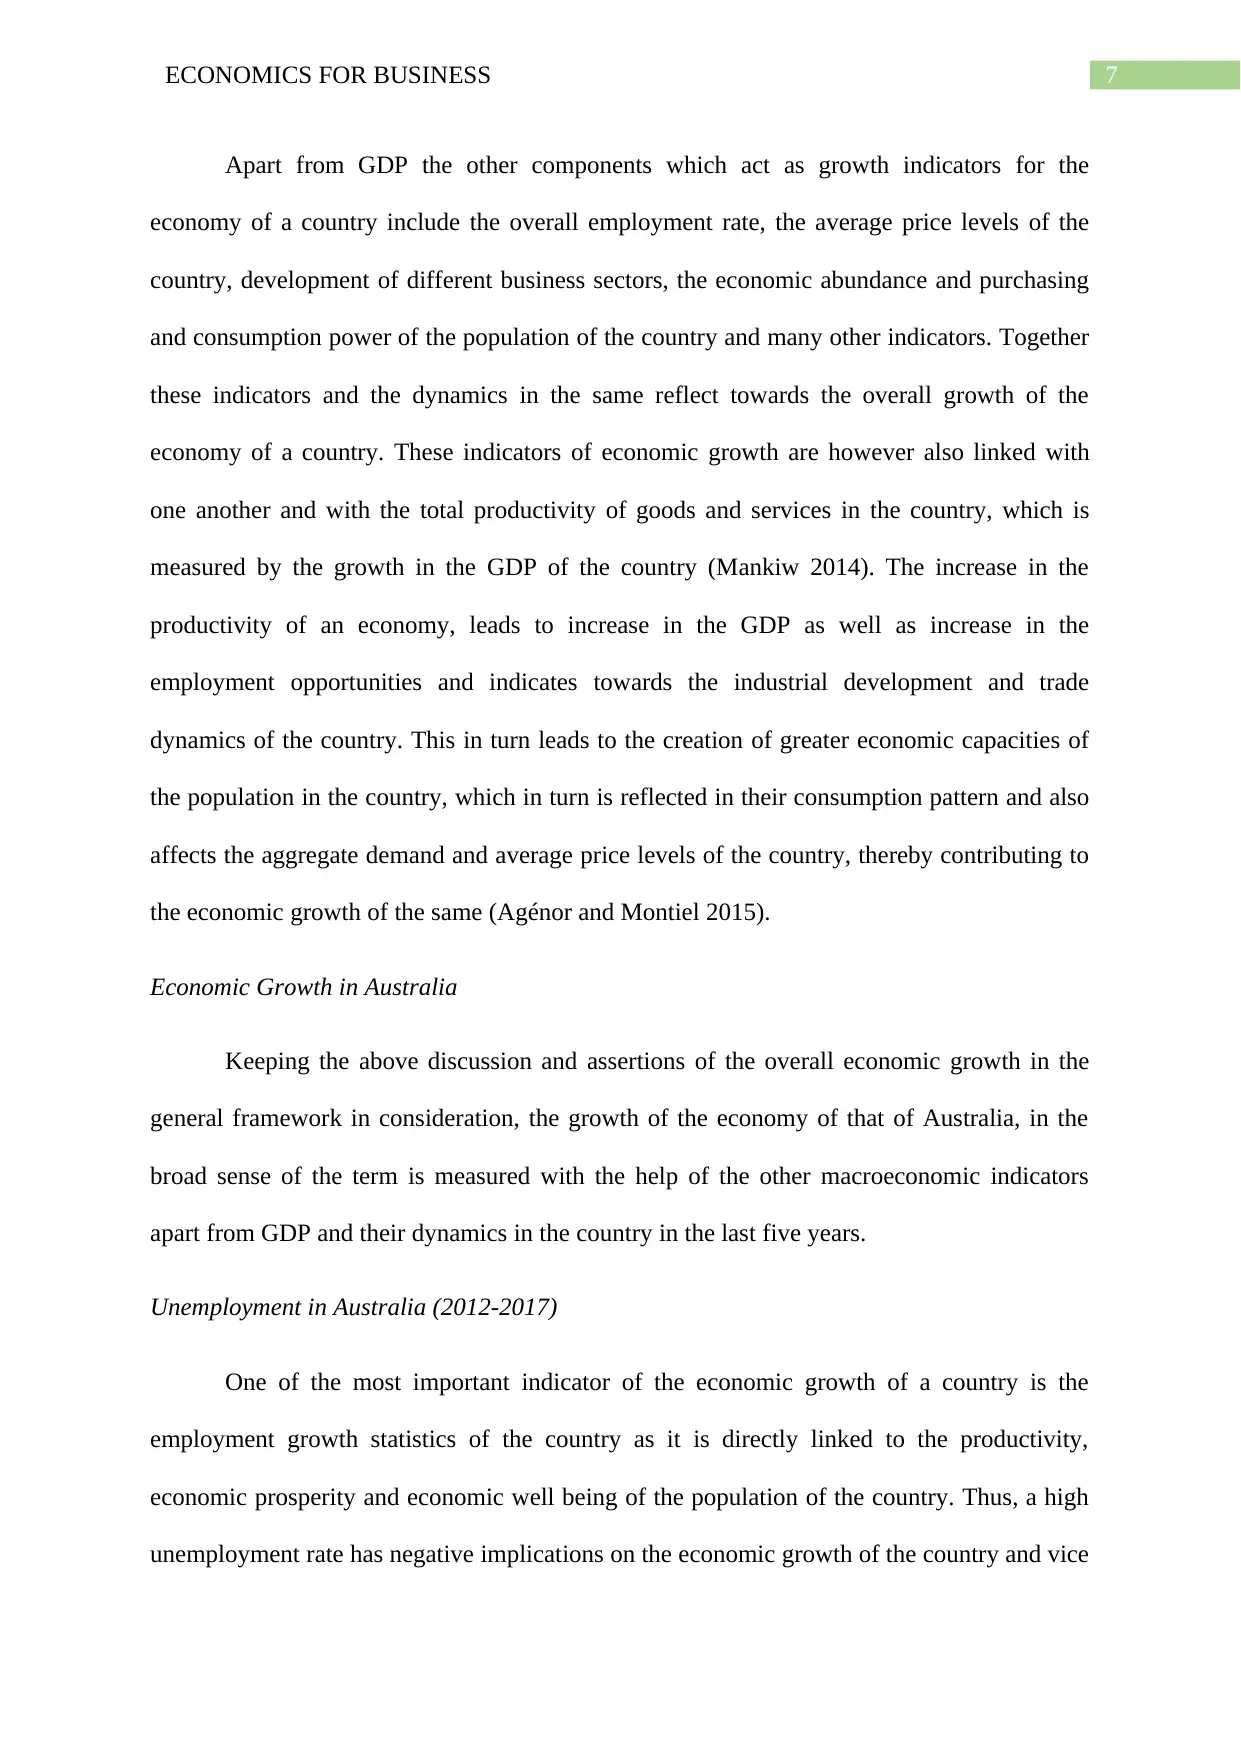
power of the population of the country, the purchasing power parity adjusted per capita GDP
is taken into account, which in the case of Australia can be seen to be as follows:
Figure 4: PPP adjusted GDP per capita of Australia, 2012-2017
(Source: Tradingeconomics.com 2018)
This indicator, like that of the per-capita GDP of Australia, can also be seen to be
showing impressively positive trend in the last five years, thereby indicating towards the
increasing economic welfare and purchasing power of the population of the country (Gould
2013).
Economic Growth
The economic growth of a country, though often related only to the growth dynamics
of the GDP of the country, is a much broader phenomenon which has many other components
than the GDP of the country. The economic growth of a country shows the overall
development of the economy over time, which consists both the overall health of the
economy as well as the well being of the population of the country.
Paraphrase This Document
Need a fresh take? Get an instant paraphrase of this document with our AI Paraphraser
7ECONOMICS FOR BUSINESS
Apart from GDP the other components which act as growth indicators for the
economy of a country include the overall employment rate, the average price levels of the
country, development of different business sectors, the economic abundance and purchasing
and consumption power of the population of the country and many other indicators. Together
these indicators and the dynamics in the same reflect towards the overall growth of the
economy of a country. These indicators of economic growth are however also linked with
one another and with the total productivity of goods and services in the country, which is
measured by the growth in the GDP of the country (Mankiw 2014). The increase in the
productivity of an economy, leads to increase in the GDP as well as increase in the
employment opportunities and indicates towards the industrial development and trade
dynamics of the country. This in turn leads to the creation of greater economic capacities of
the population in the country, which in turn is reflected in their consumption pattern and also
affects the aggregate demand and average price levels of the country, thereby contributing to
the economic growth of the same (Agénor and Montiel 2015).
Economic Growth in Australia
Keeping the above discussion and assertions of the overall economic growth in the
general framework in consideration, the growth of the economy of that of Australia, in the
broad sense of the term is measured with the help of the other macroeconomic indicators
apart from GDP and their dynamics in the country in the last five years.
Unemployment in Australia (2012-2017)
One of the most important indicator of the economic growth of a country is the
employment growth statistics of the country as it is directly linked to the productivity,
economic prosperity and economic well being of the population of the country. Thus, a high
unemployment rate has negative implications on the economic growth of the country and vice

8ECONOMICS FOR BUSINESS
versa (Butlin 2013). Keeping this into consideration, the unemployment dynamics of
Australia can be seen as follows:
Figure 5: Rate of unemployment in Australia, 2012-2017
(Source: Tradingeconomics.com 2018)
As can be seen from the above figure, the unemployment rate of the Australia can be
seen to have experienced considerable dynamics over the last five years. The unemployment
rate of the country can be seen to be increasing from a considerably low rate in 2012, till
nearly 6.3% in the end quarter of 2015. However, post that period the rate of unemployment
can be seen to be decreasing in the last few years and can be seen to settling within the range
of 5.4% to 5.6% in the last year (Hartwell 2017). This in turn indicates towards the fact that
new jobs are getting created in the economy, which in turn can also be a reason behind the
overall increase in the PPP adjusted growth rate of per capita GDP of Australia and all these
indicate towards considerable growth in the economy of the country.
Consumption Expenditure in Australia
Another important indicator of economic growth of the country is the increase in the
economic well-being of the population, in general, of the country. This can be seen from the
⊘ This is a preview!⊘
Do you want full access?
Subscribe today to unlock all pages.
Trusted by 1+ million students worldwide
9ECONOMICS FOR BUSINESS
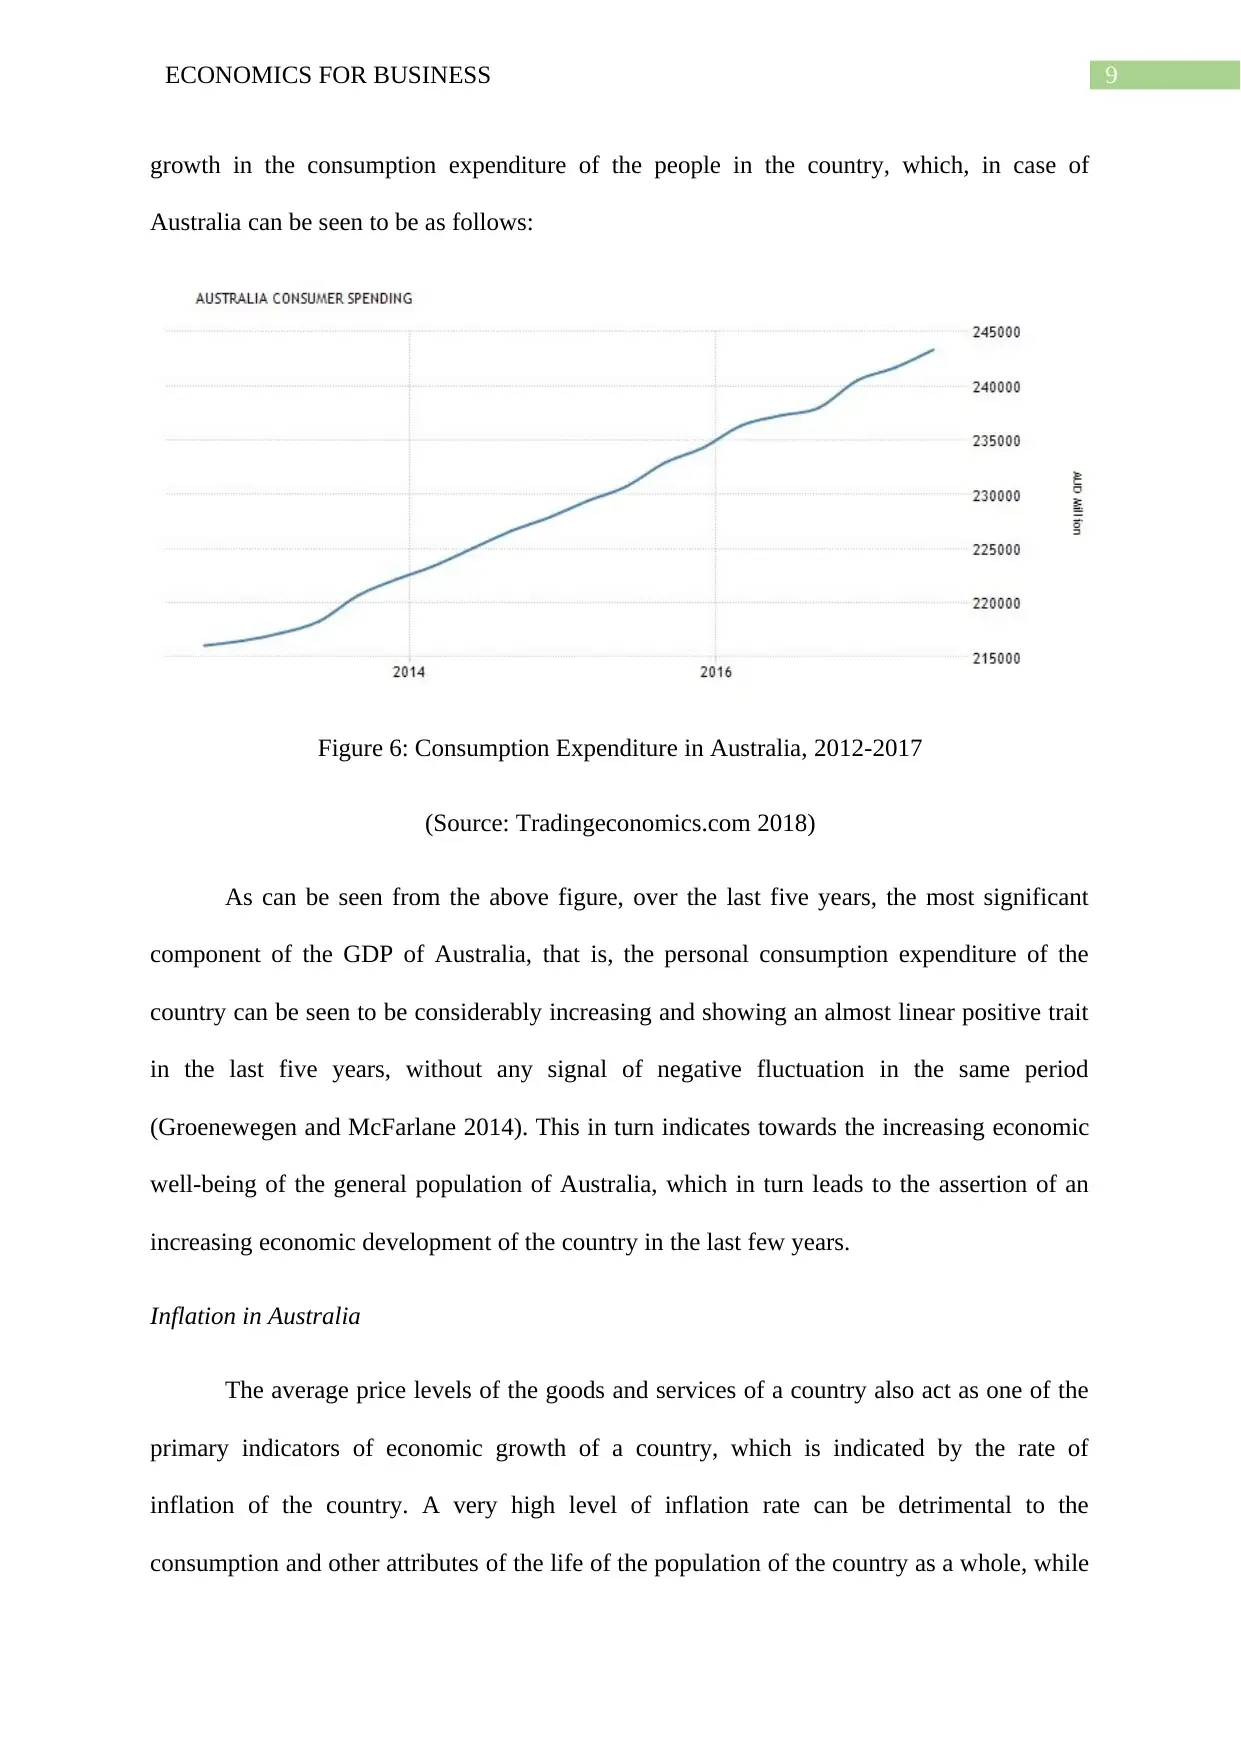
growth in the consumption expenditure of the people in the country, which, in case of
Australia can be seen to be as follows:
Figure 6: Consumption Expenditure in Australia, 2012-2017
(Source: Tradingeconomics.com 2018)
As can be seen from the above figure, over the last five years, the most significant
component of the GDP of Australia, that is, the personal consumption expenditure of the
country can be seen to be considerably increasing and showing an almost linear positive trait
in the last five years, without any signal of negative fluctuation in the same period
(Groenewegen and McFarlane 2014). This in turn indicates towards the increasing economic
well-being of the general population of Australia, which in turn leads to the assertion of an
increasing economic development of the country in the last few years.
Inflation in Australia
The average price levels of the goods and services of a country also act as one of the
primary indicators of economic growth of a country, which is indicated by the rate of
inflation of the country. A very high level of inflation rate can be detrimental to the
consumption and other attributes of the life of the population of the country as a whole, while
Paraphrase This Document
Need a fresh take? Get an instant paraphrase of this document with our AI Paraphraser
10ECONOMICS FOR BUSINESS
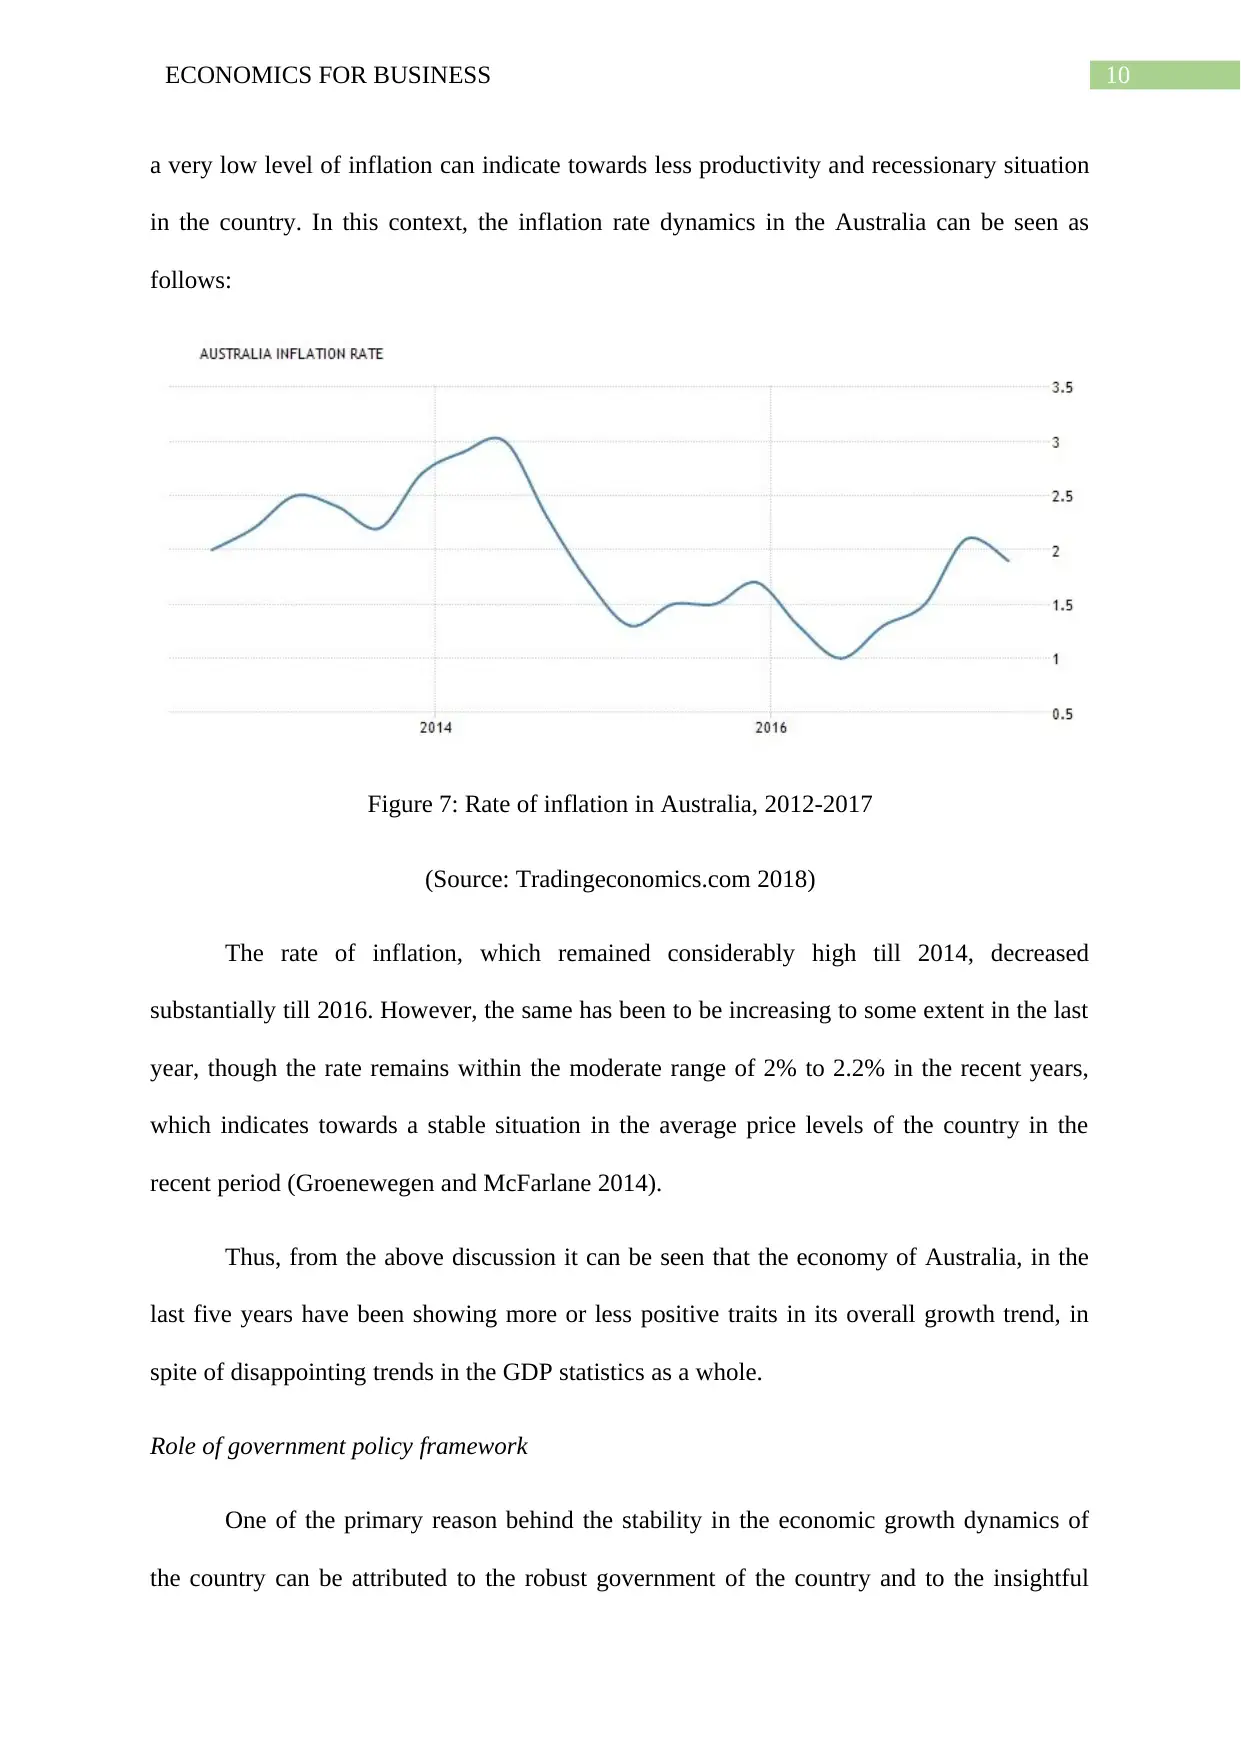
a very low level of inflation can indicate towards less productivity and recessionary situation
in the country. In this context, the inflation rate dynamics in the Australia can be seen as
follows:
Figure 7: Rate of inflation in Australia, 2012-2017
(Source: Tradingeconomics.com 2018)
The rate of inflation, which remained considerably high till 2014, decreased
substantially till 2016. However, the same has been to be increasing to some extent in the last
year, though the rate remains within the moderate range of 2% to 2.2% in the recent years,
which indicates towards a stable situation in the average price levels of the country in the
recent period (Groenewegen and McFarlane 2014).
Thus, from the above discussion it can be seen that the economy of Australia, in the
last five years have been showing more or less positive traits in its overall growth trend, in
spite of disappointing trends in the GDP statistics as a whole.
Role of government policy framework
One of the primary reason behind the stability in the economic growth dynamics of
the country can be attributed to the robust government of the country and to the insightful
11ECONOMICS FOR BUSINESS
economic policy and strategic framework of the country. The main components of the policy
framework of the country can be seen as follows:
Stable economic policies- The fiscal as well as the monetary policies of the country have
inherent stability components in them which enables the country to sail through any
economic crisis and turmoil as can be seen to be evident during the times of the Global
Financial Crisis, which affected nearly all the dominant economies in the world. Australia
however managed to stay stable in this period.
Industrial policies- The policy framework of the country encourages development of
industries and businesses. It plays the dual roles of bringing in foreign investors in the
country and also of protecting the indigenous developing businesses by protecting and
financially aiding them so that they can expand and become profitable (Fenna 2013).
Employment generation- The policy framework of the country focusses in creating new
employment scopes, which is evident from the increase in the employment scopes by 300,000
new jobs, in the country in the last few years, which in turn also contributes to the high
standard of living of the general population in the country (Corden 2012).
Deficit financing strategy- Australian economic policy has a strong deficit-financing and exit
strategy and holds the deficit growth to 2% till surplus is generated.
Industrial Situation of the country (2012-2017)
The robust economic development of Australia can also be attributed to the
prospering industrial and commercial aspects of the country, which have developed over
decades. However, in the last few years, the industrial sector of Australia has been
experiencing a shift from a booming manufacturing and basic industrial sector to an
expanding service sector in the country over the last few years (Hakansson 2015).
⊘ This is a preview!⊘
Do you want full access?
Subscribe today to unlock all pages.
Trusted by 1+ million students worldwide
1 out of 17
Related Documents


Your All-in-One AI-Powered Toolkit for Academic Success.
+13062052269
info@desklib.com
Available 24*7 on WhatsApp / Email
![[object Object]](/_next/static/media/star-bottom.7253800d.svg)
Unlock your academic potential
Copyright © 2020–2026 A2Z Services. All Rights Reserved. Developed and managed by ZUCOL.