BUS700 Economics: Evaluating Australia's Macroeconomic Performance
VerifiedAdded on 2024/04/25
|21
|3675
|106
Report
AI Summary
This report provides an in-depth analysis of Australia's macroeconomic performance between 1990 and 2015, utilizing key indicators such as real GDP growth, interest rates, unemployment rate, inflation rate, exchange rates, and net exports. It explores the relationships between real GDP growth and other indicators, providing economic explanations including the impact of monetary and fiscal policies. The report also discusses the relationship between inflation and unemployment rates and identifies the decade with tighter monetary policy. Statistical data, graphs, and trends are used to support the analysis and evaluate the economic condition of Australia, with a short prediction of Australia’s macroeconomic outlook for the next 2 years along with recommendations and conclusion. Desklib is a platform where students can find similar reports and solved assignments.
BUS700 ECONOMICS
Paired-Assignment
Topic: Evaluation of Macroeconomic performance
of Australia
1
Paired-Assignment
Topic: Evaluation of Macroeconomic performance
of Australia
1
Paraphrase This Document
Need a fresh take? Get an instant paraphrase of this document with our AI Paraphraser
Executive Summary
In this report study, the macroeconomic performance of the country Australia in between the
years 1990 to 2015 has been discussed. Moreover, the research has been made in the report in
context of the real performance of Australia in the past years. The report study also highlights
over the statistical data such as graphs, figures and trends showing the real GDP,
unemployment rate and many others of the Australia. Also, the relationship the real GDP as
well as each and every key performance indicators has also been described in the assignment.
The report focuses on all the aspects of the performance indicators of the Australia and
analyses or evaluates it in order to state the economic condition of the country.
2
Contents
Executive Summary...................................................................................................................2
Introduction................................................................................................................................4
Research-based analysis and evaluation of the macroeconomic performance of
Australia1990to 2015 (Two Questions).....................................................................................5
1. Obtain annual data on key macroeconomic indicators: real GDP growth, interest rate (cash
rate), unemployment rate, inflation rate, exchange rate, and net exports (NX).........................5
(2) Critically analyse tables of statistical summaries and graphs of the information obtained in
(1) to answer the following question:.......................................................................................12
a) Discuss the relationship between real GDP growth and each of the other five indicators.
Provide plausible economic explanations, including the impact of monetary policy and
fiscal policy..........................................................................................................................12
b) Discuss the relationship between inflation and unemployment rates. Provide plausible
economic explanations, including the impact of monetary policy and fiscal policy...........13
c) In which decade has monetary policy been tighter? Explain in detail.............................14
d) Write a short prediction of Australia’s macroeconomic outlook for the next 2 years. Is
Australia likely to experience a recession or an expansion?................................................15
Recommendations....................................................................................................................16
Findings....................................................................................................................................17
Conclusion................................................................................................................................18
References................................................................................................................................19
3
⊘ This is a preview!⊘
Do you want full access?
Subscribe today to unlock all pages.
Trusted by 1+ million students worldwide
Introduction
The report study contains the analysis, evaluation and research of the macroeconomics
factors which leads to describing of the Australia’s performance in the past few years. The
facts, figures, graphical or statistical representations are used so as to define the performance
of Australia. For such purpose the various macroeconomics factors such as inflation rate, real
GDP, unemployment rate, exchange rate, and many others have been considered. The
information generated in the report study emphasis over the relationship among the GDP and
indicators and also upon the inflation rate and unemployment rates. Moreover, the monetary
and fiscal policies practiced within the Australia are also identified in order to determine the
performance of the country. The accuracy and reliability of the data is kept at the priority in
the report study and the sources or data is collected from the academic journals, official
websites, authentic articles and others. In the end, the findings of the study have been made
along with the recommendation and conclusion.
4
Paraphrase This Document
Need a fresh take? Get an instant paraphrase of this document with our AI Paraphraser
Research-based analysis and evaluation of the macroeconomic performance of
Australia1990to 2015 (Two Questions)
1. Obtain annual data on key macroeconomic indicators: real GDP growth, interest rate
(cash rate), unemployment rate, inflation rate, exchange rate, and net exports (NX).
Key Macro-Economic Indicator – According to the views and thoughts of the author Smith
(2018), it reflects over the historical performance of the economy and also records of the
changes which are taking place in the economy over the past years. The economic trends as
well as pattern has been analysed in the indicator. It estimates over the long-term trends and
analysis of data. The economic changes occurring over certain time period is been reflected
in the indicator. This covers the changes taking place among the GDP, unemployment rate,
income and wages, consumer price index, interest rates, balance of trade and many others
(Smith, 2018).
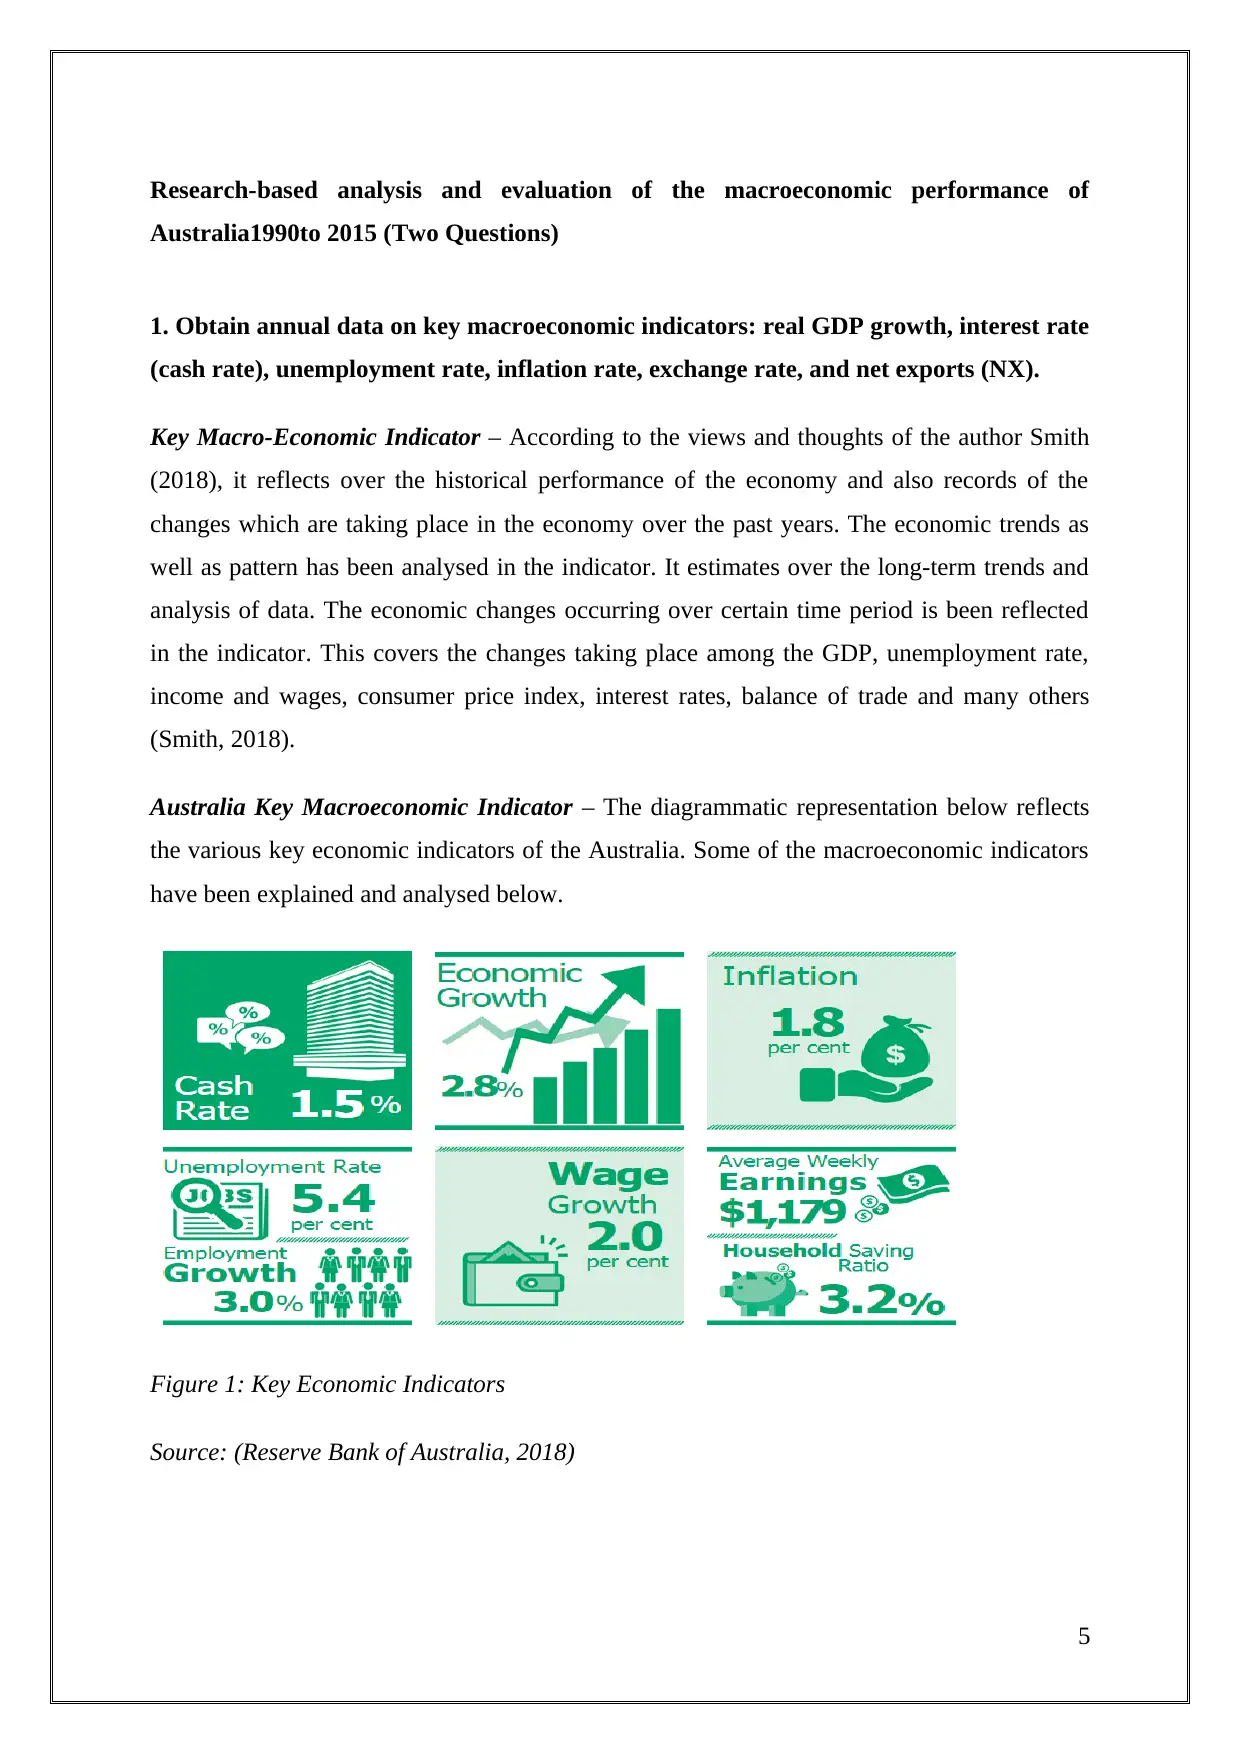
Australia Key Macroeconomic Indicator – The diagrammatic representation below reflects
the various key economic indicators of the Australia. Some of the macroeconomic indicators
have been explained and analysed below.
Figure 1: Key Economic Indicators
Source: (Reserve Bank of Australia, 2018)
5
Australia1990to 2015 (Two Questions)
1. Obtain annual data on key macroeconomic indicators: real GDP growth, interest rate
(cash rate), unemployment rate, inflation rate, exchange rate, and net exports (NX).
Key Macro-Economic Indicator – According to the views and thoughts of the author Smith
(2018), it reflects over the historical performance of the economy and also records of the
changes which are taking place in the economy over the past years. The economic trends as
well as pattern has been analysed in the indicator. It estimates over the long-term trends and
analysis of data. The economic changes occurring over certain time period is been reflected
in the indicator. This covers the changes taking place among the GDP, unemployment rate,
income and wages, consumer price index, interest rates, balance of trade and many others
(Smith, 2018).
Australia Key Macroeconomic Indicator – The diagrammatic representation below reflects
the various key economic indicators of the Australia. Some of the macroeconomic indicators
have been explained and analysed below.
Figure 1: Key Economic Indicators
Source: (Reserve Bank of Australia, 2018)
5
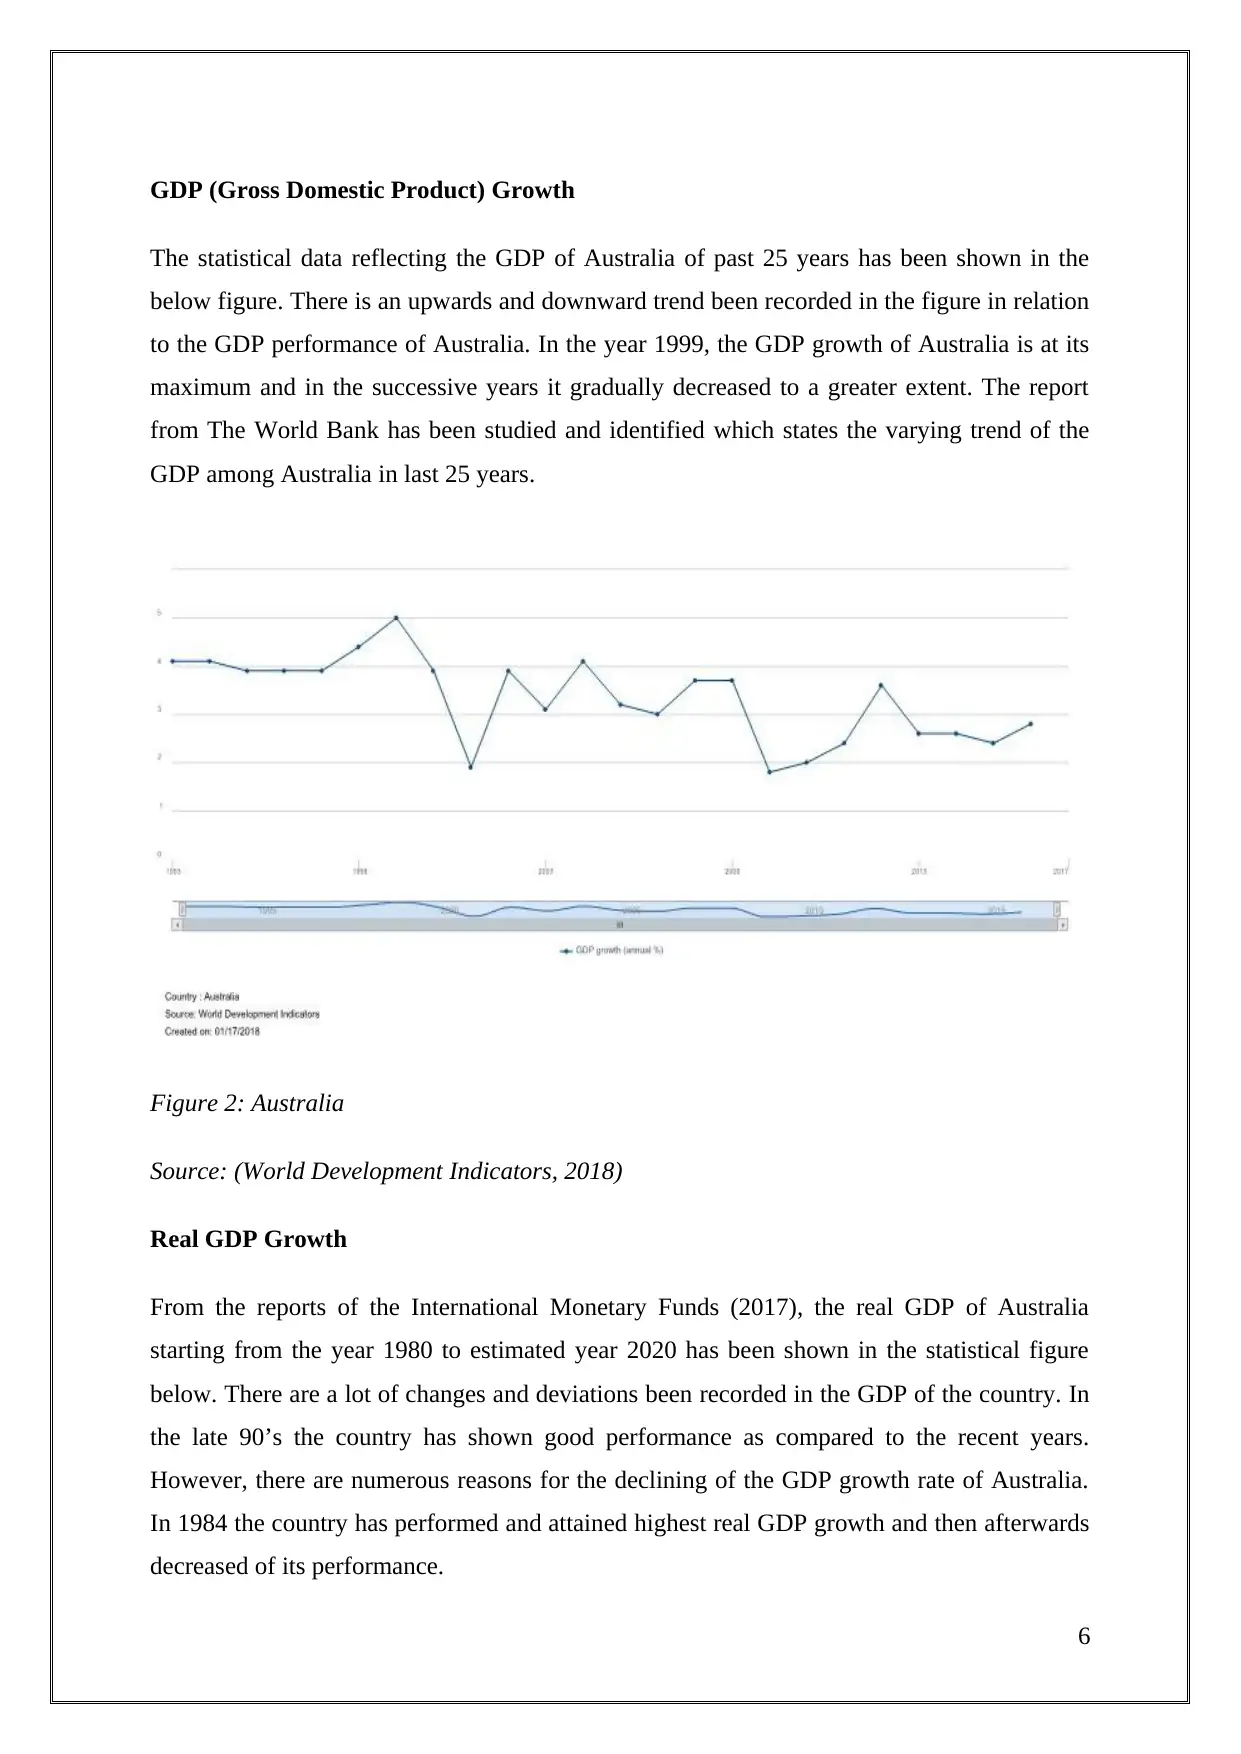
GDP (Gross Domestic Product) Growth
The statistical data reflecting the GDP of Australia of past 25 years has been shown in the
below figure. There is an upwards and downward trend been recorded in the figure in relation
to the GDP performance of Australia. In the year 1999, the GDP growth of Australia is at its
maximum and in the successive years it gradually decreased to a greater extent. The report
from The World Bank has been studied and identified which states the varying trend of the
GDP among Australia in last 25 years.
Figure 2: Australia
Source: (World Development Indicators, 2018)
Real GDP Growth
From the reports of the International Monetary Funds (2017), the real GDP of Australia
starting from the year 1980 to estimated year 2020 has been shown in the statistical figure
below. There are a lot of changes and deviations been recorded in the GDP of the country. In
the late 90’s the country has shown good performance as compared to the recent years.
However, there are numerous reasons for the declining of the GDP growth rate of Australia.
In 1984 the country has performed and attained highest real GDP growth and then afterwards
decreased of its performance.
6
⊘ This is a preview!⊘
Do you want full access?
Subscribe today to unlock all pages.
Trusted by 1+ million students worldwide
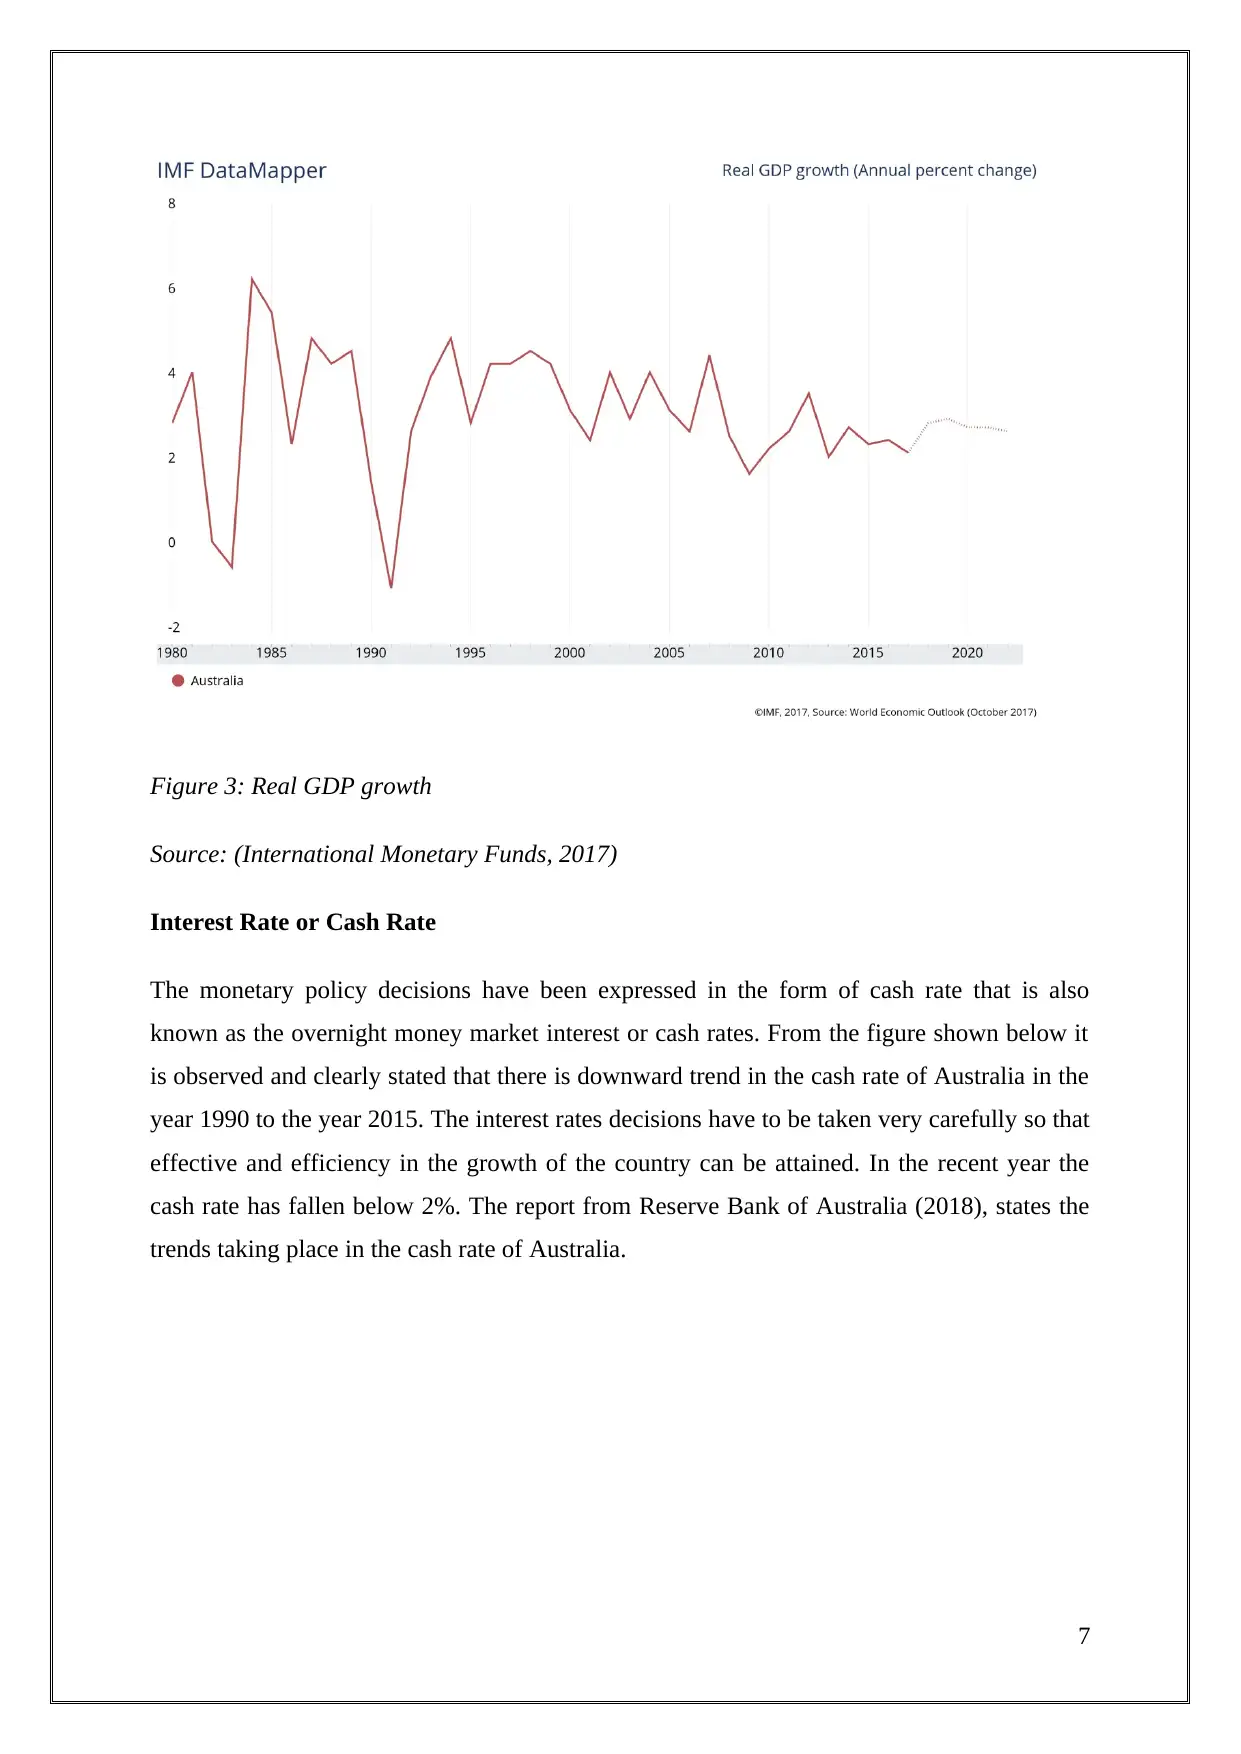
Figure 3: Real GDP growth
Source: (International Monetary Funds, 2017)
Interest Rate or Cash Rate
The monetary policy decisions have been expressed in the form of cash rate that is also
known as the overnight money market interest or cash rates. From the figure shown below it
is observed and clearly stated that there is downward trend in the cash rate of Australia in the
year 1990 to the year 2015. The interest rates decisions have to be taken very carefully so that
effective and efficiency in the growth of the country can be attained. In the recent year the
cash rate has fallen below 2%. The report from Reserve Bank of Australia (2018), states the
trends taking place in the cash rate of Australia.
7
Paraphrase This Document
Need a fresh take? Get an instant paraphrase of this document with our AI Paraphraser
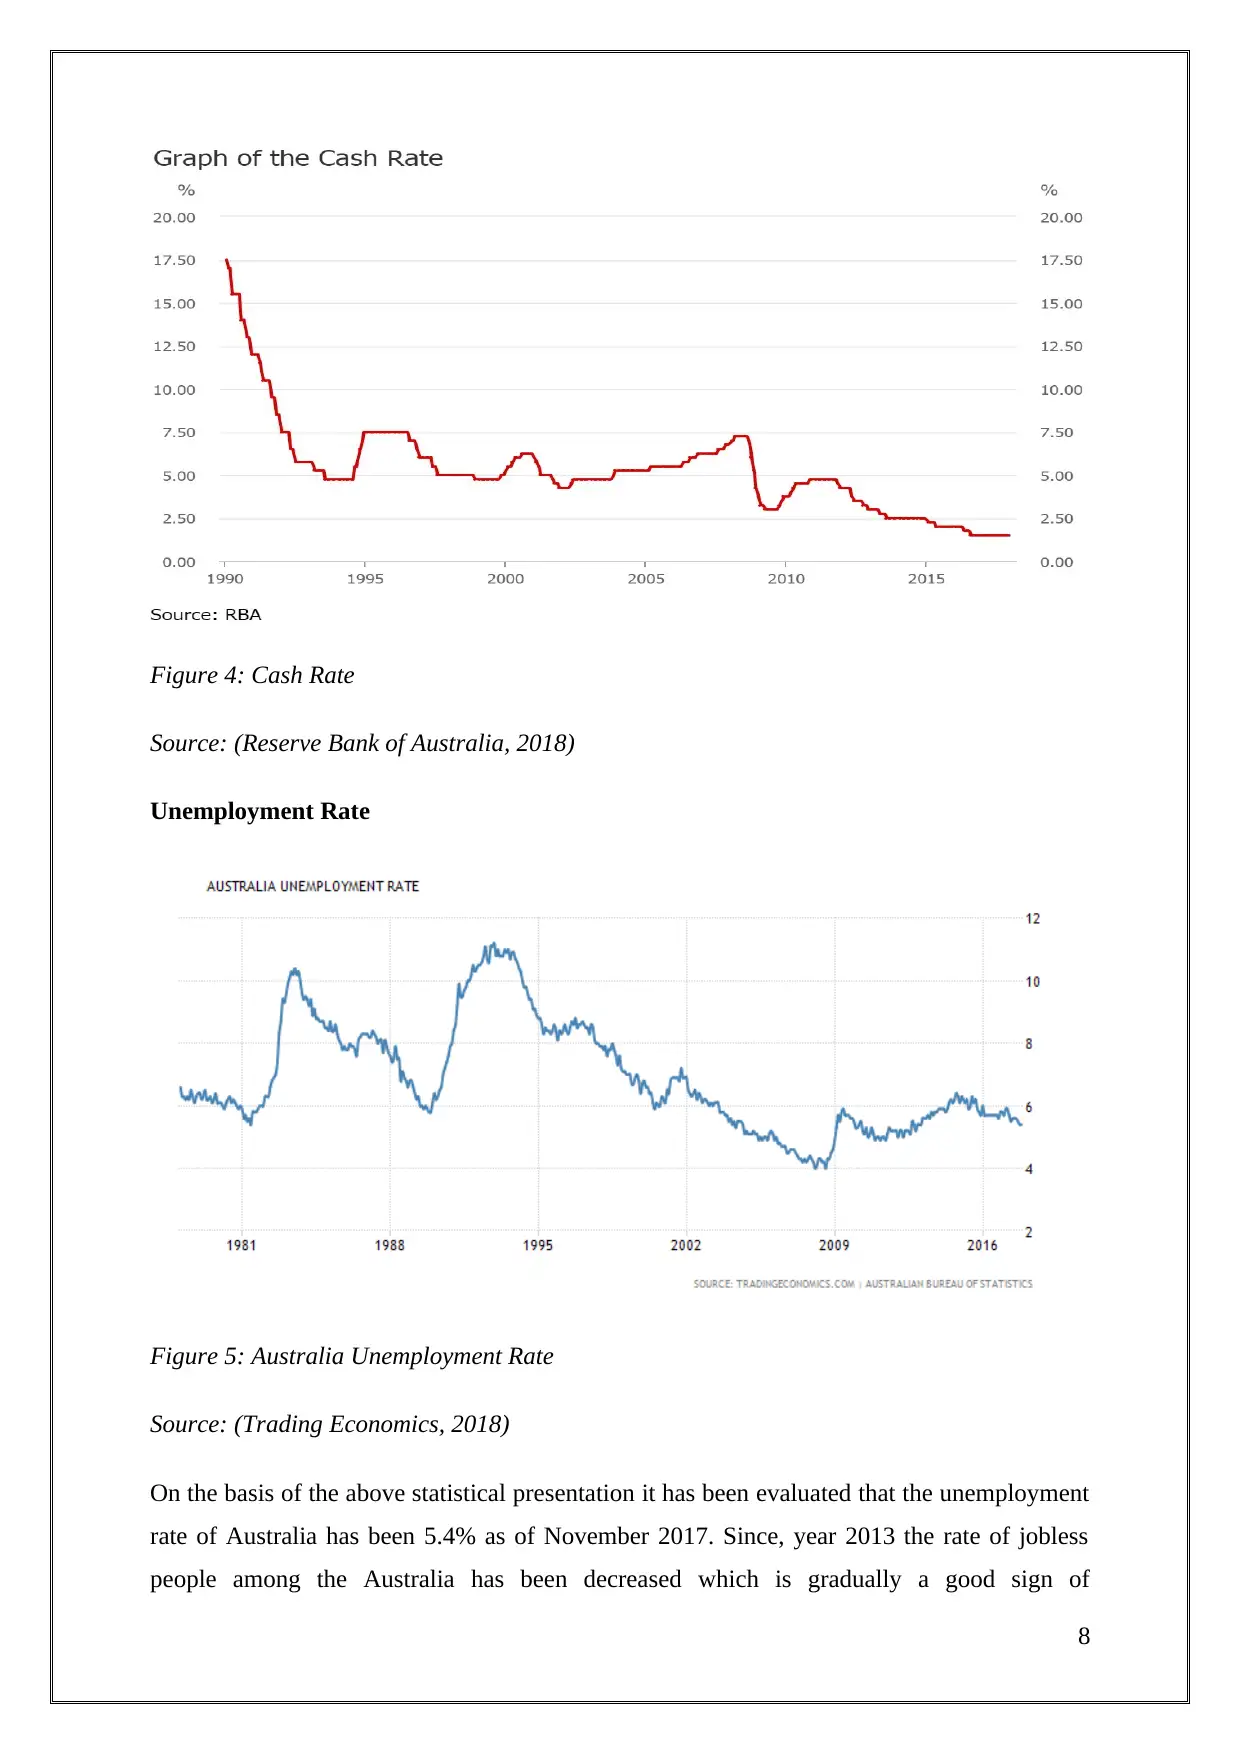
Figure 4: Cash Rate
Source: (Reserve Bank of Australia, 2018)
Unemployment Rate
Figure 5: Australia Unemployment Rate
Source: (Trading Economics, 2018)
On the basis of the above statistical presentation it has been evaluated that the unemployment
rate of Australia has been 5.4% as of November 2017. Since, year 2013 the rate of jobless
people among the Australia has been decreased which is gradually a good sign of
8
improvement and performance. The average rate of unemployment in Australia is amounted
to 6.89% from 1978 to till 2017. In the year 1992 the unemployment rate has reached to its
highest limit and is all time high as compared to the remaining years. From this graphical
presentation it is observed that the Australia is generating good amount of employment
opportunities for its employees and contributing in the welfare of the economy. In addition to
this, the country has recorded of the all-time least unemployment rate of 4% in the year 2008.
Hence, it is analysed that if it continues in the same way the performance of Australia will be
enhanced in the near future.
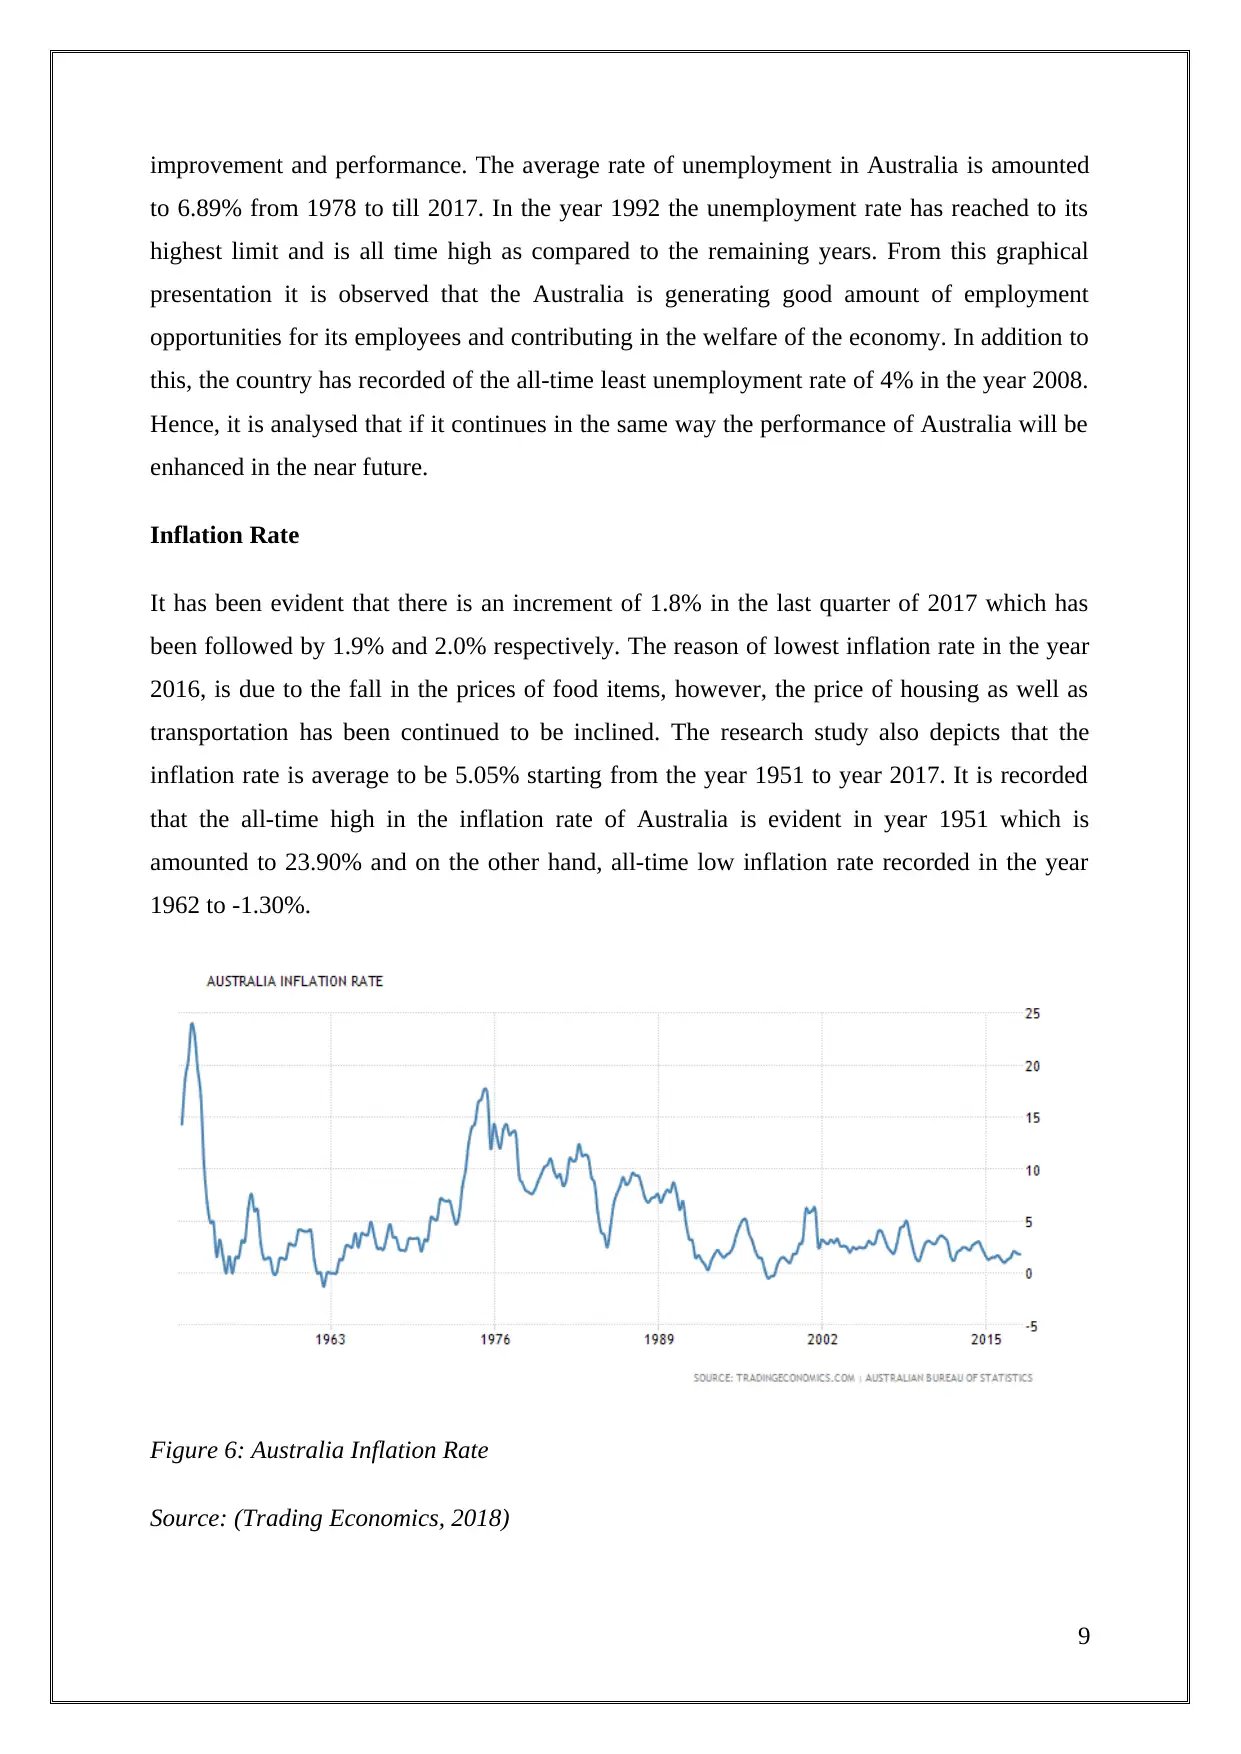
Inflation Rate
It has been evident that there is an increment of 1.8% in the last quarter of 2017 which has
been followed by 1.9% and 2.0% respectively. The reason of lowest inflation rate in the year
2016, is due to the fall in the prices of food items, however, the price of housing as well as
transportation has been continued to be inclined. The research study also depicts that the
inflation rate is average to be 5.05% starting from the year 1951 to year 2017. It is recorded
that the all-time high in the inflation rate of Australia is evident in year 1951 which is
amounted to 23.90% and on the other hand, all-time low inflation rate recorded in the year
1962 to -1.30%.
Figure 6: Australia Inflation Rate
Source: (Trading Economics, 2018)
9
to 6.89% from 1978 to till 2017. In the year 1992 the unemployment rate has reached to its
highest limit and is all time high as compared to the remaining years. From this graphical
presentation it is observed that the Australia is generating good amount of employment
opportunities for its employees and contributing in the welfare of the economy. In addition to
this, the country has recorded of the all-time least unemployment rate of 4% in the year 2008.
Hence, it is analysed that if it continues in the same way the performance of Australia will be
enhanced in the near future.
Inflation Rate
It has been evident that there is an increment of 1.8% in the last quarter of 2017 which has
been followed by 1.9% and 2.0% respectively. The reason of lowest inflation rate in the year
2016, is due to the fall in the prices of food items, however, the price of housing as well as
transportation has been continued to be inclined. The research study also depicts that the
inflation rate is average to be 5.05% starting from the year 1951 to year 2017. It is recorded
that the all-time high in the inflation rate of Australia is evident in year 1951 which is
amounted to 23.90% and on the other hand, all-time low inflation rate recorded in the year
1962 to -1.30%.
Figure 6: Australia Inflation Rate
Source: (Trading Economics, 2018)
9
⊘ This is a preview!⊘
Do you want full access?
Subscribe today to unlock all pages.
Trusted by 1+ million students worldwide
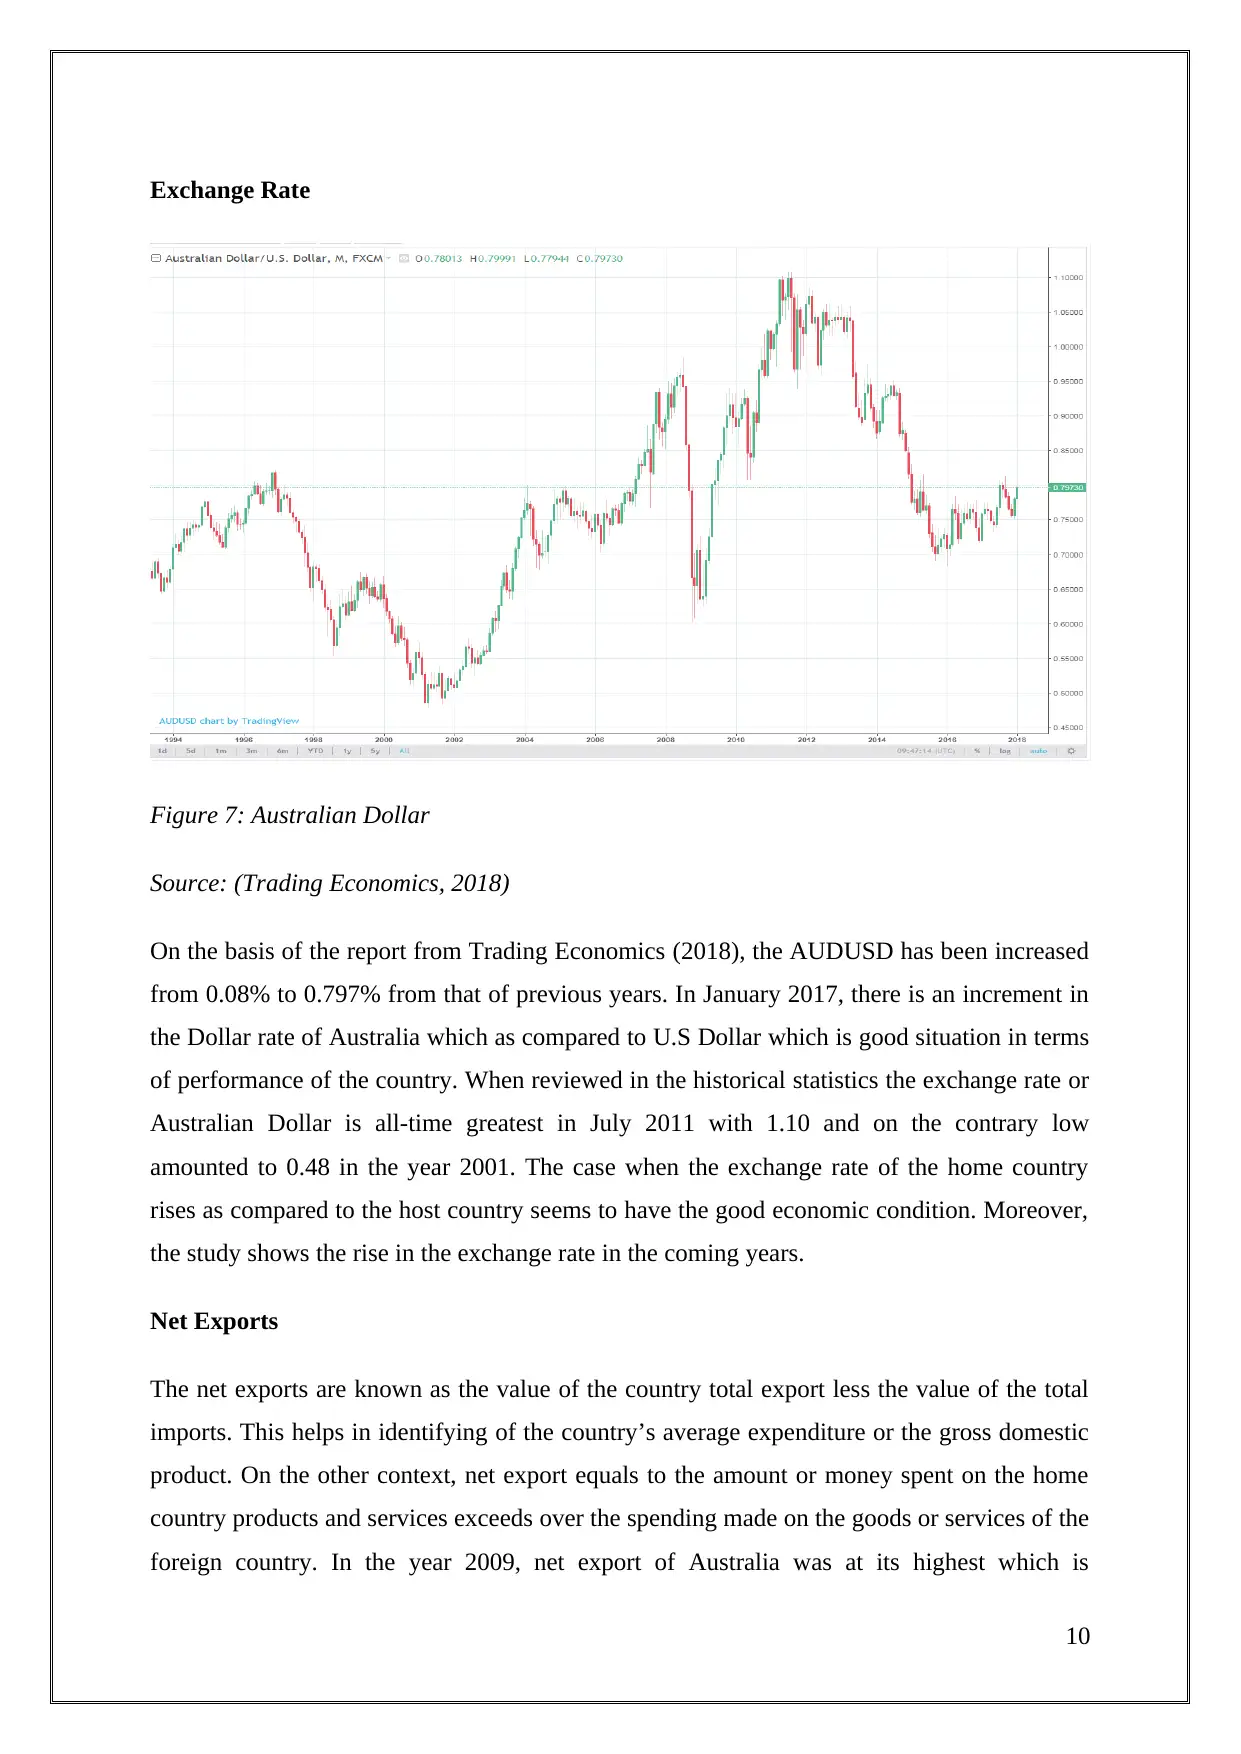
Exchange Rate
Figure 7: Australian Dollar
Source: (Trading Economics, 2018)
On the basis of the report from Trading Economics (2018), the AUDUSD has been increased
from 0.08% to 0.797% from that of previous years. In January 2017, there is an increment in
the Dollar rate of Australia which as compared to U.S Dollar which is good situation in terms
of performance of the country. When reviewed in the historical statistics the exchange rate or
Australian Dollar is all-time greatest in July 2011 with 1.10 and on the contrary low
amounted to 0.48 in the year 2001. The case when the exchange rate of the home country
rises as compared to the host country seems to have the good economic condition. Moreover,
the study shows the rise in the exchange rate in the coming years.
Net Exports
The net exports are known as the value of the country total export less the value of the total
imports. This helps in identifying of the country’s average expenditure or the gross domestic
product. On the other context, net export equals to the amount or money spent on the home
country products and services exceeds over the spending made on the goods or services of the
foreign country. In the year 2009, net export of Australia was at its highest which is
10
Paraphrase This Document
Need a fresh take? Get an instant paraphrase of this document with our AI Paraphraser
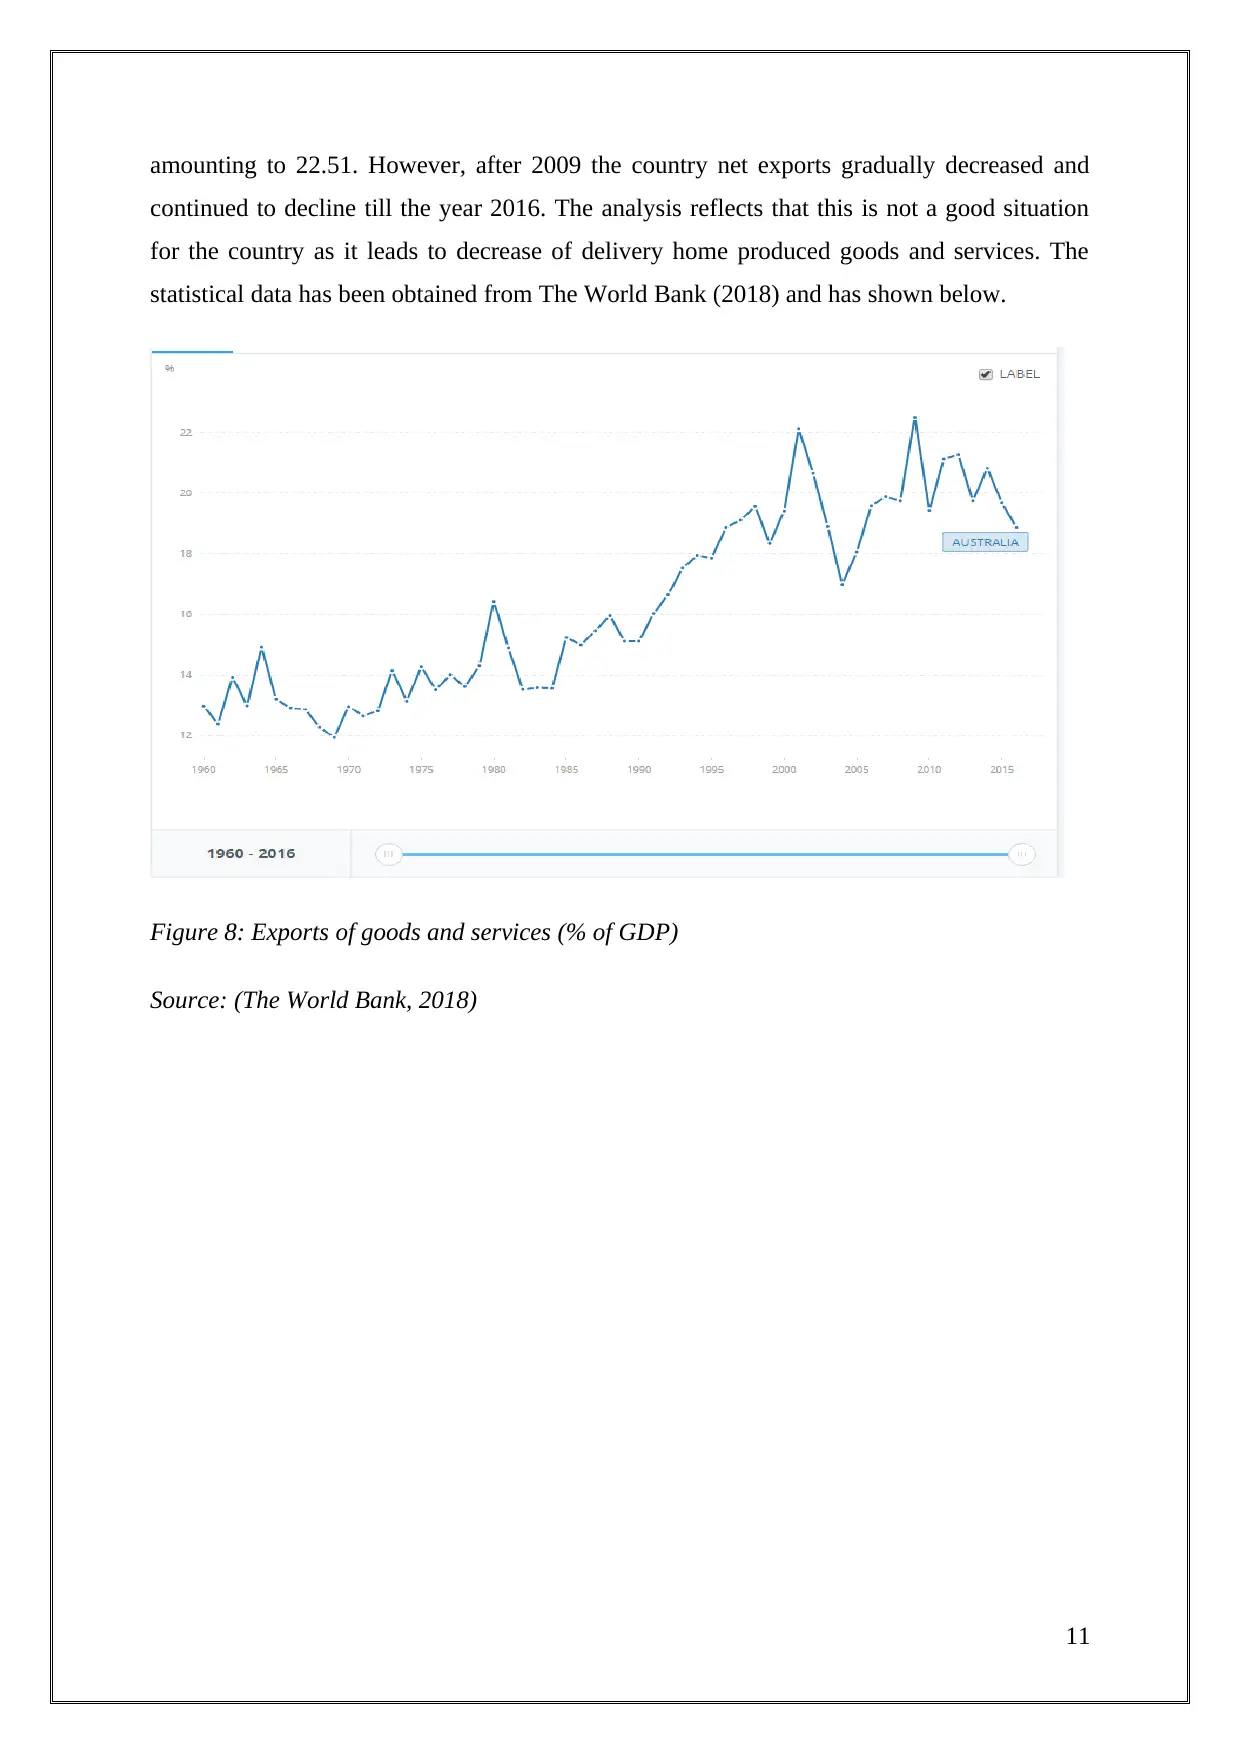
amounting to 22.51. However, after 2009 the country net exports gradually decreased and
continued to decline till the year 2016. The analysis reflects that this is not a good situation
for the country as it leads to decrease of delivery home produced goods and services. The
statistical data has been obtained from The World Bank (2018) and has shown below.
Figure 8: Exports of goods and services (% of GDP)
Source: (The World Bank, 2018)
11
(2) Critically analyse tables of statistical summaries and graphs of the information
obtained in (1) to answer the following question:
a) Discuss the relationship between real GDP growth and each of the other five
indicators. Provide plausible economic explanations, including the impact of monetary
policy and fiscal policy.
Along with GDP the other five macroeconomic indicators are interest rate, unemployment
rate, inflation rate, exchange rate, and net exports. All the five indicators are believed to have
a relationship with real GDP as GDP is constituted of production made and revenue earned
by the country that helps to make an easy differentiation between the economic conditions of
the country. From the graphs mentioned above, it can be depicted that GDP have a direct
relationship with the interest rates as with the rise in GDP the interest rates are to be
increased so that flow of money could be lower down and on the other hand at the time of
falling GDP the interest rates are to be lower down so that flow of money in the market can
be accelerated and productivity can be increased (Semuel & Nurina, 2014). The imposition of
interest rate is a part of monetary policy and shows to have a direct impact over the economic
condition.
The increasing GDP of Australia shows its increasing productivity in the years near to 1995
that results in generation of more employment opportunities that made the unemployment
rates fallen down. The same can be witnessed in year 2015 when the GDP raise results in fall
of unemployment rate because with the growing production capacity the chances of
expansion are higher that generates employment opportunities. Further with the increasing
GDP, the employment opportunities will be created that result in increasing purchasing
power of the public. The increasing purchasing power emerges as more demand and less
supply that result in rising price of the products and services. Thus GDP is considered to have
relationship with inflation (Ramlan & Suhaimi, 2017).
The rise in real GDP is assumed as an increase in production units of the country similarly in
Australia with the rise in production of products and services the bulk left after meeting the
residential demand will be sold to other countries that is termed as export process. The
exports do not increased in Australia because the increasing production got consumed in the
country itself as the purchasing power and demand of public gets increased. Thus the direct
relationship is depended on the stated expectation above. The last indicator is exchange rate
12
⊘ This is a preview!⊘
Do you want full access?
Subscribe today to unlock all pages.
Trusted by 1+ million students worldwide
1 out of 21
Related Documents


Your All-in-One AI-Powered Toolkit for Academic Success.
+13062052269
info@desklib.com
Available 24*7 on WhatsApp / Email
![[object Object]](/_next/static/media/star-bottom.7253800d.svg)
Unlock your academic potential
Copyright © 2020–2026 A2Z Services. All Rights Reserved. Developed and managed by ZUCOL.