Economics for Business: Australian Economy Analysis Report
VerifiedAdded on  2021/05/30
|13
|1585
|60
Report
AI Summary
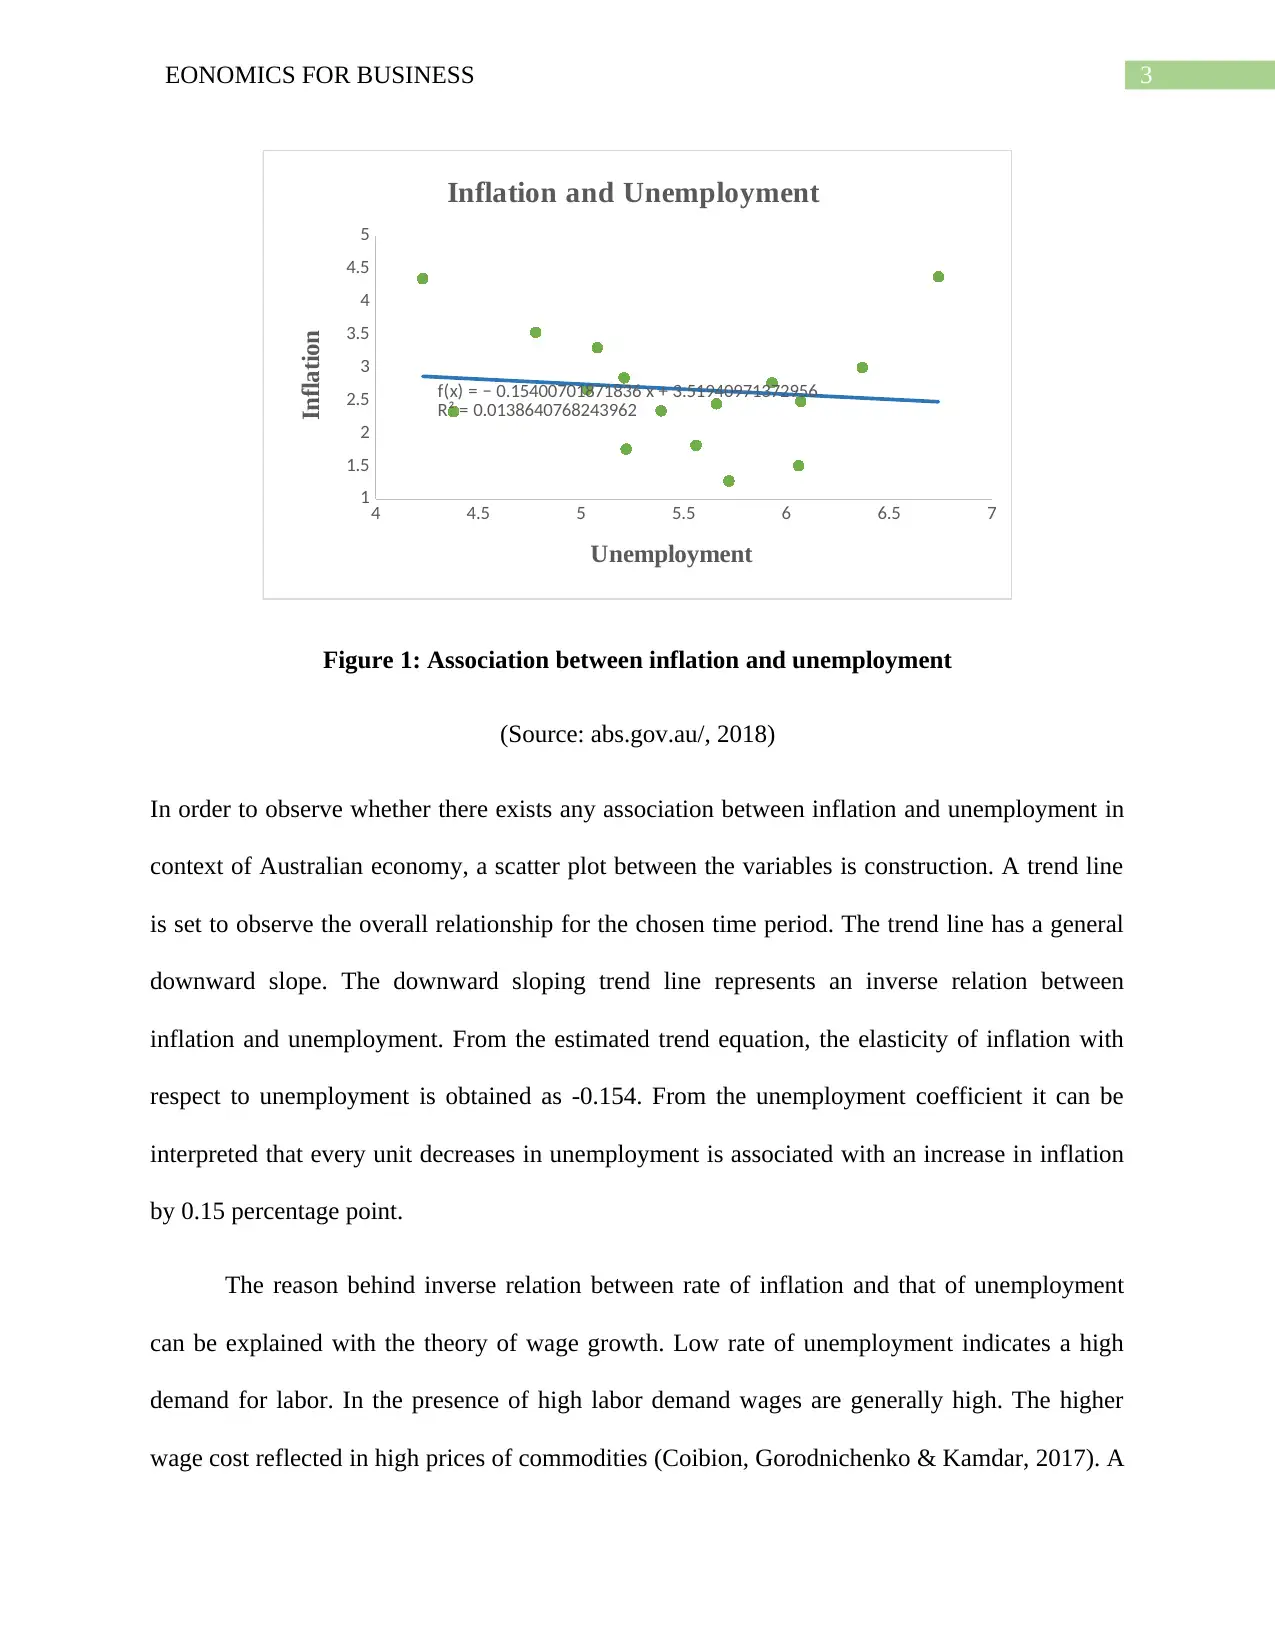
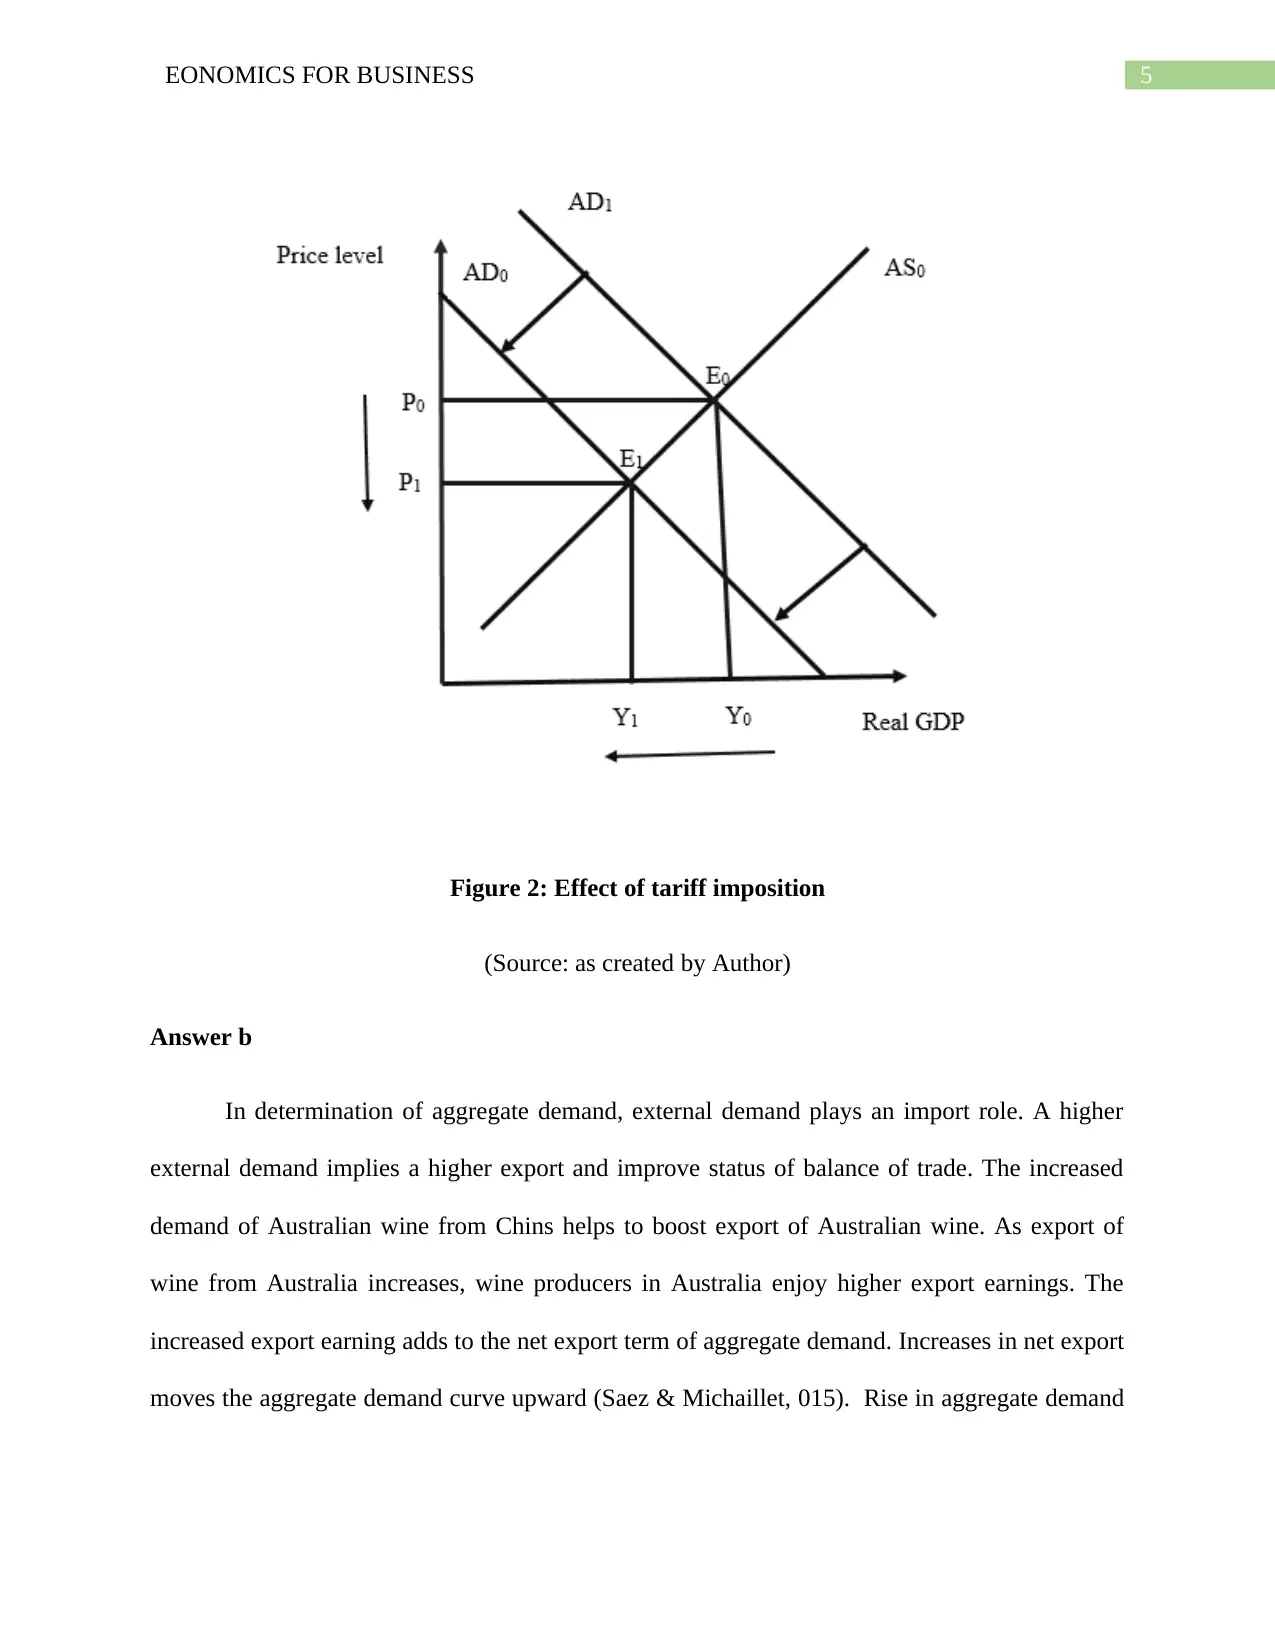
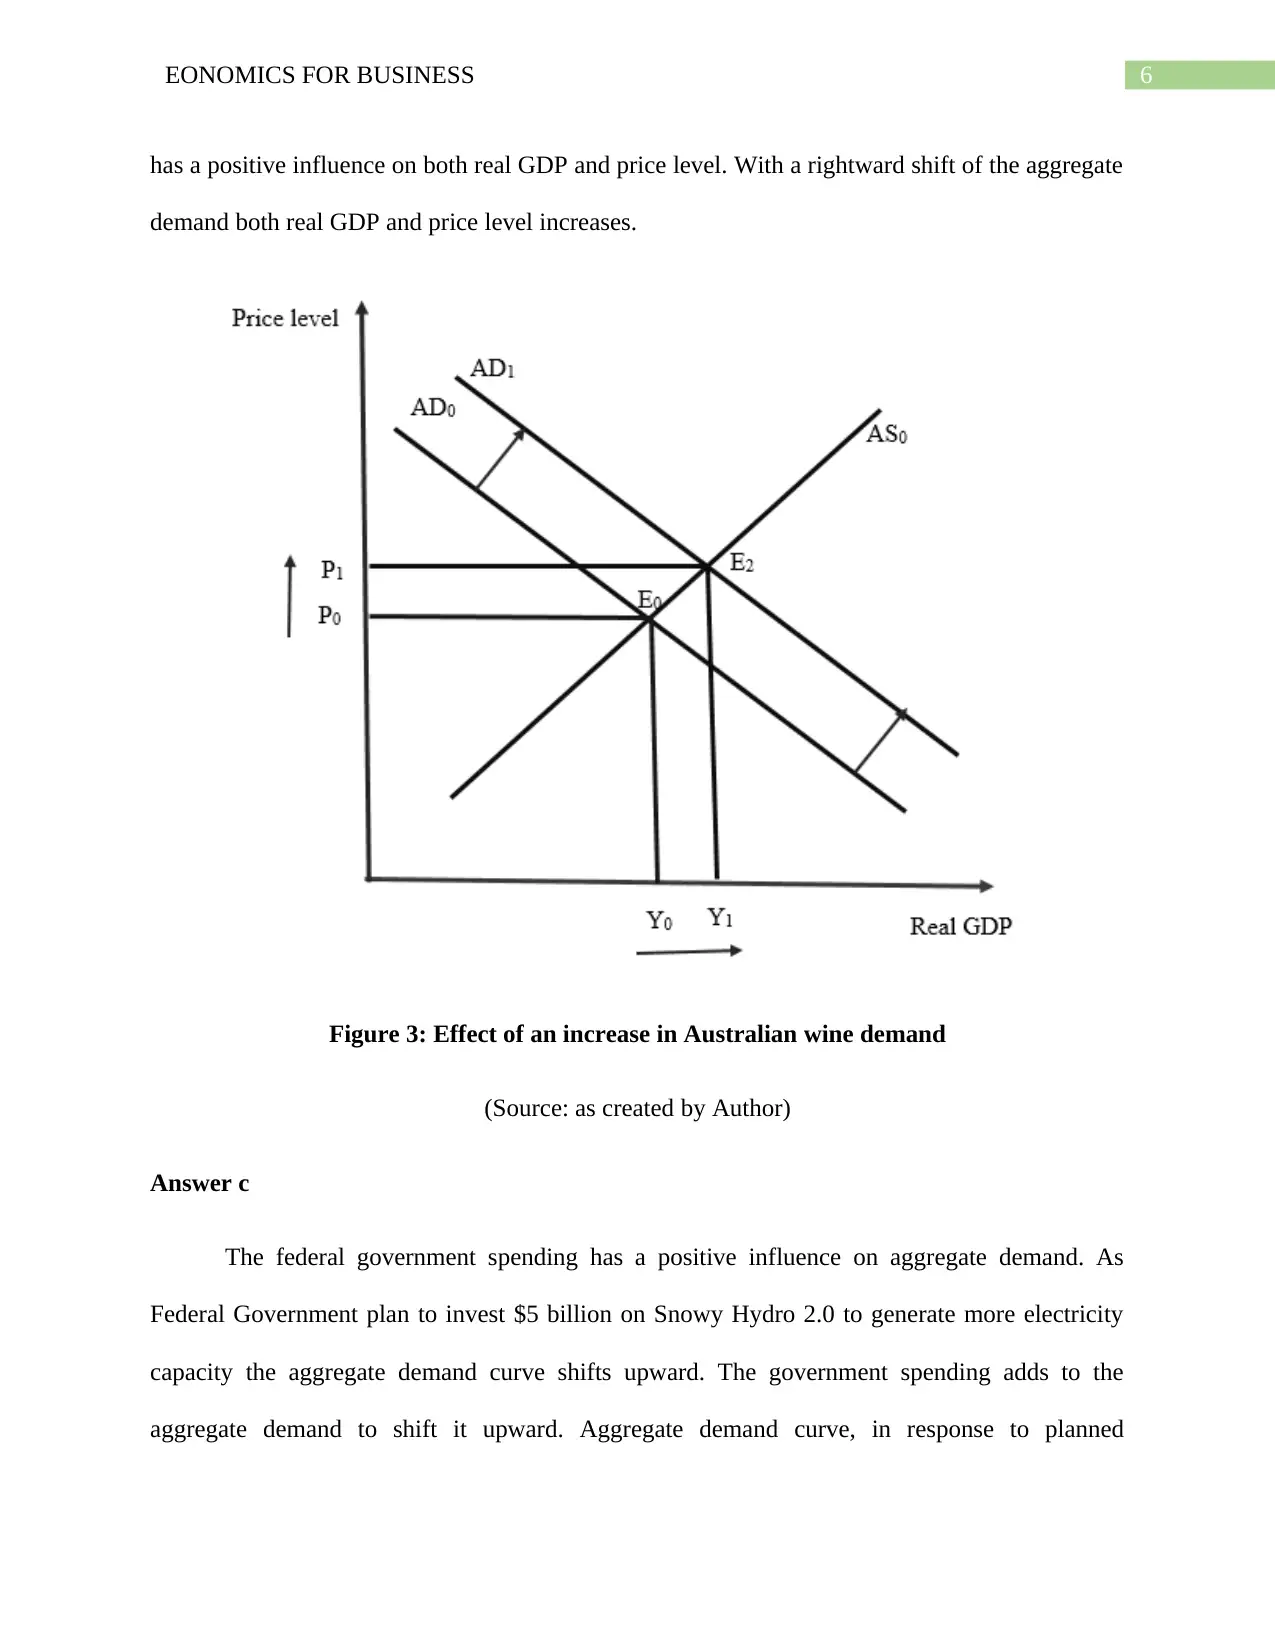
This report provides an analysis of the Australian economy, focusing on key macroeconomic indicators and their interrelationships. It begins by examining the Phillips curve, exploring the inverse relationship between inflation and unemployment, and uses data from 1961-2016 to illustrate this relationship. The report then analyzes the impact of various factors on aggregate demand, including tariffs on chickpea exports, increased demand for Australian wine from China, federal government spending on infrastructure projects, and fluctuations in oil prices. Additionally, the report assesses how immigration intake affects aggregate supply, real GDP, and price levels. The analysis is supported by relevant figures and references to economic literature.
Contribute Materials
Your contribution can guide someone’s learning journey. Share your
documents today.

Running Head: EONOMICS FOR BUSINESS
Eonomics for Business
Name of the Student
Name of the University
Course ID
Eonomics for Business
Name of the Student
Name of the University
Course ID
Secure Best Marks with AI Grader
Need help grading? Try our AI Grader for instant feedback on your assignments.

1EONOMICS FOR BUSINESS
Table of Contents
Answer 1..........................................................................................................................................2
Answer 2..........................................................................................................................................4
Answer a......................................................................................................................................4
Answer b......................................................................................................................................5
Answer c......................................................................................................................................6
Answer d......................................................................................................................................7
Answer e......................................................................................................................................9
List of references...........................................................................................................................11

2EONOMICS FOR BUSINESS
Answer 1
In determining overall performance of an economy, focus needs to be given on
movement of price level and performance of labor market. The commonly used indicator for
measuring performance of the labor market in unemployment. The rate of unemployment in an
economy presents the number of unemployed person as a percentage of total labor force.
Inflation on the other hand measures the gradual upward movement of price level (Chan, Koop
& Potter, 2016). Rate of inflation is generally measured from percentage change in cost of living
index between two consecutive years. Inflation and unemployment though belongs to different
area of macroeconomic aspect; an association is often observed between these two. Rate of
unemployment influences the price level through influencing wage growth. An inverse
relationship is found to exists between condition of price level and that of the performance of
labor market. The relationship was first discovered by A.W.Phillips based on macroeconomic
data of UK economy (Daly & Hobijn, 2014). Phillips proposed a hypothesis that inflation goes
up with a decline in the rate of unemployment. The price level moves in reverse direction in
times of rising unemployment. The proposed association between unemployment and inflation is
verified using inflation and unemployment data of Australia from 1961-2016.

3EONOMICS FOR BUSINESS
4 4.5 5 5.5 6 6.5 7
1
1.5
2
2.5
3
3.5
4
4.5
5
f(x) = − 0.15400701871836 x + 3.51940971372956
R² = 0.0138640768243962
Inflation and Unemployment
Unemployment
Inflation
Figure 1: Association between inflation and unemployment
(Source: abs.gov.au/, 2018)
In order to observe whether there exists any association between inflation and unemployment in
context of Australian economy, a scatter plot between the variables is construction. A trend line
is set to observe the overall relationship for the chosen time period. The trend line has a general
downward slope. The downward sloping trend line represents an inverse relation between
inflation and unemployment. From the estimated trend equation, the elasticity of inflation with
respect to unemployment is obtained as -0.154. From the unemployment coefficient it can be
interpreted that every unit decreases in unemployment is associated with an increase in inflation
by 0.15 percentage point.
The reason behind inverse relation between rate of inflation and that of unemployment
can be explained with the theory of wage growth. Low rate of unemployment indicates a high
demand for labor. In the presence of high labor demand wages are generally high. The higher
wage cost reflected in high prices of commodities (Coibion, Gorodnichenko & Kamdar, 2017). A
Secure Best Marks with AI Grader
Need help grading? Try our AI Grader for instant feedback on your assignments.

4EONOMICS FOR BUSINESS
low labor demand on the other hand is associated with a high unemployment rate. With lack of
demand, wages in the labor market fall. Workers are ready to accept low wages during this time.
This lowers the cost of production and hence a lower price of commodities.
The trade-off between inflation and unemployment though hold in the short run but
relation can break down in the long run. In the long run the economy reaches to the level of
unemployment called natural rate of unemployment and therefore, Phillips relation does not
hold. Trade-off between inflation and unemployment has implication for policy framework
(Malikane, 2014). Policies to reduce unemployment can result in a high inflation. In Australia,
RBA uses active monetary policy tool to keep inflation at a low level along with a low rate of
unemployment.
Answer 2
Answer a
Tariff is a form of tax on import and hence, have an adverse effect on import demand.
When India places a 30% tariff on chickpea export from Australia then price of exported
chickpea from Australia experienced a price gain in Indian market. The tariff encouraged
domestic producer of India to produce more chickpea and discourage Indian consumers to
consume imported chickpea from Australia. The decrease is export volume of Australian
Chickpea hurt the export revenue worsening trade balance or net export (Riccetti, Russo &
Gallegati, 2017). The net export fall, there is downward pressure on aggregate demand. As AD
shifts downward, real GDP and price level both mark a downward movement.

5EONOMICS FOR BUSINESS
Figure 2: Effect of tariff imposition
(Source: as created by Author)
Answer b
In determination of aggregate demand, external demand plays an import role. A higher
external demand implies a higher export and improve status of balance of trade. The increased
demand of Australian wine from Chins helps to boost export of Australian wine. As export of
wine from Australia increases, wine producers in Australia enjoy higher export earnings. The
increased export earning adds to the net export term of aggregate demand. Increases in net export
moves the aggregate demand curve upward (Saez & Michaillet, 015). Rise in aggregate demand

6EONOMICS FOR BUSINESS
has a positive influence on both real GDP and price level. With a rightward shift of the aggregate
demand both real GDP and price level increases.
Figure 3: Effect of an increase in Australian wine demand
(Source: as created by Author)
Answer c
The federal government spending has a positive influence on aggregate demand. As
Federal Government plan to invest $5 billion on Snowy Hydro 2.0 to generate more electricity
capacity the aggregate demand curve shifts upward. The government spending adds to the
aggregate demand to shift it upward. Aggregate demand curve, in response to planned
Paraphrase This Document
Need a fresh take? Get an instant paraphrase of this document with our AI Paraphraser

7EONOMICS FOR BUSINESS
government spending shifts from AD0 to AD1. Expansion in aggregate demand leads to an
overall expansion of Australian economy with an increases in real GDP and price level (Miller &
Benjamin, 2017).
Answer d
Australia is a primary importer of oil. The fluctuation in oil price therefore has a great
implication of Australian trade balance. As oil price falls, Australia now faces a lower price if
imported oil. The decline in import cost in turn means an increase in net export and hence a
higher aggregate demand. There is however another channel through which oil price can affect
real GDP and price level in Australia. As oil is used in many industries as a major input, a lower
oil price means a lower cost of production (Riccetti, Russo & Gallegati, 2017). This leads to an
increase in aggregate supply. Higher aggregate demand and aggregate supply both mark an
increase in real GDP. The effect on price level however depends on the strength of demand and
supply forces.

8EONOMICS FOR BUSINESS
Figure 5: Change in AS exceeds that in AD
(Source: as created by Author)
Figure 5: Change in AS exceeds that in AD
(Source: as created by Author)

9EONOMICS FOR BUSINESS
Figure 6: Change in AD exceeds that in AS
(Source: as created by Author)
Figure 6: Change in AD exceeds that in AS
(Source: as created by Author)
Secure Best Marks with AI Grader
Need help grading? Try our AI Grader for instant feedback on your assignments.

10EONOMICS FOR BUSINESS
Figure 6: Change in AD is same as that in AS
(Source: as created by Author)
Answer e
The increase in immigration intake increases the supply of available labor in the labor
market. A higher supply in the labor market causes a decline in wage rate. This creates an
advantageous condition for producers in Australia. They now have an abundant labor input at a
lower cost. The low cost and increased supply of labor contribute to an increase in aggregate
supply (Saez & Michaillet, 2015). The aggregate supply curve shifts from AS0 to AS1 causing
real GDP to rise to Y1 while price level falls to P1.

11EONOMICS FOR BUSINESS
Figure 8: Effect of an increase immigration intake
(Source: as created by Author)
Figure 8: Effect of an increase immigration intake
(Source: as created by Author)

12EONOMICS FOR BUSINESS
List of references
6202.0 - Labour Force, Australia, Mar 2018. (2018). Retrieved from
http://www.abs.gov.au/ausstats/abs@.nsf/mf/6202.0?opendocument&ref=HPKI
Chan, J. C., Koop, G., & Potter, S. M. (2016). A bounded model of time variation in trend
inflation, NAIRU and the Phillips curve. Journal of Applied Econometrics, 31(3), 551-
565.
Coibion, O., Gorodnichenko, Y., & Kamdar, R. (2017). The Formation of Expectations, Inflation
and the Phillips Curve(No. w23304). National Bureau of Economic Research.
Daly, M. C., & Hobijn, B. (2014). Downward nominal wage rigidities bend the Phillips
curve. Journal of Money, Credit and Banking, 46(S2), 51-93.
Malikane, C. (2014). A new Keynesian triangle Phillips curve. Economic Modelling, 43, 247-
255.
Miller, R. L., & Benjamin, D. K. (2017). Economics of macro issues. Pearson.
Riccetti, L., Russo, A., & Gallegati, M. (2017). AD-AS Representation of Macroeconomic
Emergent Properties. In Introduction to Agent-Based Economics (pp. 65-86).
Saez, E., & Michaillet, P. (2015). An Economical Business-Cycle Model. Working Paper.
1 out of 13
Related Documents

Your All-in-One AI-Powered Toolkit for Academic Success.
 +13062052269
info@desklib.com
Available 24*7 on WhatsApp / Email
Unlock your academic potential
© 2024  |  Zucol Services PVT LTD  |  All rights reserved.