Economics for Business: Exploring Economic Concepts and Elasticity

Verified

Added on  2021/04/17

|6
|1489
|24
Homework Assignment
AI Summary
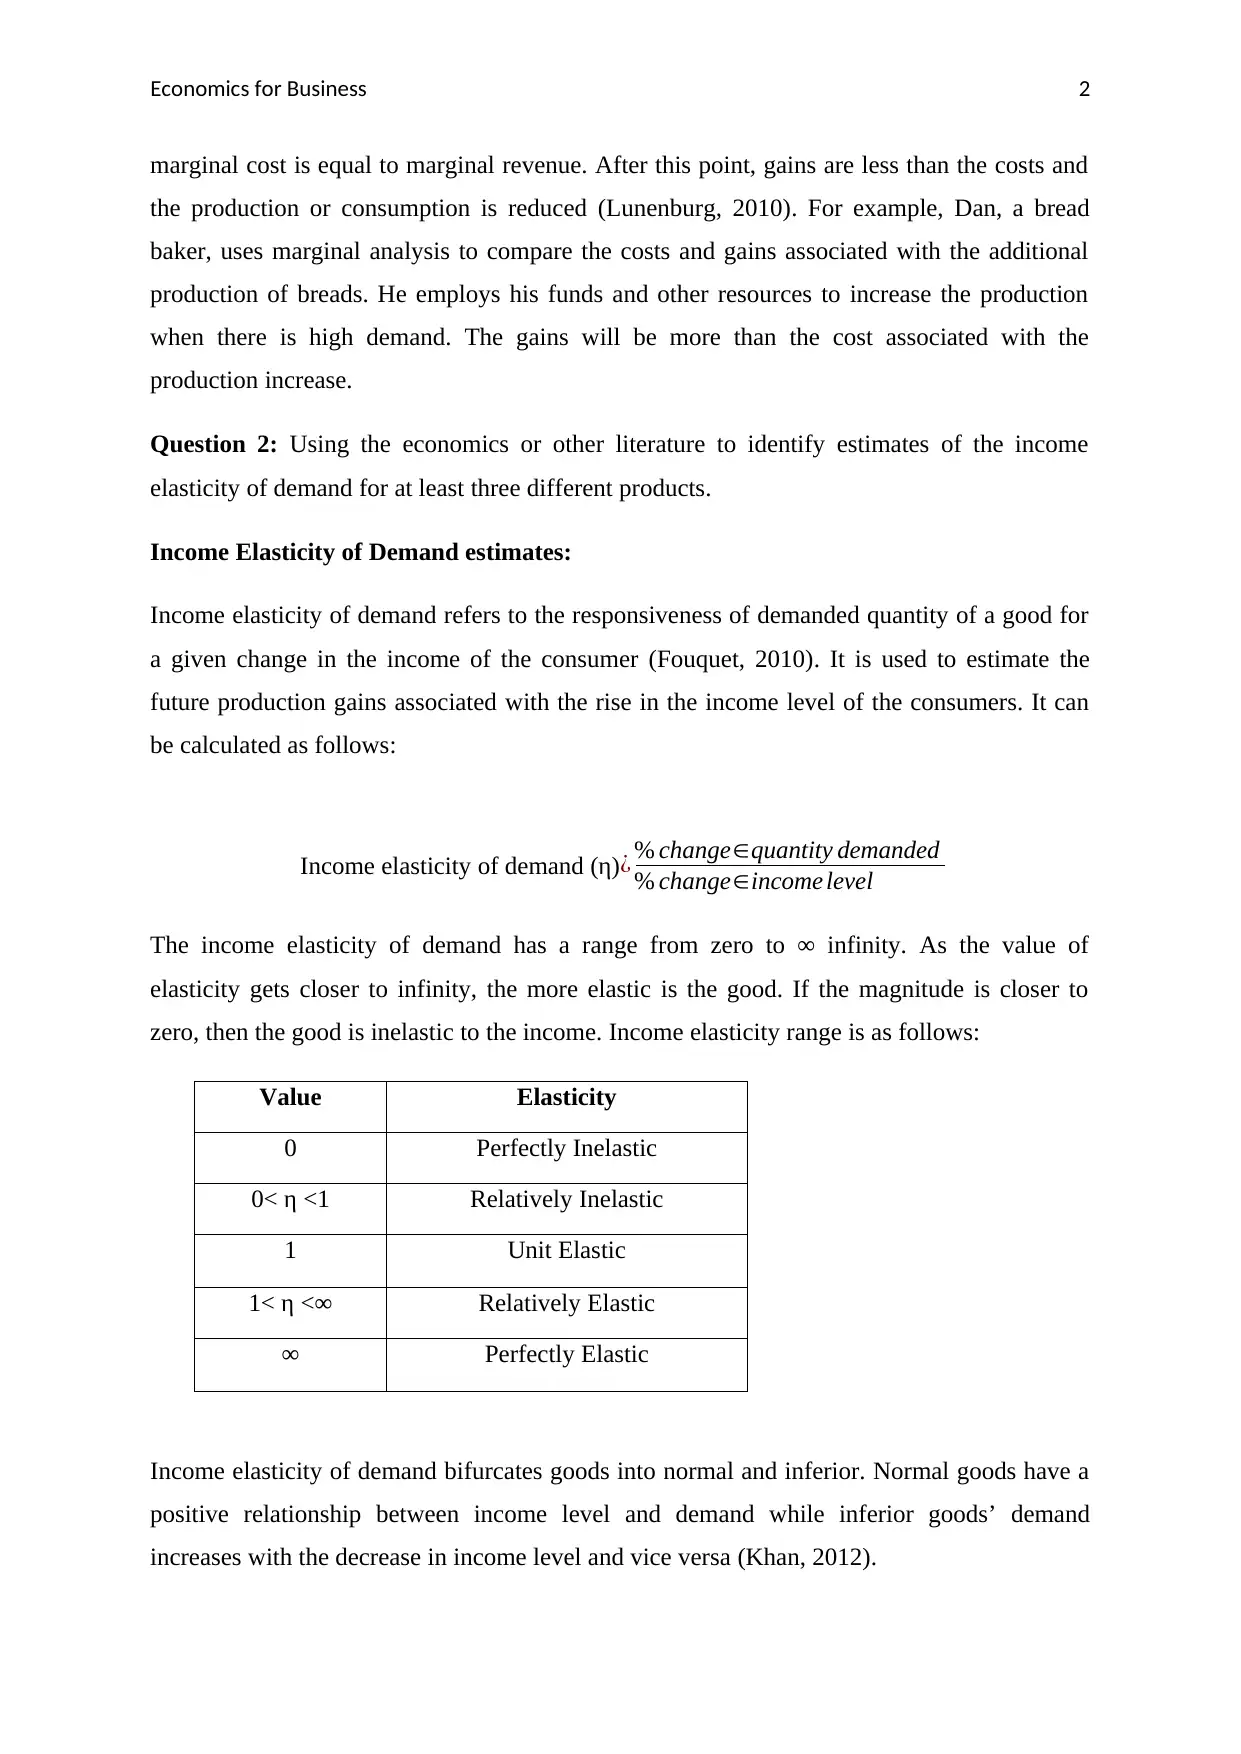
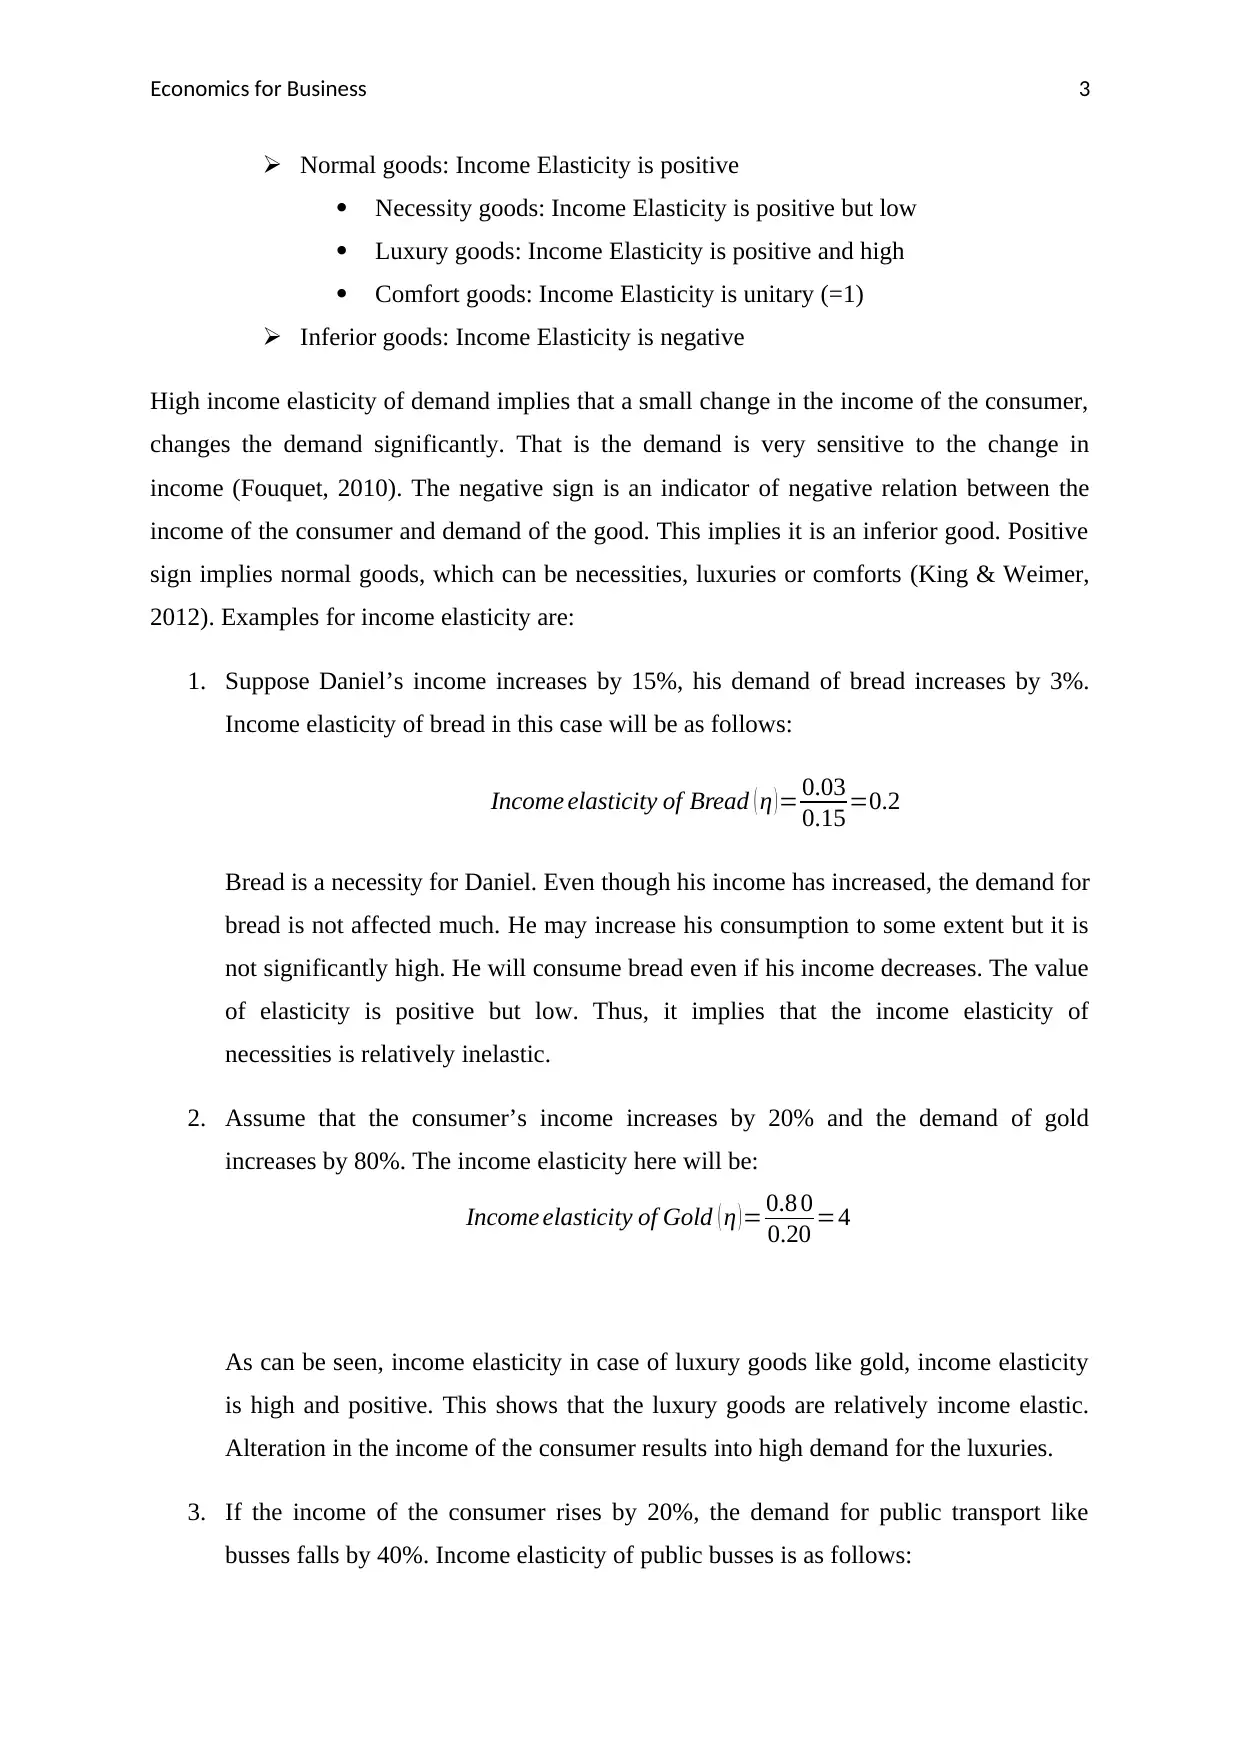
This assignment explores fundamental economic principles and their practical applications. It begins by defining and explaining three key economic ideas: rational behavior, the role of incentives, and the concept of making optimal decisions at the margin. The assignment then delves into the concept of income elasticity of demand, providing estimates for different products and categorizing goods as normal or inferior based on their elasticity. The analysis includes examples such as bread, gold, and public transport to illustrate how changes in consumer income affect demand. The document references several academic sources to support the analysis and provides a comprehensive overview of economic concepts relevant to business.
Document Page
Running Head: Economics for Business
Economics for Business
tabler-icon-diamond-filled.svg

Secure Best Marks with AI Grader

Need help grading? Try our AI Grader for instant feedback on your assignments.
Document Page
Economics for Business 1
Question 1: Define and explain the three key economic ideas:
People are rational: Rationality plays an important role in the field of economics. It is a
common to assume that people are rational in behaviour. They choose a bundle of goods,
from the given alternatives, which gives them highest level of satisfaction. The resources are
taken to be constant and the decision is made according to the priorities and preferences
(Mathis & Steffen, 2012). Consumer, producers and society try to maximise their level of
satisfaction, profits and welfare respectively. They all work at margin. A consumer tries to
consume a commodity till the point his satisfaction from additional unit turns to zero, given
his level of income and prevailing prices (Krstic & Krstic, 2015). Producer produces till the
point where his gains from additional unit turn to zero. For example, if George produces
belts, he will produce till the point where his profits (revenue- cost) turn to zero with given
resources and technology. There is no incentive for him to produce further as the costs will be
higher than the revenue.
People respond to incentives: Incentive motivates consumers, producers and society to
increase their consumption, production and welfare respectively. A rational person compares
his costs to his gains. Positive incentives increase the gains of each while the negative ones
forbid further consumption or production (Cardinaels & Jia, 2010). Fall in prices is a positive
incentive for consumers to increase their consumption while the same phenomenon is
negative for the producers and vice versa. They then decrease their production until the
increase in demand (because of lower price) pushes the prices back to the initial value.
Decline in prices both increases the demand and decrease the production. Producers decrease
the output because their profits are reduced (Matthew McCaffrey, 2014). For example, if the
price of apples falls, Serena increases her consumption of apples with her given level of
income. The reduced prices acts as in incentive and persuades Serena to increase her
satisfaction with increased consumption.
Optimal decisions are made at the margin: A rational person makes a decision based on a
given number of alternatives. He trade-offs the ones associated with lesser satisfaction for the
better ones, as per his preferences. These decisions are made with respect to the existing
circumstances. It is about increase or decrease in the current consumption or production.
Decisions are never about all or none. Optimum decisions are made in terms of satisfaction or
profits derived from the subsequent unit. Decision will be favourable when the satisfaction or
gains from the subsequent unit exceeds the cost or it and vice versa. At the optimum level,
Document Page
Economics for Business 2
marginal cost is equal to marginal revenue. After this point, gains are less than the costs and
the production or consumption is reduced (Lunenburg, 2010). For example, Dan, a bread
baker, uses marginal analysis to compare the costs and gains associated with the additional
production of breads. He employs his funds and other resources to increase the production
when there is high demand. The gains will be more than the cost associated with the
production increase.
Question 2: Using the economics or other literature to identify estimates of the income
elasticity of demand for at least three different products.
Income Elasticity of Demand estimates:
Income elasticity of demand refers to the responsiveness of demanded quantity of a good for
a given change in the income of the consumer (Fouquet, 2010). It is used to estimate the
future production gains associated with the rise in the income level of the consumers. It can
be calculated as follows:
Income elasticity of demand (η)¿ % changequantity demanded
% changeincome level
The income elasticity of demand has a range from zero to ∞ infinity. As the value of
elasticity gets closer to infinity, the more elastic is the good. If the magnitude is closer to
zero, then the good is inelastic to the income. Income elasticity range is as follows:
Value Elasticity
0 Perfectly Inelastic
0< η <1 Relatively Inelastic
1 Unit Elastic
1< η <∞ Relatively Elastic
Perfectly Elastic
Income elasticity of demand bifurcates goods into normal and inferior. Normal goods have a
positive relationship between income level and demand while inferior goods’ demand
increases with the decrease in income level and vice versa (Khan, 2012).
Document Page
Economics for Business 3
Normal goods: Income Elasticity is positive
Necessity goods: Income Elasticity is positive but low
Luxury goods: Income Elasticity is positive and high
Comfort goods: Income Elasticity is unitary (=1)
Inferior goods: Income Elasticity is negative
High income elasticity of demand implies that a small change in the income of the consumer,
changes the demand significantly. That is the demand is very sensitive to the change in
income (Fouquet, 2010). The negative sign is an indicator of negative relation between the
income of the consumer and demand of the good. This implies it is an inferior good. Positive
sign implies normal goods, which can be necessities, luxuries or comforts (King & Weimer,
2012). Examples for income elasticity are:
1. Suppose Daniel’s income increases by 15%, his demand of bread increases by 3%.
Income elasticity of bread in this case will be as follows:
Income elasticity of Bread ( η ) = 0.03
0.15 =0.2
Bread is a necessity for Daniel. Even though his income has increased, the demand for
bread is not affected much. He may increase his consumption to some extent but it is
not significantly high. He will consume bread even if his income decreases. The value
of elasticity is positive but low. Thus, it implies that the income elasticity of
necessities is relatively inelastic.
2. Assume that the consumer’s income increases by 20% and the demand of gold
increases by 80%. The income elasticity here will be:
Income elasticity of Gold ( η )= 0.8 0
0.20 =4
As can be seen, income elasticity in case of luxury goods like gold, income elasticity
is high and positive. This shows that the luxury goods are relatively income elastic.
Alteration in the income of the consumer results into high demand for the luxuries.
3. If the income of the consumer rises by 20%, the demand for public transport like
busses falls by 40%. Income elasticity of public busses is as follows:
tabler-icon-diamond-filled.svg

Secure Best Marks with AI Grader

Need help grading? Try our AI Grader for instant feedback on your assignments.
Document Page
Economics for Business 4
Income elasticity of Public Busses( η)=0.40
0.20 =2
The negative sign only signifies that it is an inferior good.
Here, the income elasticity is negative and relatively elastic. When the income of the
consumer rises, the demand for inferior good gets reduced. Since, the quality of the
goods is low; people opt for better options with the increased income. They switch to
cabs in the given case.
References
Cardinaels, E., & Jia, Y. (2010). The Impact of Economic Incentives and Peer Influences.
Retrieved March 09, 2018, from
file:///C:/Users/%234079/Downloads/econ_incent_peers_honesty_final_draft.pdf
Fouquet, R. (2010). Trens in Income and Price Elasticities of Transport Demand (1850-
2010). Energy Policy, 50, 50-61.
Khan, S. (2012, June). Income Elasticities of Demand for major consumption items.
International Journal of Scientific and Research Publications, 02(06).
King, M. K., & Weimer, D. L. (2012). Price and Income Elasticities of Demand for Energy.
Theory and Practices for Energy Education, Training, Regulation and Standards.
Krstic, B., & Krstic, M. (2015). Rational Choice Theory and Random Behvaviour. Original
Scientific Article, 61(01), 1-13.
Lunenburg, F. C. (2010). The Decision Making Process. National Forum of Educational
Administration and Supervision Journal, 27(04).
Mathis, K., & Steffen, A. D. (2012). From Rational Choice to Behavioural. Retrieved March
09, 2018, from
Document Page
Economics for Business 5
https://www.unilu.ch/fileadmin/fakultaeten/rf/mathis/Dok/1_Mathis_Steffen_From_R
ational_Choice_to_Behavioural_Economics.pdf
Matthew McCaffrey. (2014). Incetive and Economic Point of View: The Case of Popular
Economics. The Review of Social and Economic Issues, 01(01), 71-87.
chevron_up_icon
1 out of 6
circle_padding
hide_on_mobile
zoom_out_icon
[object Object]