Economics Principles: Inflation, Unemployment, and GDP Analysis
VerifiedAdded on 2023/04/04
|10
|1752
|225
Homework Assignment
AI Summary
This economics assignment delves into several key economic concepts, including GDP, inflation, unemployment, and the business cycle. The assignment begins by examining the impact of employment changes on GDP calculation, differentiating between self-employment and manufacturing roles. It then proceeds to calculate inflation rates using CPI data, analyzing quarterly inflation trends and providing a yearly inflation rate. The assignment further explores economic transactions and their impact on GDP, differentiating between personal and societal benefits. Finally, the assignment analyzes the effects of a cyclone on banana demand and its impact on CPI, as well as aggregate demand and supply, and the different phases of the business cycle and relevant economic indicators. The assignment also includes a review of aggregate demand and supply, and the factors which influence the economy.
ASSIGNMENT FOR ECONOMICS. 1
ECONOMICS PRINCIPLES.
Name:
Tutor:
Institution:
Course:
Date:
Economics Principles.
ECONOMICS PRINCIPLES.
Name:
Tutor:
Institution:
Course:
Date:
Economics Principles.
Paraphrase This Document
Need a fresh take? Get an instant paraphrase of this document with our AI Paraphraser
ASSIGNMENT FOR ECONOMICS. 2
Question 6: Inflation, Unemployment, GDP and Economic growth.
Part 1.
Mr. Lee initially was employed in his business, in this type of business he was not
involved in production of goods and services, therefore, his self-employment income of $3500
and the salary his two employees of $1000 each was not used in the determination of GDP. He is
now employed in a manufacturing company, manufacturing companies are involved in the
production of economic good and his income of $4000 will now be used in the determination of
the country’s GDP (Banerjee & Warrier, 2018). His former employees are liable to $500
unemployment benefit per year, this are also called transfer payments and are not used during
determination of GDP because they are neither economic goods nor economic services. This
benefits are only meant to bridge the gap between the poor and the rich.
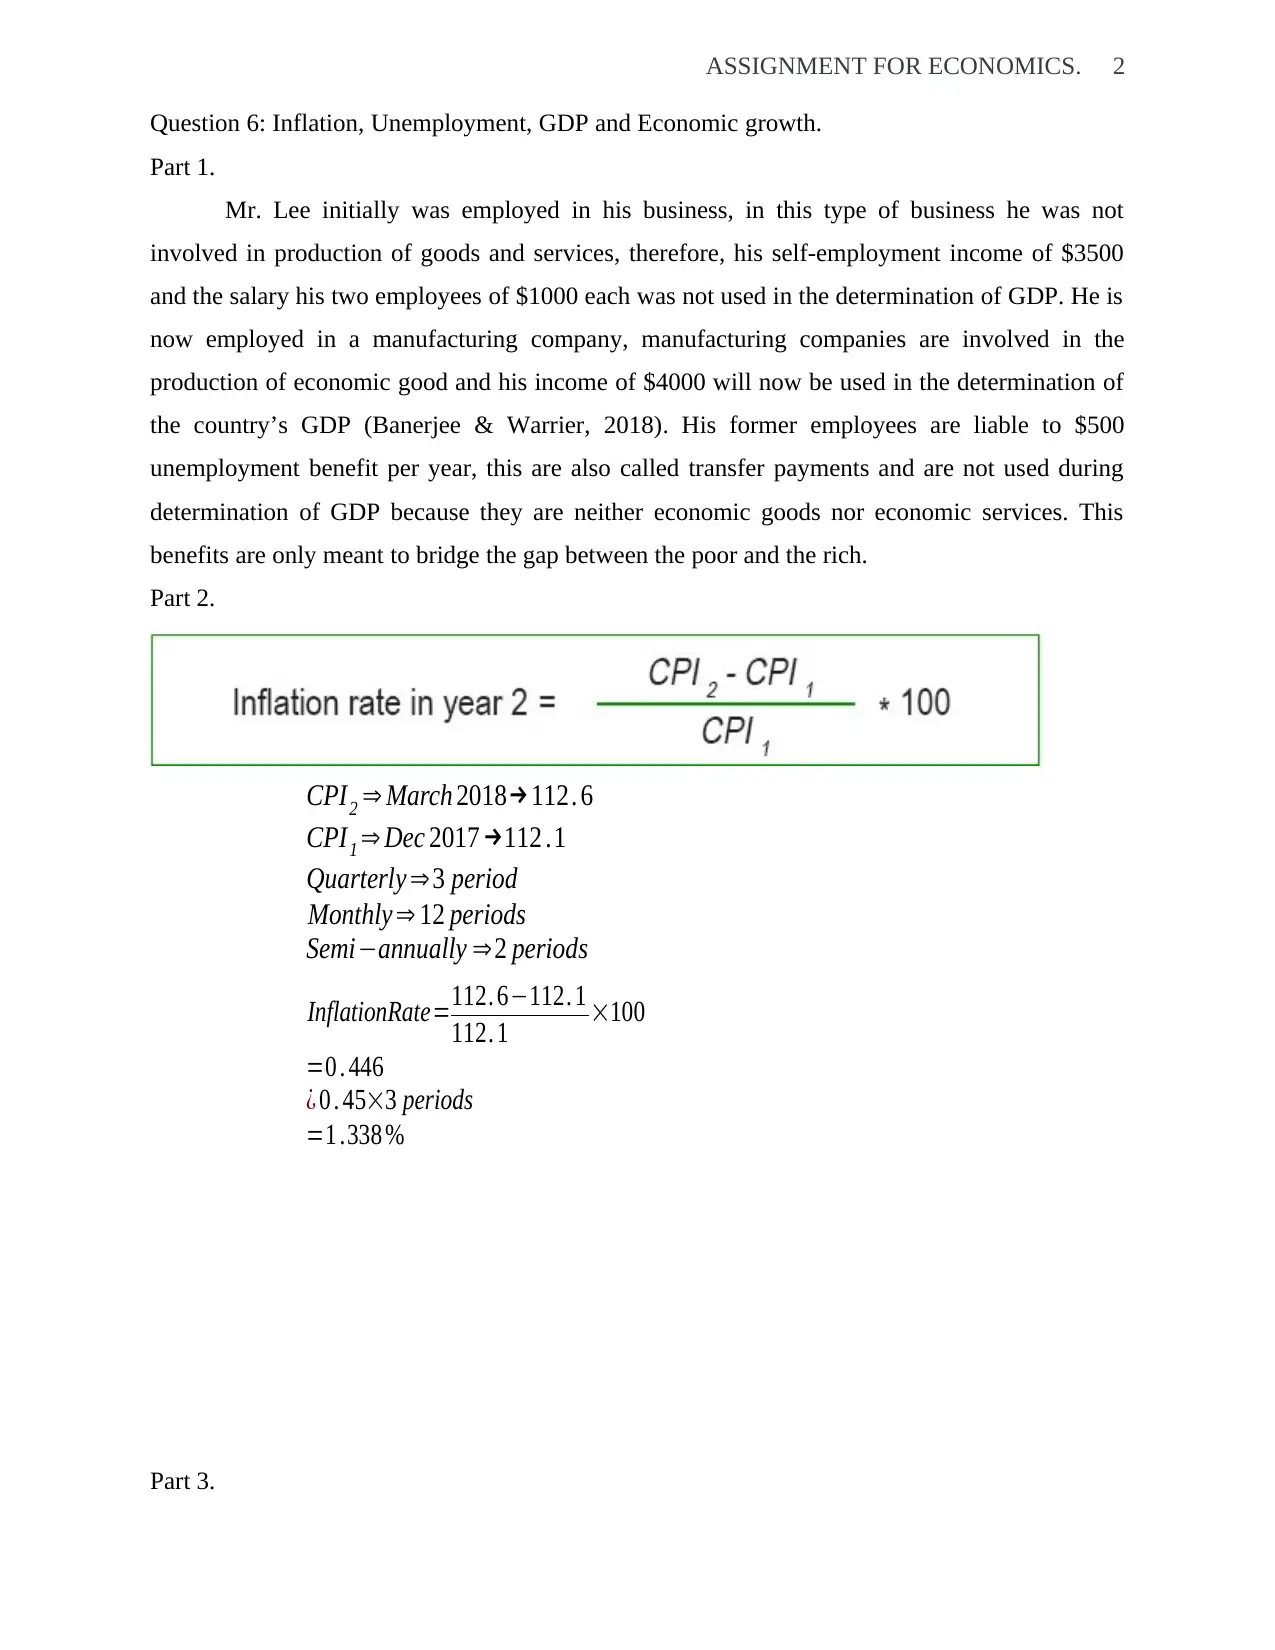
Part 2.
CPI2 ⇒ March 2018→112. 6
CPI1 ⇒ Dec 2017 →112 .1
Quarterly ⇒3 period
Monthly ⇒ 12 periods
Semi−annually ⇒2 periods
InflationRate=112. 6−112. 1
112. 1 ×100
=0 . 446
¿ 0 . 45×3 periods
=1 .338 %
Part 3.
Question 6: Inflation, Unemployment, GDP and Economic growth.
Part 1.
Mr. Lee initially was employed in his business, in this type of business he was not
involved in production of goods and services, therefore, his self-employment income of $3500
and the salary his two employees of $1000 each was not used in the determination of GDP. He is
now employed in a manufacturing company, manufacturing companies are involved in the
production of economic good and his income of $4000 will now be used in the determination of
the country’s GDP (Banerjee & Warrier, 2018). His former employees are liable to $500
unemployment benefit per year, this are also called transfer payments and are not used during
determination of GDP because they are neither economic goods nor economic services. This
benefits are only meant to bridge the gap between the poor and the rich.
Part 2.
CPI2 ⇒ March 2018→112. 6
CPI1 ⇒ Dec 2017 →112 .1
Quarterly ⇒3 period
Monthly ⇒ 12 periods
Semi−annually ⇒2 periods
InflationRate=112. 6−112. 1
112. 1 ×100
=0 . 446
¿ 0 . 45×3 periods
=1 .338 %
Part 3.
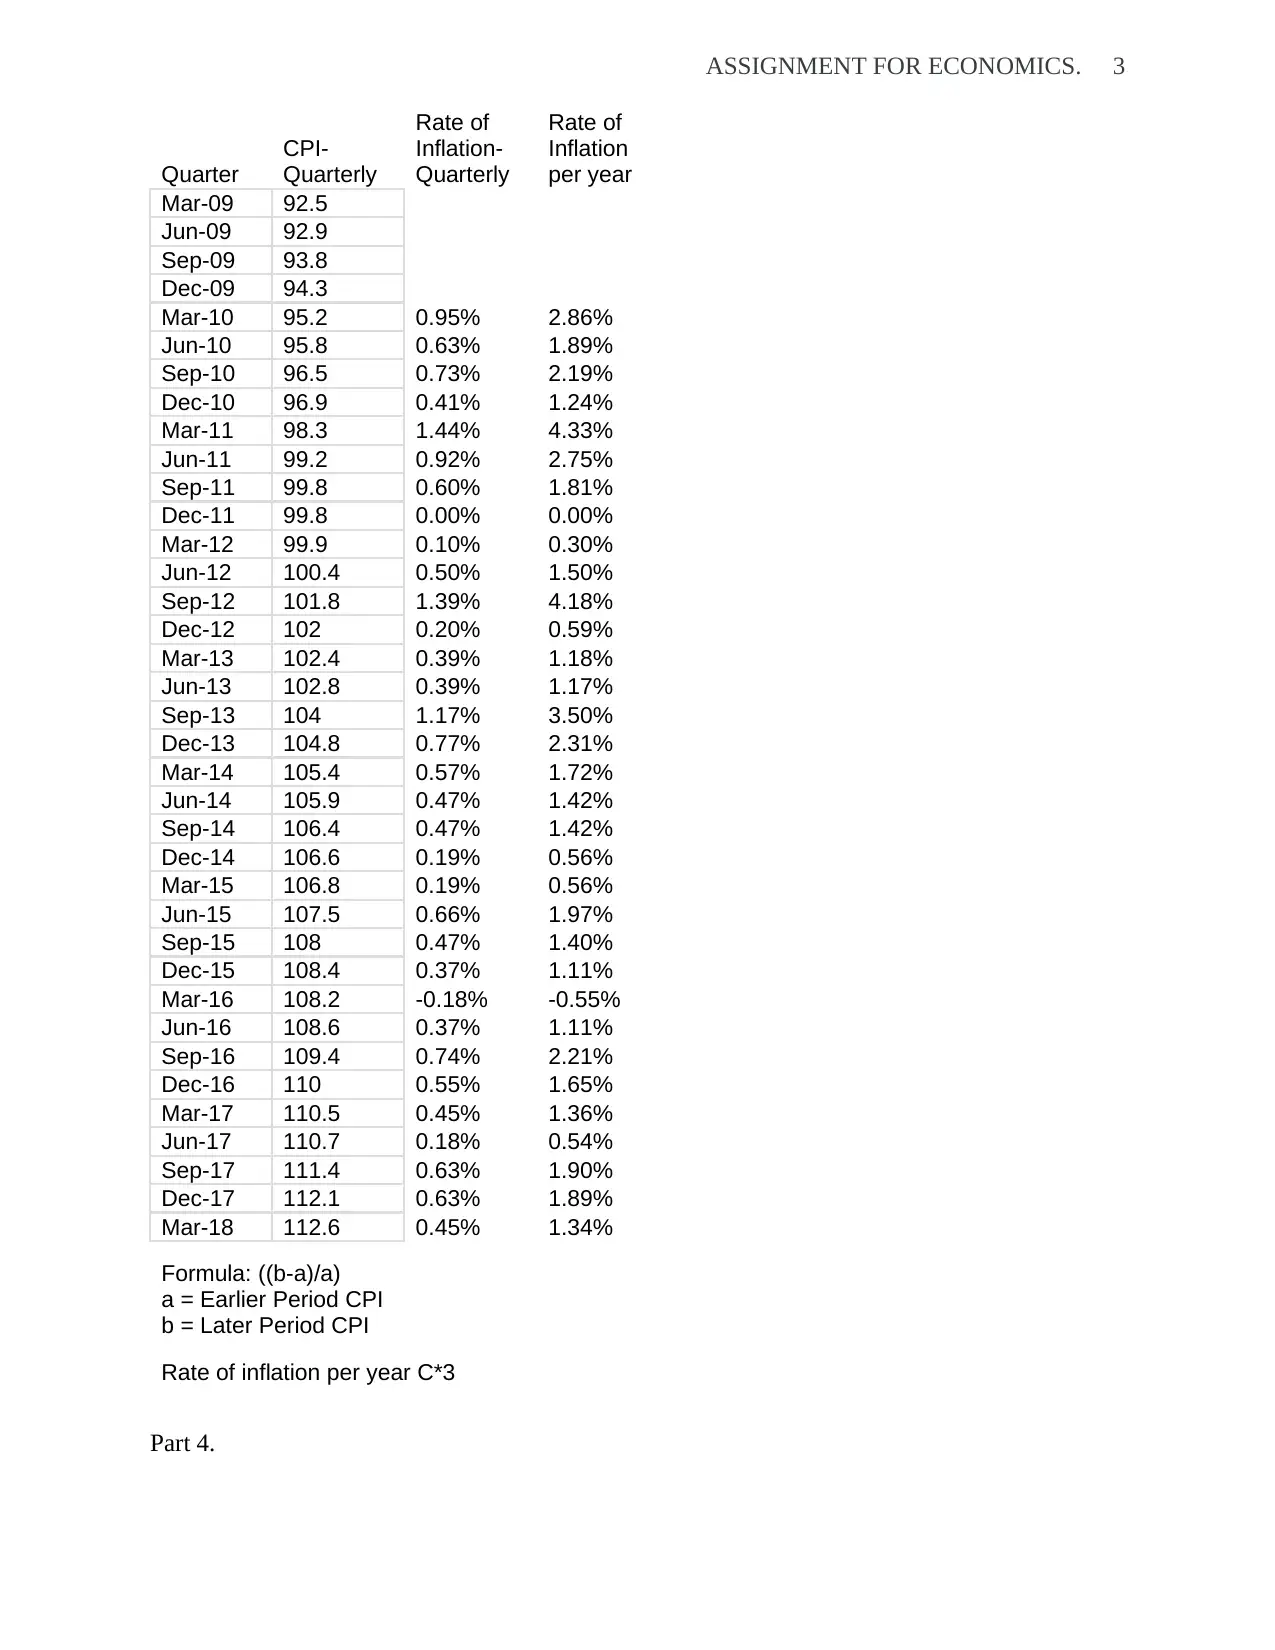
ASSIGNMENT FOR ECONOMICS. 3
Quarter
CPI-
Quarterly
Rate of
Inflation-
Quarterly
Rate of
Inflation
per year
Mar-09 92.5
Jun-09 92.9
Sep-09 93.8
Dec-09 94.3
Mar-10 95.2 0.95% 2.86%
Jun-10 95.8 0.63% 1.89%
Sep-10 96.5 0.73% 2.19%
Dec-10 96.9 0.41% 1.24%
Mar-11 98.3 1.44% 4.33%
Jun-11 99.2 0.92% 2.75%
Sep-11 99.8 0.60% 1.81%
Dec-11 99.8 0.00% 0.00%
Mar-12 99.9 0.10% 0.30%
Jun-12 100.4 0.50% 1.50%
Sep-12 101.8 1.39% 4.18%
Dec-12 102 0.20% 0.59%
Mar-13 102.4 0.39% 1.18%
Jun-13 102.8 0.39% 1.17%
Sep-13 104 1.17% 3.50%
Dec-13 104.8 0.77% 2.31%
Mar-14 105.4 0.57% 1.72%
Jun-14 105.9 0.47% 1.42%
Sep-14 106.4 0.47% 1.42%
Dec-14 106.6 0.19% 0.56%
Mar-15 106.8 0.19% 0.56%
Jun-15 107.5 0.66% 1.97%
Sep-15 108 0.47% 1.40%
Dec-15 108.4 0.37% 1.11%
Mar-16 108.2 -0.18% -0.55%
Jun-16 108.6 0.37% 1.11%
Sep-16 109.4 0.74% 2.21%
Dec-16 110 0.55% 1.65%
Mar-17 110.5 0.45% 1.36%
Jun-17 110.7 0.18% 0.54%
Sep-17 111.4 0.63% 1.90%
Dec-17 112.1 0.63% 1.89%
Mar-18 112.6 0.45% 1.34%
Formula: ((b-a)/a)
a = Earlier Period CPI
b = Later Period CPI
Rate of inflation per year C*3
Part 4.
⊘ This is a preview!⊘
Do you want full access?
Subscribe today to unlock all pages.
Trusted by 1+ million students worldwide
ASSIGNMENT FOR ECONOMICS. 4
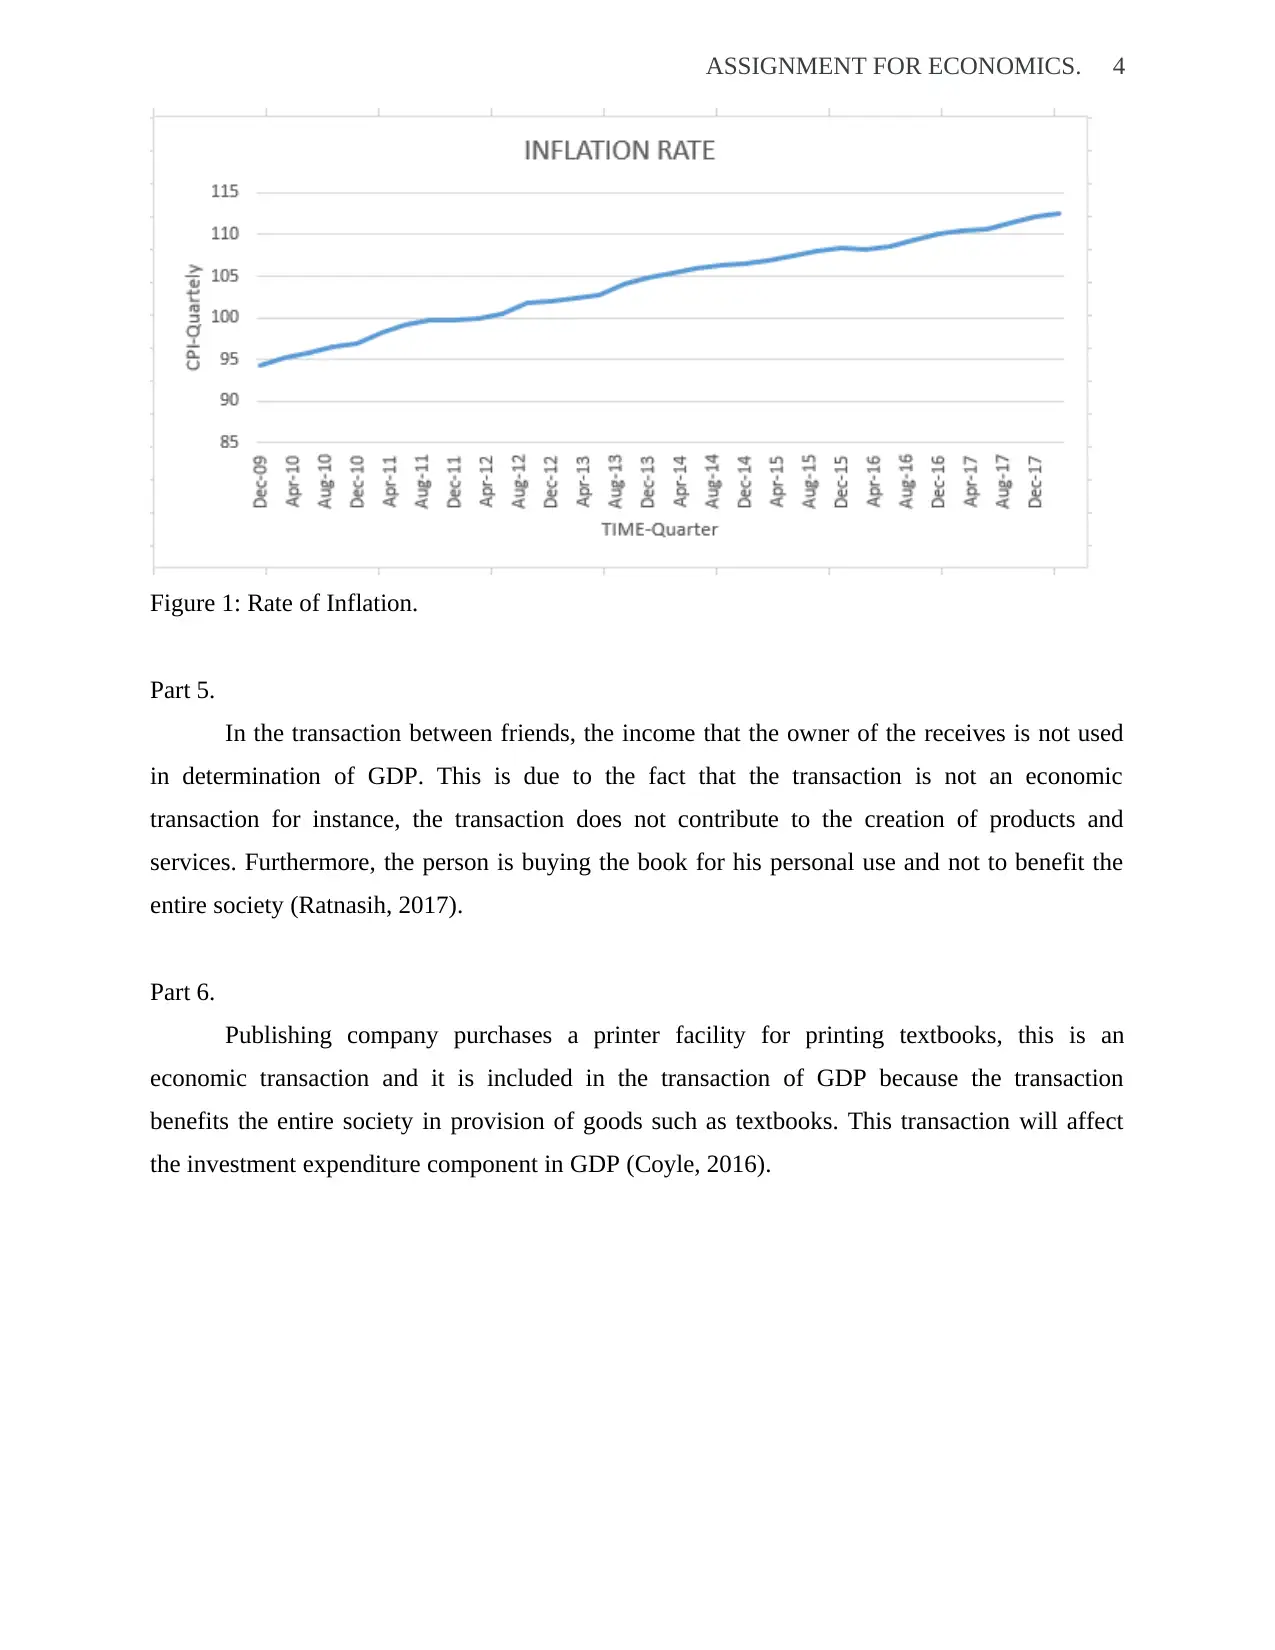
Figure 1: Rate of Inflation.
Part 5.
In the transaction between friends, the income that the owner of the receives is not used
in determination of GDP. This is due to the fact that the transaction is not an economic
transaction for instance, the transaction does not contribute to the creation of products and
services. Furthermore, the person is buying the book for his personal use and not to benefit the
entire society (Ratnasih, 2017).
Part 6.
Publishing company purchases a printer facility for printing textbooks, this is an
economic transaction and it is included in the transaction of GDP because the transaction
benefits the entire society in provision of goods such as textbooks. This transaction will affect
the investment expenditure component in GDP (Coyle, 2016).
Paraphrase This Document
Need a fresh take? Get an instant paraphrase of this document with our AI Paraphraser
ASSIGNMENT FOR ECONOMICS. 5
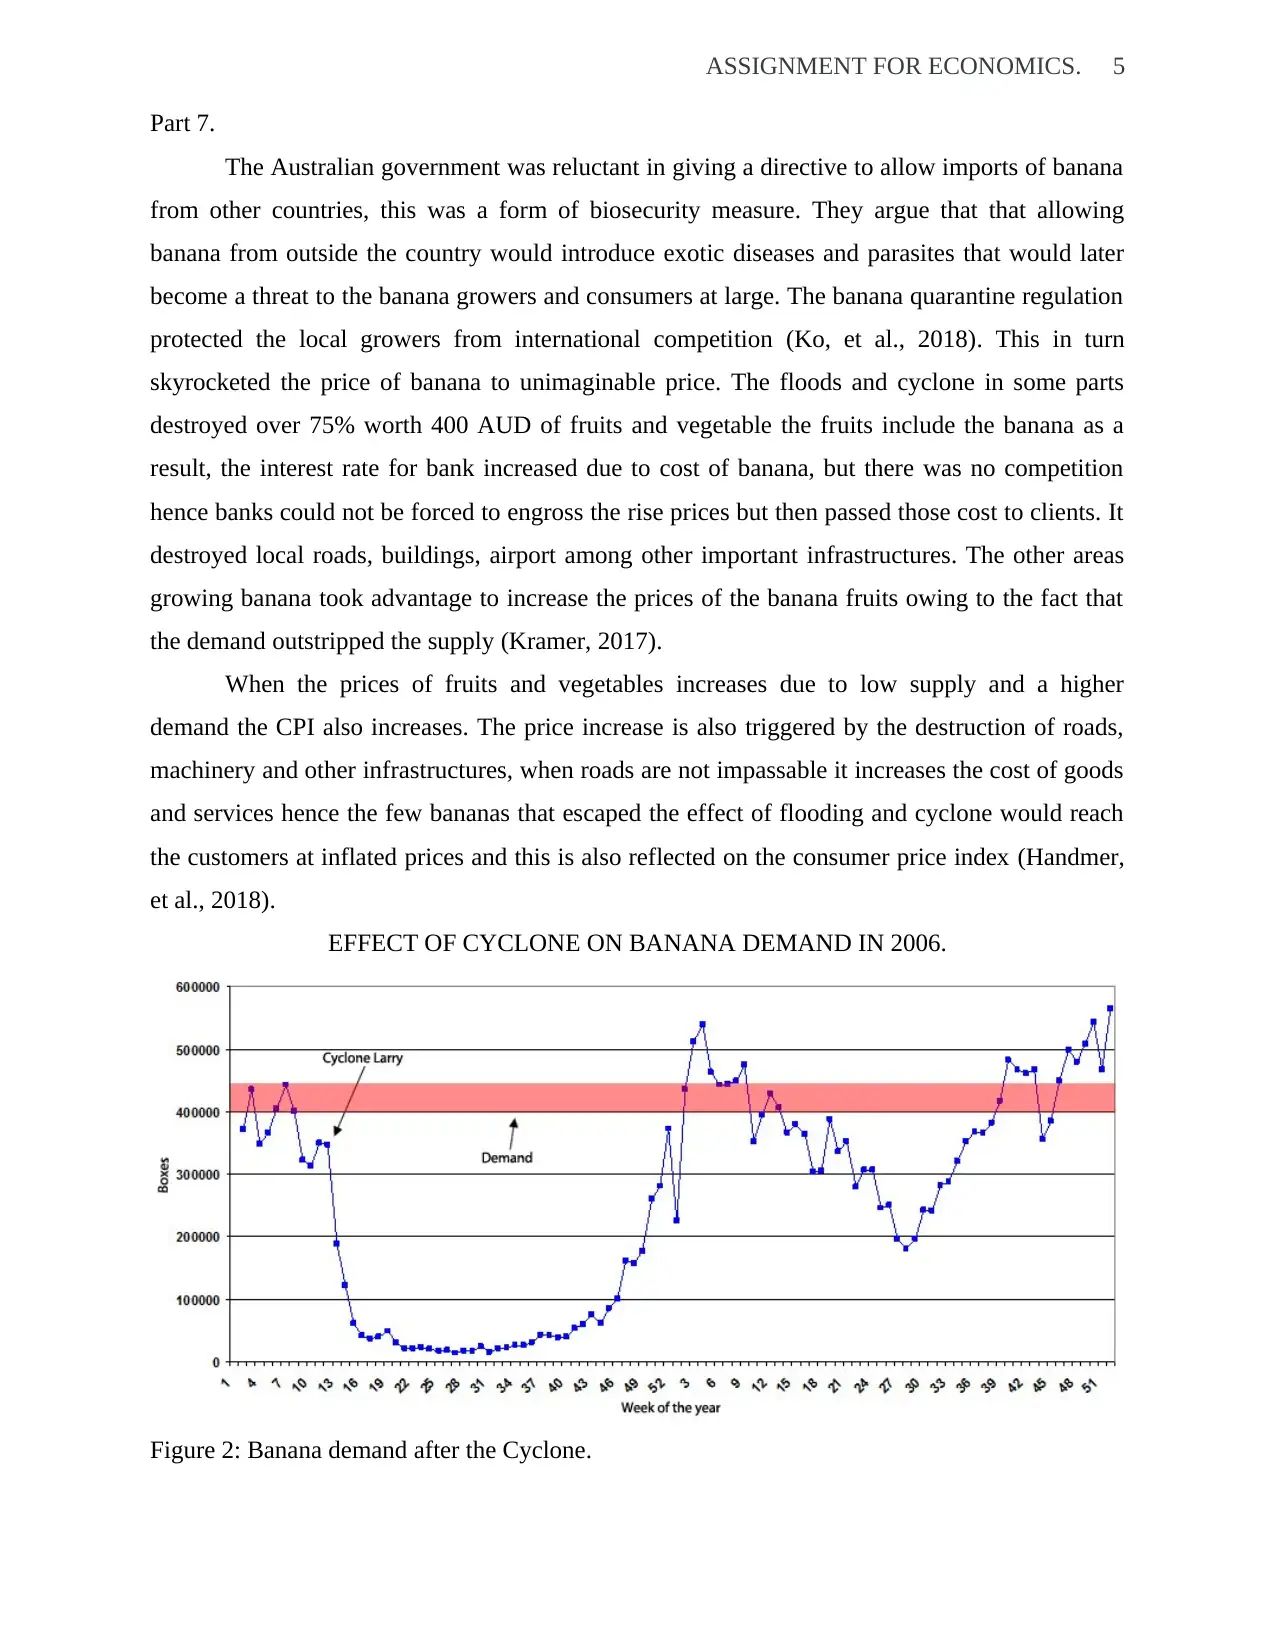
Part 7.
The Australian government was reluctant in giving a directive to allow imports of banana
from other countries, this was a form of biosecurity measure. They argue that that allowing
banana from outside the country would introduce exotic diseases and parasites that would later
become a threat to the banana growers and consumers at large. The banana quarantine regulation
protected the local growers from international competition (Ko, et al., 2018). This in turn
skyrocketed the price of banana to unimaginable price. The floods and cyclone in some parts
destroyed over 75% worth 400 AUD of fruits and vegetable the fruits include the banana as a
result, the interest rate for bank increased due to cost of banana, but there was no competition
hence banks could not be forced to engross the rise prices but then passed those cost to clients. It
destroyed local roads, buildings, airport among other important infrastructures. The other areas
growing banana took advantage to increase the prices of the banana fruits owing to the fact that
the demand outstripped the supply (Kramer, 2017).
When the prices of fruits and vegetables increases due to low supply and a higher
demand the CPI also increases. The price increase is also triggered by the destruction of roads,
machinery and other infrastructures, when roads are not impassable it increases the cost of goods
and services hence the few bananas that escaped the effect of flooding and cyclone would reach
the customers at inflated prices and this is also reflected on the consumer price index (Handmer,
et al., 2018).
EFFECT OF CYCLONE ON BANANA DEMAND IN 2006.
Figure 2: Banana demand after the Cyclone.
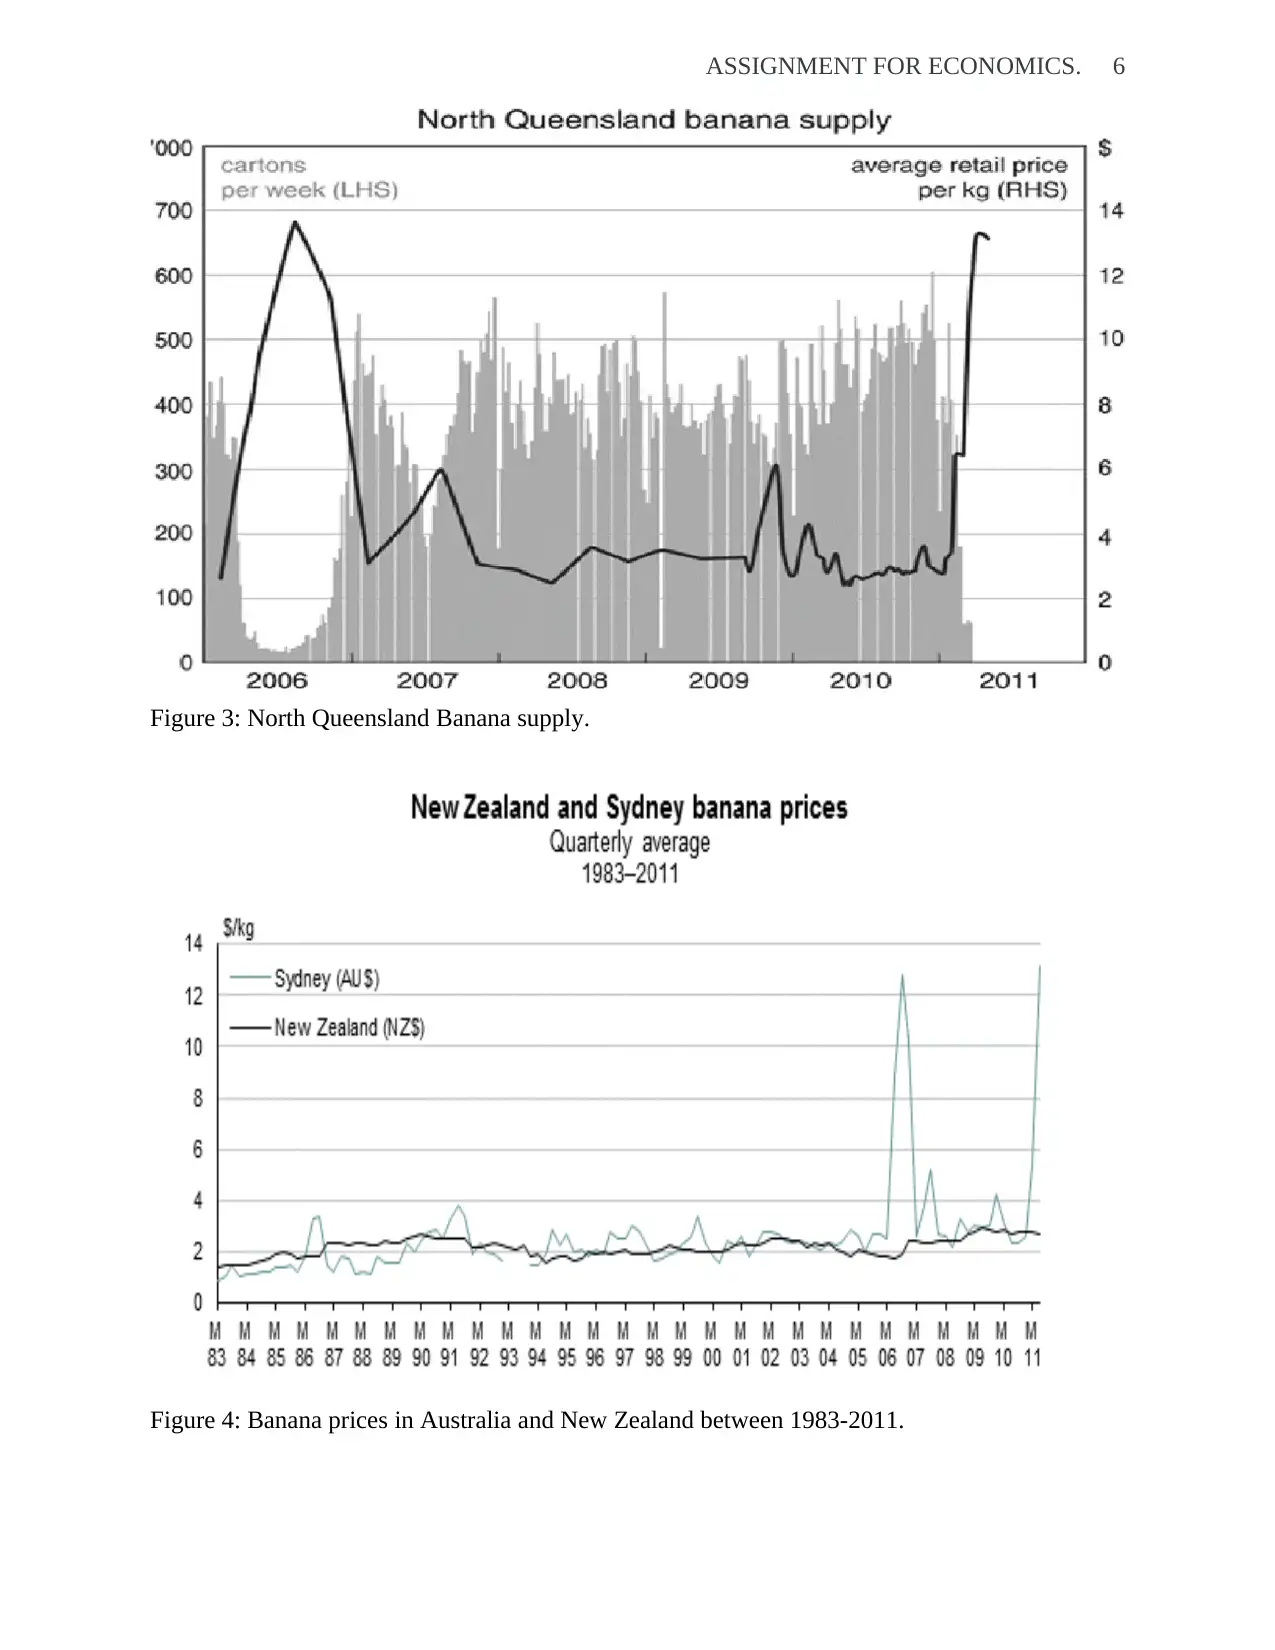
ASSIGNMENT FOR ECONOMICS. 6
Figure 3: North Queensland Banana supply.
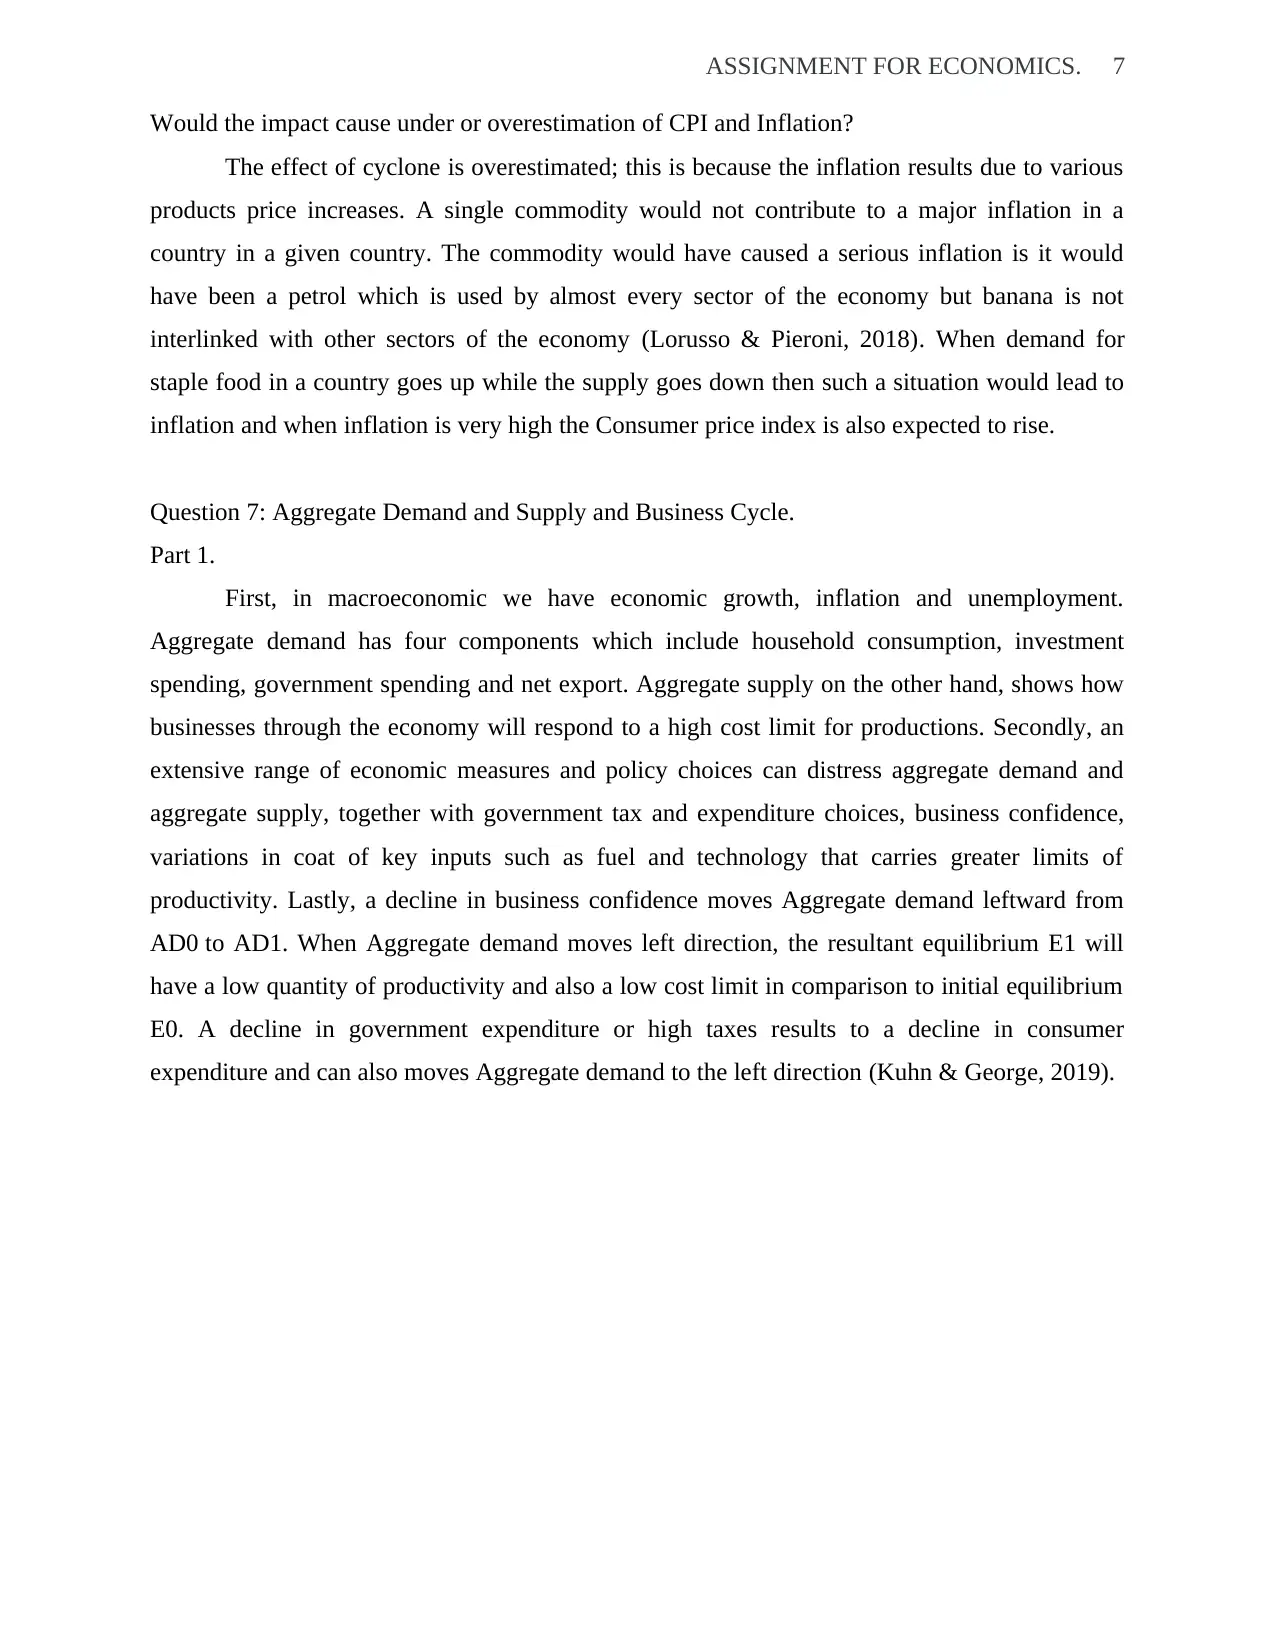
Figure 4: Banana prices in Australia and New Zealand between 1983-2011.
Figure 3: North Queensland Banana supply.
Figure 4: Banana prices in Australia and New Zealand between 1983-2011.
⊘ This is a preview!⊘
Do you want full access?
Subscribe today to unlock all pages.
Trusted by 1+ million students worldwide
ASSIGNMENT FOR ECONOMICS. 7
Would the impact cause under or overestimation of CPI and Inflation?
The effect of cyclone is overestimated; this is because the inflation results due to various
products price increases. A single commodity would not contribute to a major inflation in a
country in a given country. The commodity would have caused a serious inflation is it would
have been a petrol which is used by almost every sector of the economy but banana is not
interlinked with other sectors of the economy (Lorusso & Pieroni, 2018). When demand for
staple food in a country goes up while the supply goes down then such a situation would lead to
inflation and when inflation is very high the Consumer price index is also expected to rise.
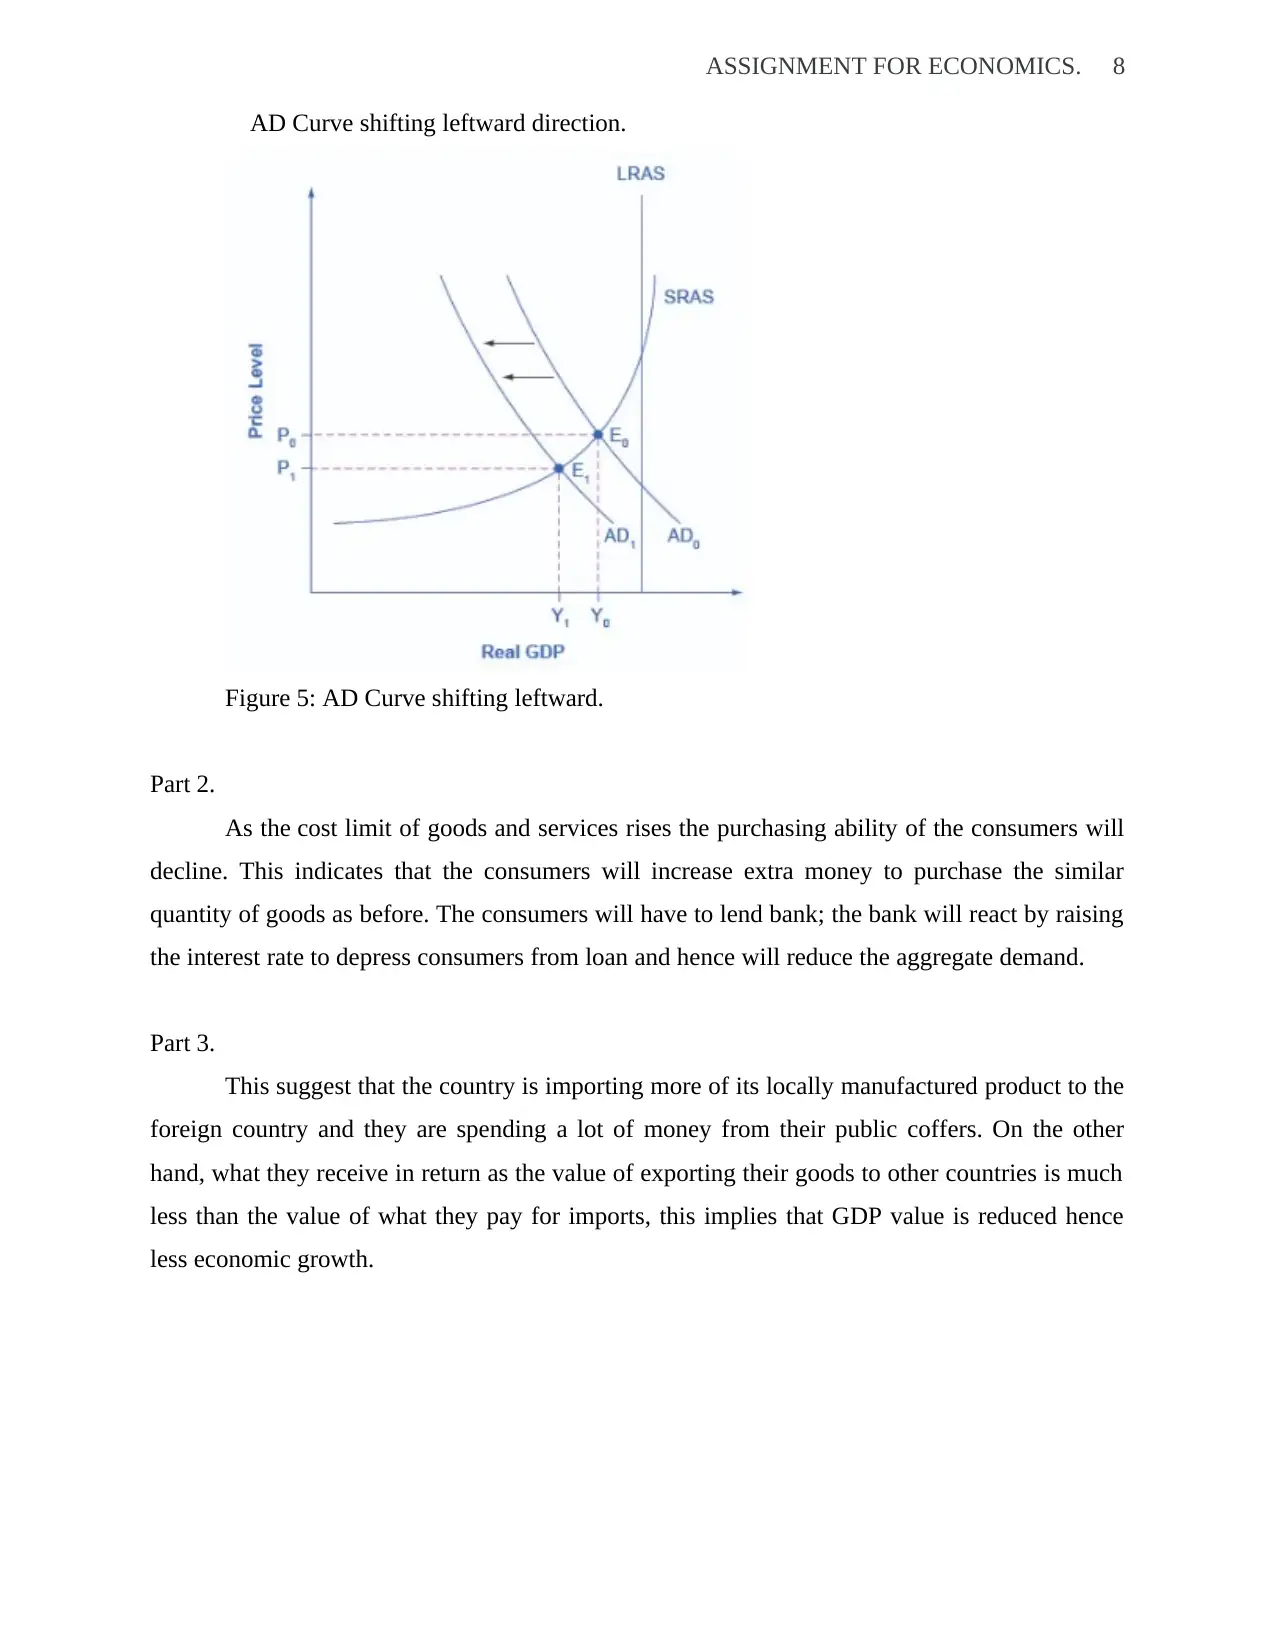
Question 7: Aggregate Demand and Supply and Business Cycle.
Part 1.
First, in macroeconomic we have economic growth, inflation and unemployment.
Aggregate demand has four components which include household consumption, investment
spending, government spending and net export. Aggregate supply on the other hand, shows how
businesses through the economy will respond to a high cost limit for productions. Secondly, an
extensive range of economic measures and policy choices can distress aggregate demand and
aggregate supply, together with government tax and expenditure choices, business confidence,
variations in coat of key inputs such as fuel and technology that carries greater limits of
productivity. Lastly, a decline in business confidence moves Aggregate demand leftward from
AD0 to AD1. When Aggregate demand moves left direction, the resultant equilibrium E1 will
have a low quantity of productivity and also a low cost limit in comparison to initial equilibrium
E0. A decline in government expenditure or high taxes results to a decline in consumer
expenditure and can also moves Aggregate demand to the left direction (Kuhn & George, 2019).
Would the impact cause under or overestimation of CPI and Inflation?
The effect of cyclone is overestimated; this is because the inflation results due to various
products price increases. A single commodity would not contribute to a major inflation in a
country in a given country. The commodity would have caused a serious inflation is it would
have been a petrol which is used by almost every sector of the economy but banana is not
interlinked with other sectors of the economy (Lorusso & Pieroni, 2018). When demand for
staple food in a country goes up while the supply goes down then such a situation would lead to
inflation and when inflation is very high the Consumer price index is also expected to rise.
Question 7: Aggregate Demand and Supply and Business Cycle.
Part 1.
First, in macroeconomic we have economic growth, inflation and unemployment.
Aggregate demand has four components which include household consumption, investment
spending, government spending and net export. Aggregate supply on the other hand, shows how
businesses through the economy will respond to a high cost limit for productions. Secondly, an
extensive range of economic measures and policy choices can distress aggregate demand and
aggregate supply, together with government tax and expenditure choices, business confidence,
variations in coat of key inputs such as fuel and technology that carries greater limits of
productivity. Lastly, a decline in business confidence moves Aggregate demand leftward from
AD0 to AD1. When Aggregate demand moves left direction, the resultant equilibrium E1 will
have a low quantity of productivity and also a low cost limit in comparison to initial equilibrium
E0. A decline in government expenditure or high taxes results to a decline in consumer
expenditure and can also moves Aggregate demand to the left direction (Kuhn & George, 2019).
Paraphrase This Document
Need a fresh take? Get an instant paraphrase of this document with our AI Paraphraser
ASSIGNMENT FOR ECONOMICS. 8
AD Curve shifting leftward direction.
Figure 5: AD Curve shifting leftward.
Part 2.
As the cost limit of goods and services rises the purchasing ability of the consumers will
decline. This indicates that the consumers will increase extra money to purchase the similar
quantity of goods as before. The consumers will have to lend bank; the bank will react by raising
the interest rate to depress consumers from loan and hence will reduce the aggregate demand.
Part 3.
This suggest that the country is importing more of its locally manufactured product to the
foreign country and they are spending a lot of money from their public coffers. On the other
hand, what they receive in return as the value of exporting their goods to other countries is much
less than the value of what they pay for imports, this implies that GDP value is reduced hence
less economic growth.
ASSIGNMENT FOR ECONOMICS. 9
Part 4.
Data to look at.
Inflation data
It estimates the price of commodities has a significant influence on the economy and
markets. In economy, higher price increases depress reserves and venture, resulting to high cost
of capital and eventually restricting development and growth. In markets, high price increases
may originally result to goods inflation but finally the stakeholders will pay less and real capital
will decrease.
Employment data
Individuals who work can expend and invest. Eventually, both of these activities are
necessary for an economy to run. Periodically, the Labour sector issues report indicating
variation in employees and unemployment rate. Despite this information providing a preview of
the labour markets, it is worth noting that employment is a lagging indicator.
Housing information
In areas of rising dwelling cost, the banks provide loan. On the other hand, the dwelling
problems has transformed. Problems in housing may result to a decline in loan provision and
consequently contraction of the economic.
Behaviour of economic contraction.
The business phase is an arrangement of growth, shrinkage and recovery in the economy.
The business phase is estimated and pursued in terms of Gross domestic product and
unemployment. The output increases and unemployment shrinks for the duration of growth
stages, while reversing in periods of depression (Camara, 2017). Where one begins in the cycle,
the economy is expected to go through four stages which are growth, peak, contraction
and trough. Depression is normally referred as slump in economic activity, but most economists
use a particular explanation of two successive quarters of decreasing real output for depression.
In contrast, there is no formal description of recession. The shifting of the economy over
business phases also point out specific economic associations. While expansion will increase and
decline with stages, there is a long term tendency of line for expansion and when economic
expansion is above the trend line, unemployment regularly declines.
Bibliography
⊘ This is a preview!⊘
Do you want full access?
Subscribe today to unlock all pages.
Trusted by 1+ million students worldwide
ASSIGNMENT FOR ECONOMICS. 10
Banerjee, S. & Warrier, P., 2018. Macroeconomics: Theories and Applications for Emerging
Economies. s.l.:SAGE Publications India Pvt Limited.
Camara, O., 2017. Industry herd behaviour in financing decision making. Journal of Economics
and Business, Volume 94, pp. 32-42.
Coyle, D., 2016. Economics: GDP in the dock. Nature, 534(7608), pp. 472-481.
Handmer, J., Ladds, M. & Magee, L., 2018. Updating the costs of disasters in Australia.
Australian Journal of Emergency Management, 33(2), pp. 40-52.
Ko, C., Frijters, P. & Foster, G., 2018. A tale of cyclones, exports and surplus forgone in
Australia's protected banana industry. Economic Record, 94(306), pp. 276-300.
Kramer, T., 2017. Australia's economic outlook. Ecodate, 31(2), pp. 3-6.
Kuhn, F. & George, C., 2019. Business cycle implications of capacity constraints under demand
shocks. Review of Economic Dynamics, Volume 32, pp. 94-121.
Lorusso, M. & Pieroni, L., 2018. Causes and consequences of oil price shocks on the UK
economy. Economic Modelling, Volume 72, pp. 223-236.
Ratnasih, C., 2017. How Financial Sector and Social Overhead Capital Determine GDP Growth.
European Research Studies, 20(3A), pp. 660-672.
1 out of 10
Related Documents


Your All-in-One AI-Powered Toolkit for Academic Success.
+13062052269
info@desklib.com
Available 24*7 on WhatsApp / Email
![[object Object]](/_next/static/media/star-bottom.7253800d.svg)
Unlock your academic potential
Copyright © 2020–2026 A2Z Services. All Rights Reserved. Developed and managed by ZUCOL.