ECON6570: Regression Analysis of Total Cost Functions in Economics

Verified

Added on  2023/05/30

|2
|501
|196
Homework Assignment
AI Summary
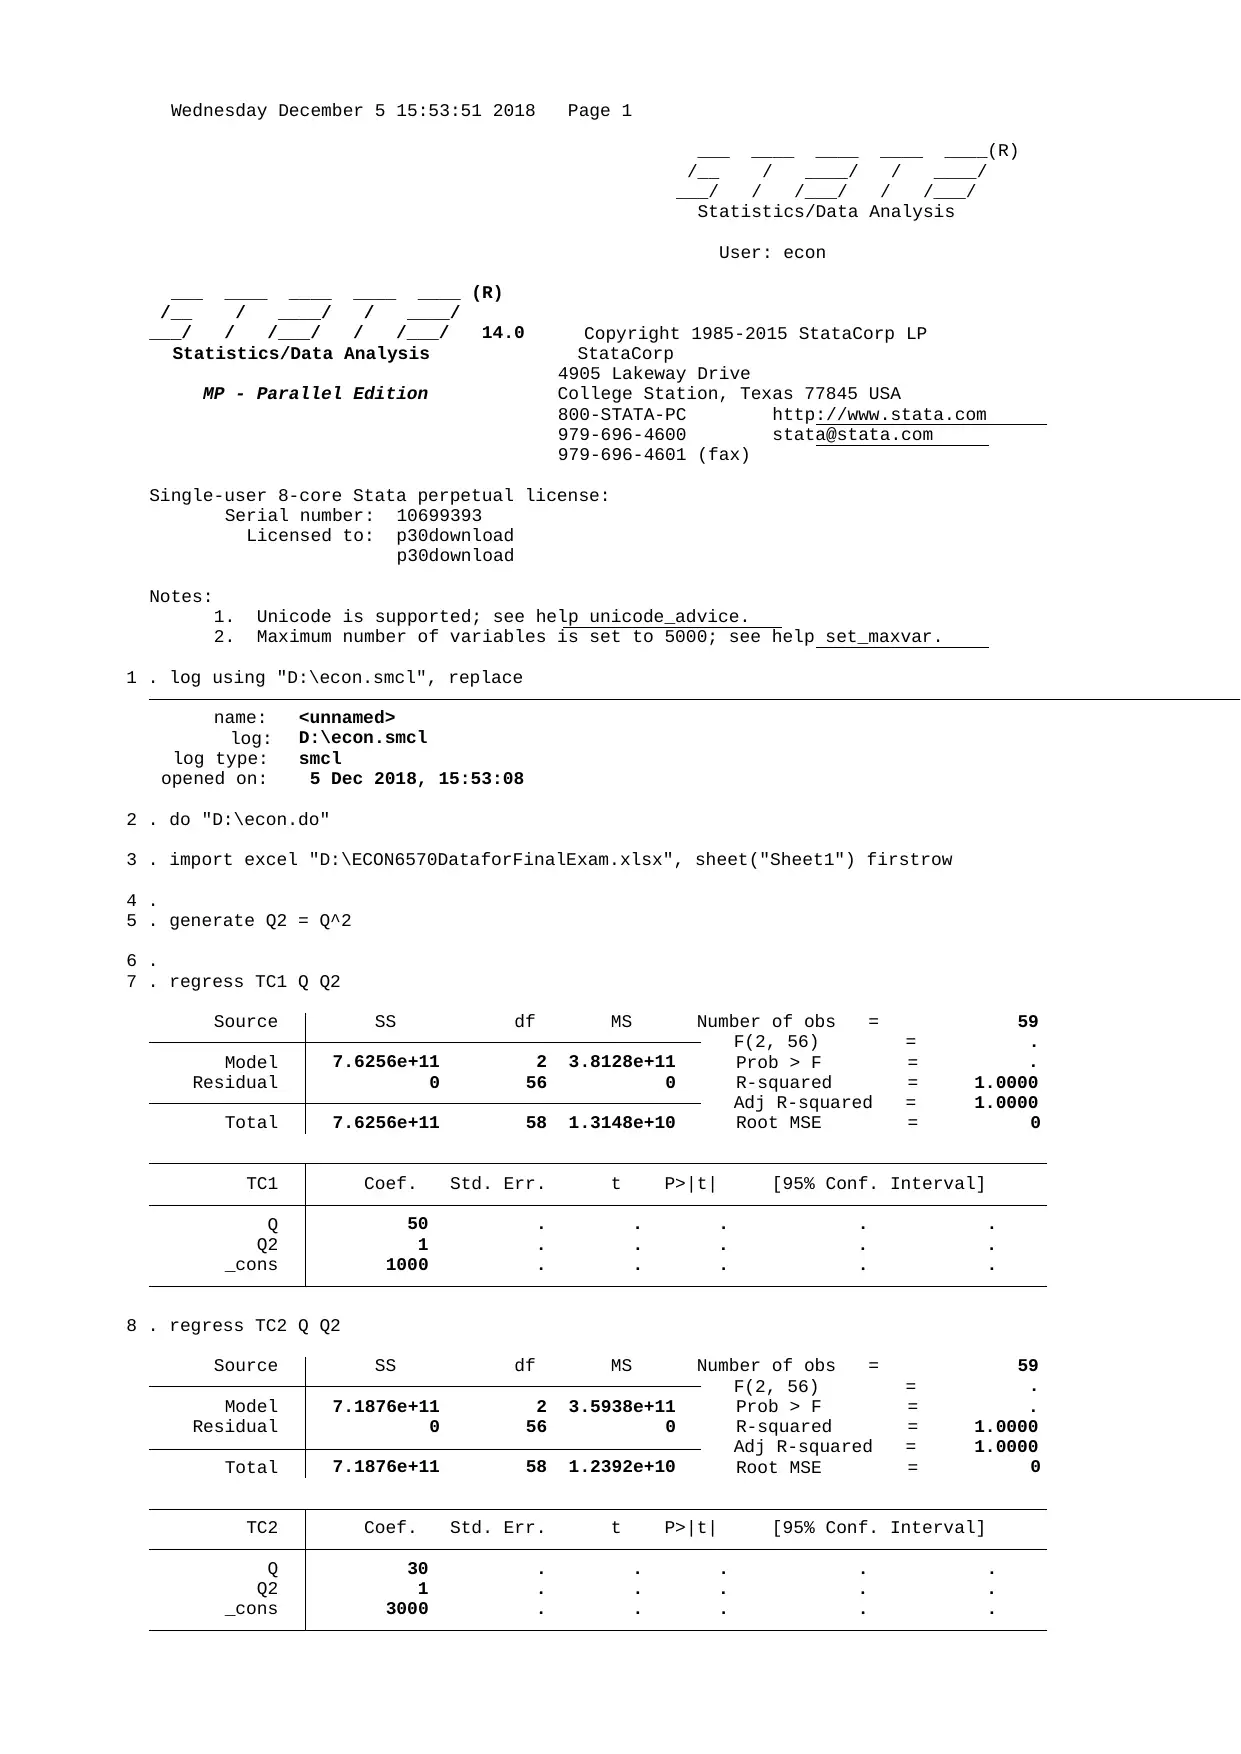
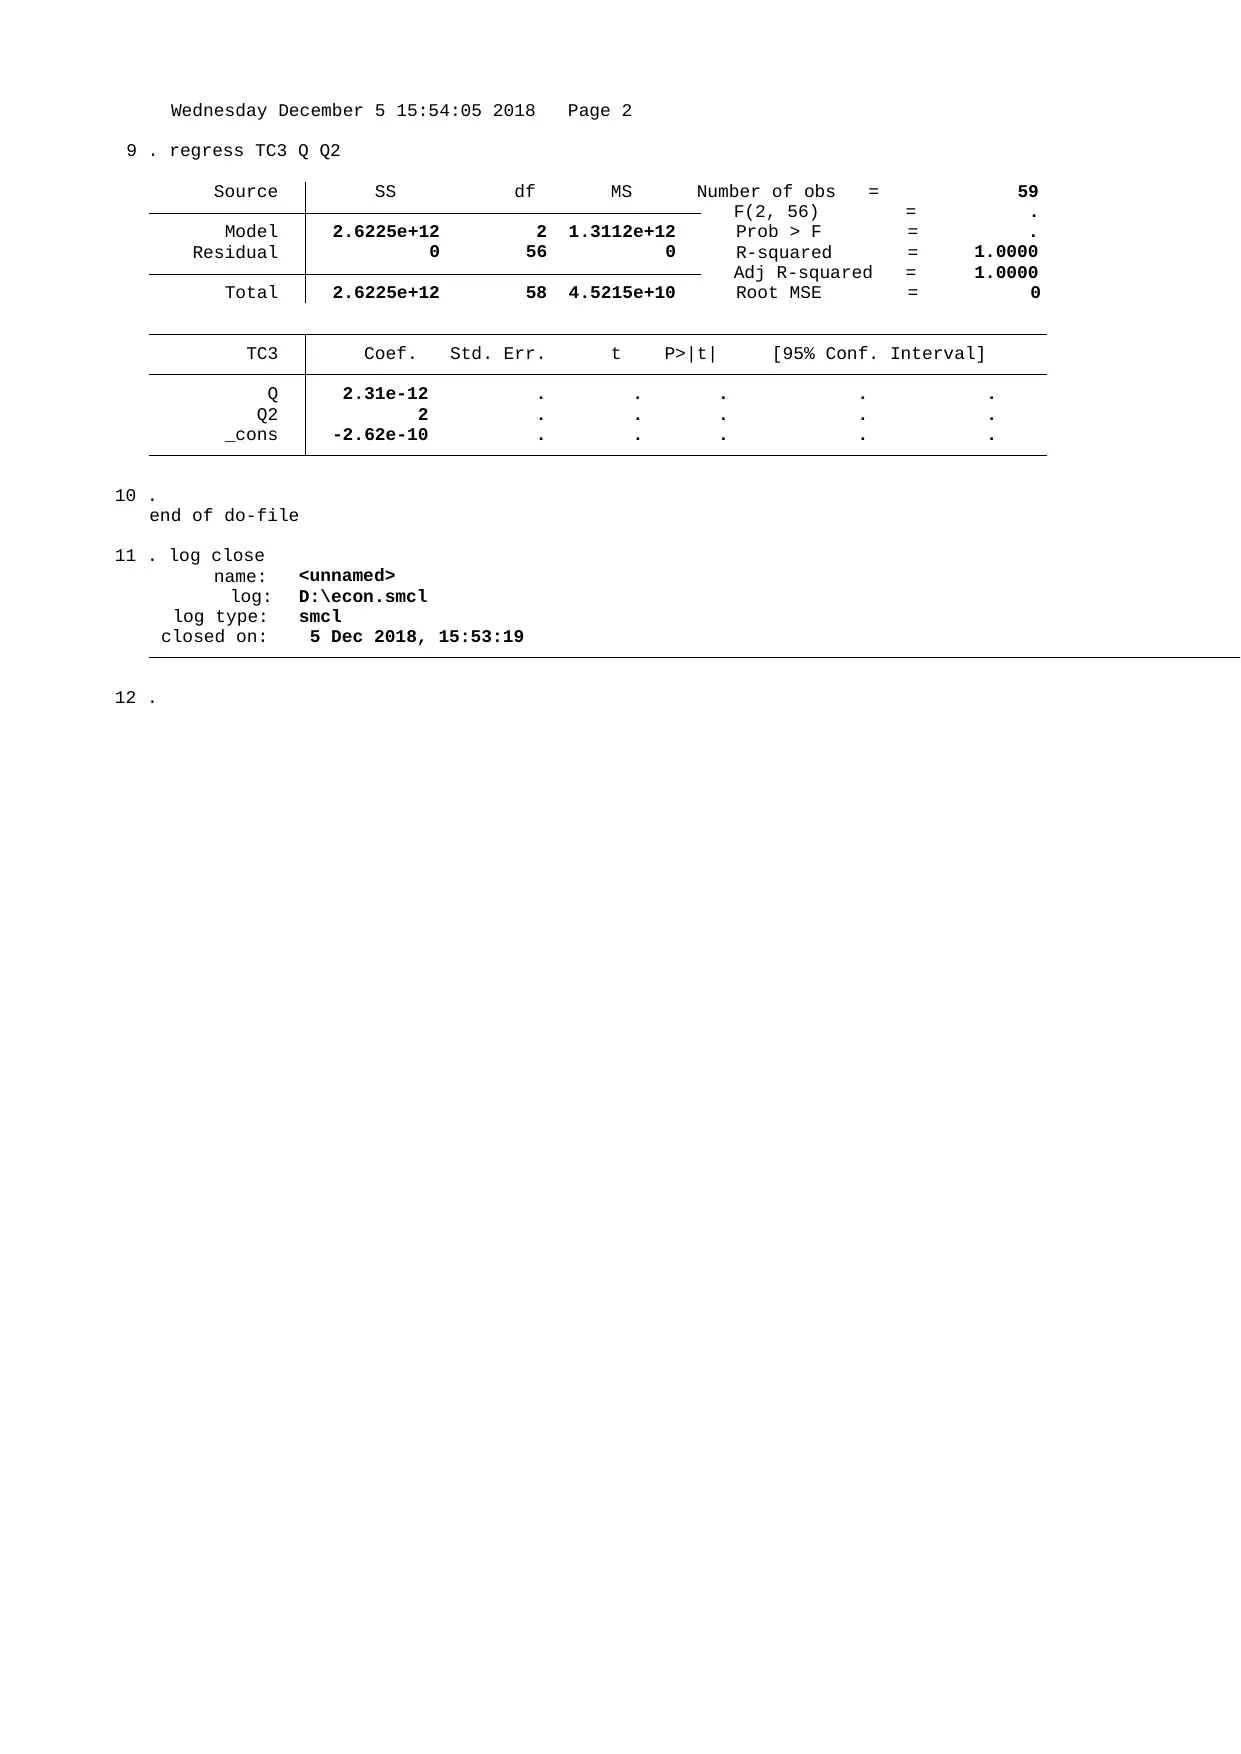
This assignment solution provides a regression analysis of total cost functions (TC1, TC2, TC3) with respect to quantity (Q) and quantity squared (Q2). The analysis is performed using Stata, and the provided output includes regression results for each total cost function. The data includes various levels of quantity and corresponding total costs. The regression models aim to determine the relationship between quantity, quantity squared, and total costs. The results show the coefficients, standard errors, t-statistics, p-values, and confidence intervals for each variable in the models. This document is available on Desklib, a platform offering a wide range of study resources including past papers and solved assignments to support students in their academic endeavors.
Document Page
Wednesday December 5 15:53:51 2018 Page 1
___ ____ ____ ____ ____(R)
/__ / ____/ / ____/
___/ / /___/ / /___/
Statistics/Data Analysis
User: econ
___ ____ ____ ____ ____ (R)
/__ / ____/ / ____/
___/ / /___/ / /___/ 14.0 Copyright 1985-2015 StataCorp LP
Statistics/Data Analysis StataCorp
4905 Lakeway Drive
MP - Parallel Edition College Station, Texas 77845 USA
800-STATA-PC http://www.stata.com
979-696-4600 stata@stata.com
979-696-4601 (fax)
Single-user 8-core Stata perpetual license:
Serial number: 10699393
Licensed to: p30download
p30download
Notes:
1. Unicode is supported; see help unicode_advice.
2. Maximum number of variables is set to 5000; see help set_maxvar.
1 . log using "D:\econ.smcl", replace
name: <unnamed>
log: D:\econ.smcl
log type: smcl
opened on: 5 Dec 2018, 15:53:08
2 . do "D:\econ.do"
3 . import excel "D:\ECON6570DataforFinalExam.xlsx", sheet("Sheet1") firstrow
4 .
5 . generate Q2 = Q^2
6 .
7 . regress TC1 Q Q2
Source SS df MS Number of obs = 59
F(2, 56) = .
Model 7.6256e+11 2 3.8128e+11 Prob > F = .
Residual 0 56 0 R-squared = 1.0000
Adj R-squared = 1.0000
Total 7.6256e+11 58 1.3148e+10 Root MSE = 0
TC1 Coef. Std. Err. t P>|t| [95% Conf. Interval]
Q 50 . . . . .
Q2 1 . . . . .
_cons 1000 . . . . .
8 . regress TC2 Q Q2
Source SS df MS Number of obs = 59
F(2, 56) = .
Model 7.1876e+11 2 3.5938e+11 Prob > F = .
Residual 0 56 0 R-squared = 1.0000
Adj R-squared = 1.0000
Total 7.1876e+11 58 1.2392e+10 Root MSE = 0
TC2 Coef. Std. Err. t P>|t| [95% Conf. Interval]
Q 30 . . . . .
Q2 1 . . . . .
_cons 3000 . . . . .
tabler-icon-diamond-filled.svg

Paraphrase This Document

Need a fresh take? Get an instant paraphrase of this document with our AI Paraphraser
Document Page
Wednesday December 5 15:54:05 2018 Page 2
9 . regress TC3 Q Q2
Source SS df MS Number of obs = 59
F(2, 56) = .
Model 2.6225e+12 2 1.3112e+12 Prob > F = .
Residual 0 56 0 R-squared = 1.0000
Adj R-squared = 1.0000
Total 2.6225e+12 58 4.5215e+10 Root MSE = 0
TC3 Coef. Std. Err. t P>|t| [95% Conf. Interval]
Q 2.31e-12 . . . . .
Q2 2 . . . . .
_cons -2.62e-10 . . . . .
10 .
end of do-file
11 . log close
name: <unnamed>
log: D:\econ.smcl
log type: smcl
closed on: 5 Dec 2018, 15:53:19
12 .
chevron_up_icon
1 out of 2
circle_padding
hide_on_mobile
zoom_out_icon
[object Object]