Economics Report: Economic Analysis of COVID-19 in Malta
VerifiedAdded on 2023/01/05
|21
|5598
|30
Report
AI Summary
This economics report provides a comprehensive analysis of the impact of the COVID-19 pandemic on the Maltese economy. It delves into various economic concepts, including the definition of demand and supply, movements along and shifts in demand functions, and the effects on equilibrium prices. The report examines different market structures, specifically focusing on the Malta International Airport and Air Malta, and the types of unemployment prevalent in Malta. It further explores the Gross Domestic Product (GDP), reasons for economic decline, and the distinction between real and nominal GDP. The report also discusses government deficits and their adherence to European Maastricht Criteria, providing a detailed understanding of the economic challenges and their implications during the pandemic. The report also includes diagrams and explanations to support the analysis.
Economics
Paraphrase This Document
Need a fresh take? Get an instant paraphrase of this document with our AI Paraphraser
Table of Contents
Executive Summary.........................................................................................................................4
Scenario 1........................................................................................................................................5
1. Define demand and supply......................................................................................................5
2. Distinguish between a movement along and a shift of the demand function..........................6
3. Diagram...................................................................................................................................7
4. Main effects on the equilibrium price of video conferencing software...................................8
5. Explanation of another scenario..............................................................................................8
Scenario 2:.......................................................................................................................................9
1. Identify the market structures which the Malta International Airport and Airmalta operate in
.....................................................................................................................................................9
2. Features of each market structure..........................................................................................10
3. Distinguish between two market structures...........................................................................11
4. Diagram for market structure.................................................................................................12
5. Comparison with perfect competition...................................................................................14
Scenario 3:.....................................................................................................................................15
1. Unemployed...........................................................................................................................15
2. Type of Unemployment.........................................................................................................15
3. Diagrams................................................................................................................................16
4. Two main measures implemented by government in order to reduce the type of
unemployment...........................................................................................................................16
Scenario 4:.....................................................................................................................................17
1. Define Gross Domestic Product............................................................................................17
2. Reasons for decline in Malta’s economic growth rate...........................................................18
3. Difference between real GDP and nominal GDP..................................................................18
4. Government deficit................................................................................................................19
5. How table abides to the European Maastricht Criteria..........................................................19
Conclusion.....................................................................................................................................20
References......................................................................................................................................21
⊘ This is a preview!⊘
Do you want full access?
Subscribe today to unlock all pages.
Trusted by 1+ million students worldwide
Executive Summary
The project report is based on the concept of economics. There have been four different
scenarios discussed in this assignment; each scenario is linked with the impact of Covid-19
pandemic. Some effects like equilibrium employment and unequilibrium employment has been
discussed with the help of diagram and ways to minimize this by government has also been
suggested.
Demand is a financial situation that refers to a shopper's desire to purchase products and
campaigns and their ability to pay attention to a particular organization or administration. By
keeping all the various elements constant, an increase in the cost of an administrator or
administration will reduce the amount required and vice versa. Market demand is the total
amount requested from all buyers on a business opportunity for a specific share.
Paraphrase This Document
Need a fresh take? Get an instant paraphrase of this document with our AI Paraphraser
Scenario 1
1. Define demand and supply.
Demand:
Demand is a financial situation that refers to a shopper's desire to purchase products and
campaigns and their ability to pay attention to a particular organization or administration. By
keeping all the various elements constant, an increase in the cost of an administrator or
administration will reduce the amount required and vice versa. Market demand is the total
amount requested from all buyers on a business opportunity for a specific share. Total interest is
the total interest in goods and businesses in an economy. Different storage methods are
constantly required to meet demand (Guiso, and et.al., 2017).
Organizations regularly invest a lot of money to determine how interested the company is in
their products and their administrations. How many of their products will have the ability to sell
at a random cost? Accurate ratings eliminate money left on the table if a question is credited or
bad luck if a question is overstated. Demand is what helps fuel the economy and without it
organizations could not create anything.
Demand is strongly characterized by flexibility. While buyers strive to address the lowest
possible costs for goods and enterprises, suppliers strive to maximize the benefits. If suppliers
charge too much, the required amount will decrease and suppliers will not offer enough items to
provide adequate benefits. Where suppliers do not charge close to anything, the amount
requested will increase but the lower costs may not cover supplier costs or take into account
benefits. Some of the elements that influence demand include reasonable administrative appeal,
competitive product accessibility, affordable price of financing, and reasonable management
reasonable price.
Supply:
Supply is a fundamental economic concept that reflects the total amount of confidentiality or
specific management accessible to clients. Grace can be identified by the amount available at a
certain cost or the amount available in a cost range when shown on a card. This almost applies to
the interest in permission or administration at a particular value; all things being equal,
manufacturers will flexibly increase if value increases as all organizations hope to promote
benefits.
The concept of supply in economics is complicated by a series of numerical recipes,
pragmatic applications and contributing variables. While flexibility can apply to anything that is
subsequently researched and sold in a real mall, grace is commonly used to refer to results,
administrations or jobs. One of the main factors of a gentle effect is the cost of the person. In
most cases, if a reasonable cost increases, the grace increases as well. The cost of related
products and the cost of data sources (energy, raw materials, labor) will also have a graceful
effect while contributing to the expansion of the total cost of masses sold (Pereira and Frazzon,
2020).
The states of gracious creation are also great; for example, when mechanical progress
expands the nature of a good stock, or if there is problem development, for example, when
innovative progress offers a less popular old age. Similarly, government directives can have a
flexible effect, for example, ecological laws, just as many suppliers (which create conflict) and
market desires. A case of this is when the ecological laws related to oil extraction affect the
flexibility of that oil.
Supply is talk in microeconomics from various numerical equations. Ability and conditions
graciously communicate the connection between influencing factors, such as those mentioned
above or even raising rates and other market influences. A graceful curve correspondingly shows
the connection between great cost and the amount given. Plenty of data can be gracefully
collected from a loop, for example, gaps (caused by a change in value), trends (caused by a
change not equal to the cost of the mass), and the value of flexibility.
Supply and demand factors are unique for a particular object or administration. These
variables are often summarized in sought-after and well-drawn profiles as a diagram bias. On
this graph, the pin simply indicates the cost, while the horizontal center indicates what is
requested or provided. An interesting curve descends a slope from left to right. As costs rise,
buyers need less access or administration. A graceful curve stretches upwards. As costs rise,
suppliers provide reasonable administration.
2. Distinguish between a movement along and a shift of the demand function.
A shift in demand means at the same price, customers want to buy more. The improvement in
the rate curve occurs after a change in cost.
⊘ This is a preview!⊘
Do you want full access?
Subscribe today to unlock all pages.
Trusted by 1+ million students worldwide
Movement along the demand curve
A change in price causes a movement along the demand curve. It can be compression (less
interest) or development / expansion.
In reality, a higher cost could improve the interest curve, but in the long run it could cause a
shift as customers face more stable costs (Pereira and Frazzon, 2020).
For example, if there was an increase in the cost of gasoline, the rate curve would improve
and less would be purchased. However, a decline in demand might be due to the unsatisfactory
general interest in gasoline.
However, in the long run, the demand curve may also shift to the left as people cope with
rising costs by finding options, for example, to buy an electric vehicle so they don't need
gasoline at this stage.
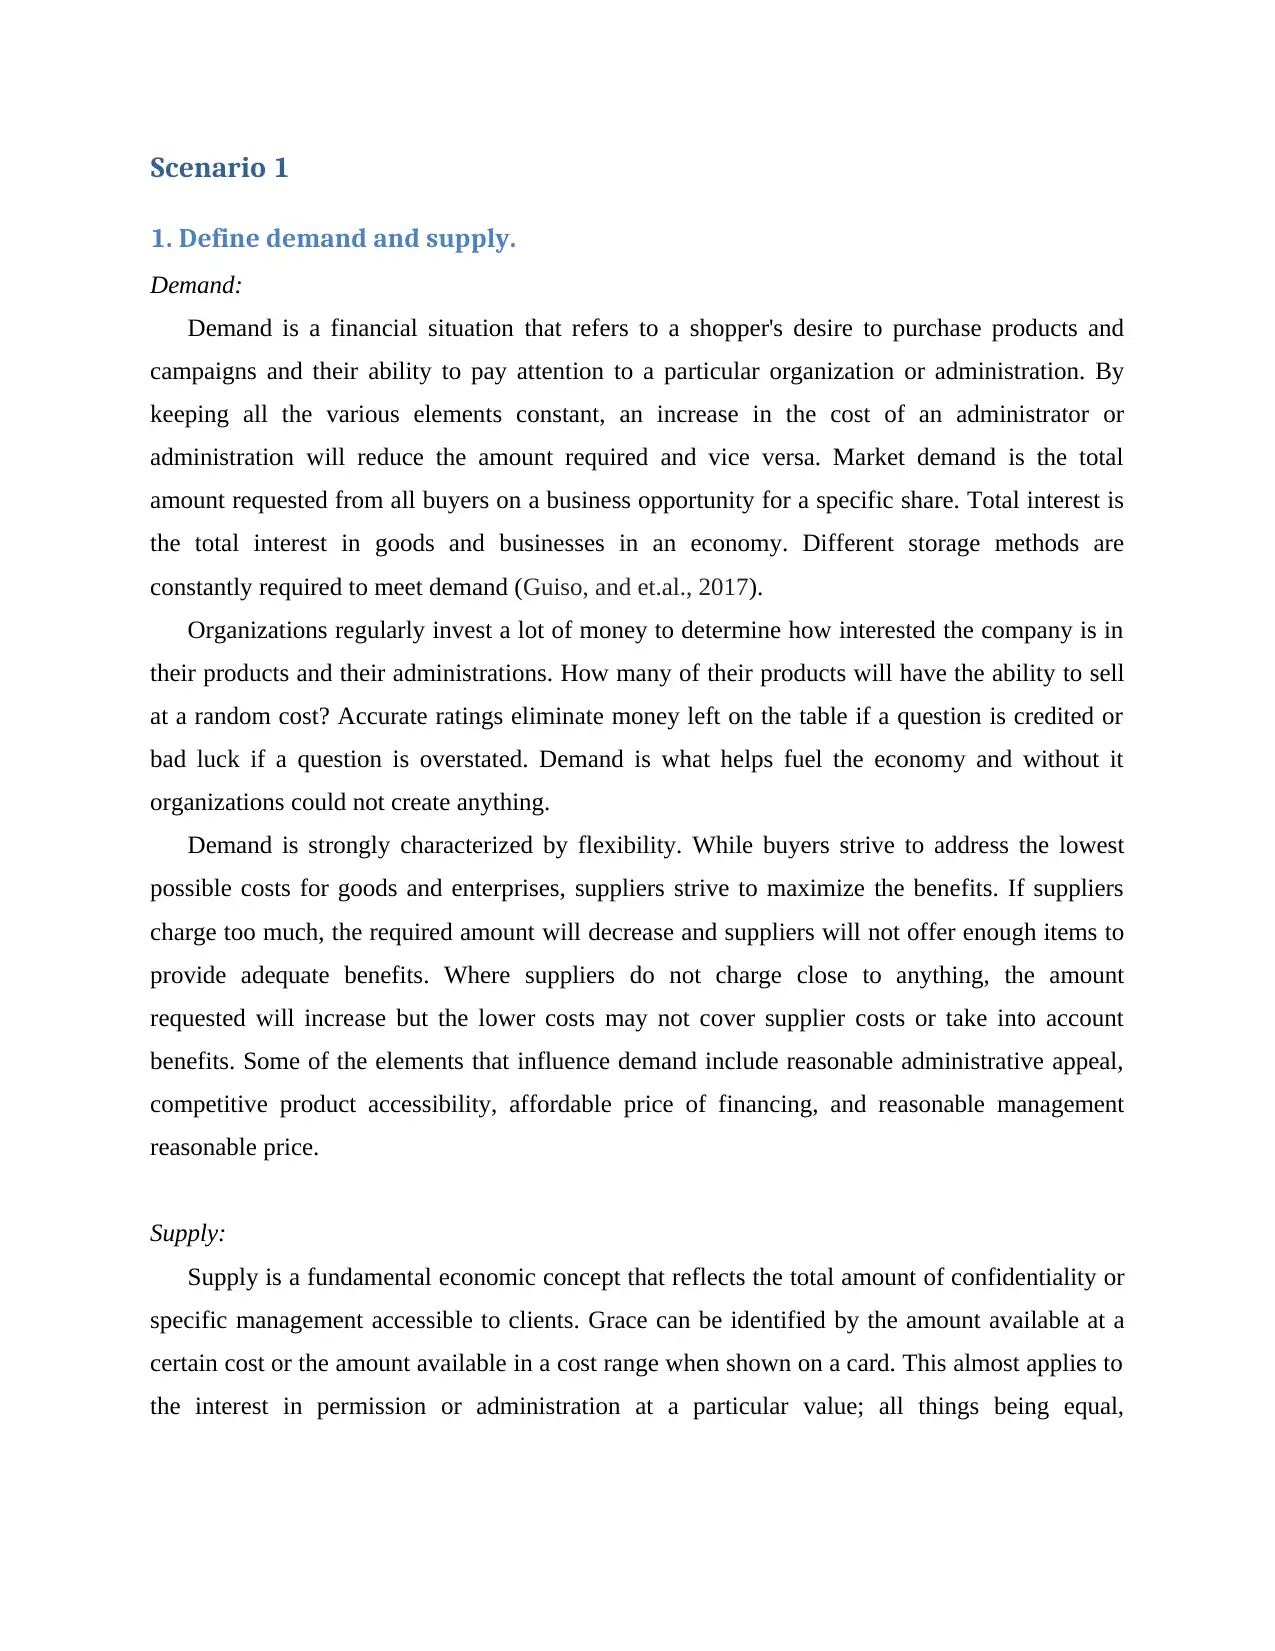
3. Diagram
As the diagram shows that price is constant but due to the factor COVID-19; the demand curve
has been shifted to right side and quantity demanded has increased from Q to Q1.
P
Q Q1
A change in price causes a movement along the demand curve. It can be compression (less
interest) or development / expansion.
In reality, a higher cost could improve the interest curve, but in the long run it could cause a
shift as customers face more stable costs (Pereira and Frazzon, 2020).
For example, if there was an increase in the cost of gasoline, the rate curve would improve
and less would be purchased. However, a decline in demand might be due to the unsatisfactory
general interest in gasoline.
However, in the long run, the demand curve may also shift to the left as people cope with
rising costs by finding options, for example, to buy an electric vehicle so they don't need
gasoline at this stage.
3. Diagram
As the diagram shows that price is constant but due to the factor COVID-19; the demand curve
has been shifted to right side and quantity demanded has increased from Q to Q1.
P
Q Q1
Paraphrase This Document
Need a fresh take? Get an instant paraphrase of this document with our AI Paraphraser
4. Main effects on the equilibrium price of video conferencing software.
There are some features that have driven the development of the market since the last decade, for
example, the key role of organizations in expanding their organizations to the global market and
the management of their workforce in different sectors support. Nonetheless, Covid's demise has
had a profound effect on the video conferencing market. The movement restriction limited the
scope of efforts in the unknown market, thus expanding the appropriateness of video
conferencing. Organizations are currently getting imaginative recording measurements by
designing video conferencing. Therefore, the legislator is using video conferencing to connect
with experts and officials from their own area and also from different countries (Casaburi and
Macchiavello, 2019).
The equilibrium price will shift upwards which will increase the product price. Demand is
increasing more rapidly than available supply; therefore equilibrium price will increase.
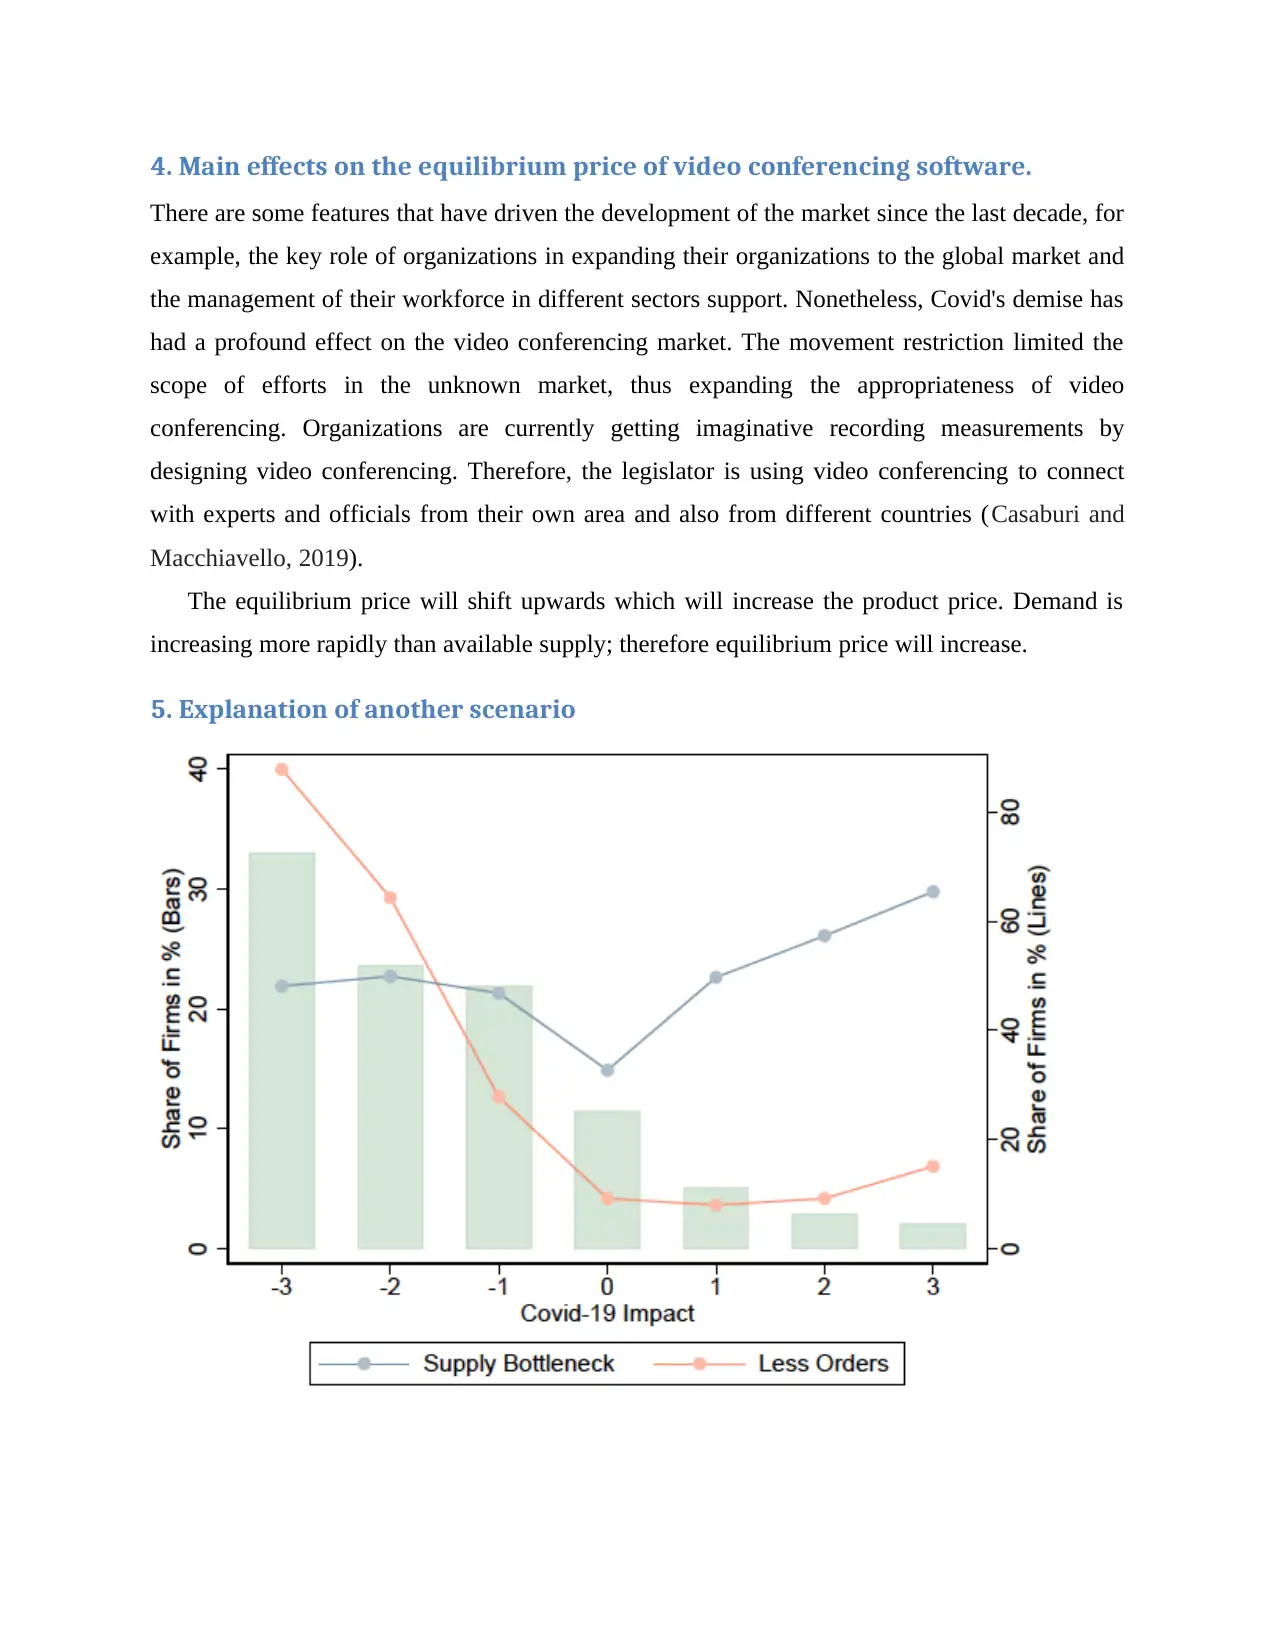
5. Explanation of another scenario
There are some features that have driven the development of the market since the last decade, for
example, the key role of organizations in expanding their organizations to the global market and
the management of their workforce in different sectors support. Nonetheless, Covid's demise has
had a profound effect on the video conferencing market. The movement restriction limited the
scope of efforts in the unknown market, thus expanding the appropriateness of video
conferencing. Organizations are currently getting imaginative recording measurements by
designing video conferencing. Therefore, the legislator is using video conferencing to connect
with experts and officials from their own area and also from different countries (Casaburi and
Macchiavello, 2019).
The equilibrium price will shift upwards which will increase the product price. Demand is
increasing more rapidly than available supply; therefore equilibrium price will increase.
5. Explanation of another scenario
Ahead of the crisis program, the German Car manufacturer's file value fell 0.8% in March, 1.9%
in April and 2.2% in May over the long term. To monitor various decisions on the behavior of
the value position and to capture the impact of Covid-19, we use the month-to-month data from
the ifo-BCS on the changes in value organized three months later. The organized value changes
of the companies in this study are a strong indication of the expansion of producer value from
quarter to quarter in the collection and sales / discount sectors. Testing this approach and
estimating value largely during the Covid-19 crisis, it is certain that products and short initiatives
are not accessible or flexible and the changes associated with consumption design. Reducing the
range of items is very important for government support. Javarel and O'Conell (2020) estimate
that forecast 85 will represent an increase in the average cost of basic items for the UK. Given
the German economy, Cavallo (2020) notes that official unilateral inflation data increased by just
0.09 lead from actual expansion, for example, adjusted for changes in customary conventional
design. Attention to changing organizational value is, in our opinion, reducing these concerns.
There is negative effect on equilibrium price because the equilibrium point is between -2 to -1.
Scenario 2:
1. Identify the market structures which the Malta International Airport and
Airmalta operate in
Airport revenue is directly related to traffic levels. Boycotts and flight stops drive fewer
flights, and therefore less inbound flight revenue. Unlike many parties in the avionics industry,
when traffic demand decreases, airports have limited ways to reduce costs. The cost of operating
the air facility remains unchanged and airports are unable to close or relocate airports and
airfields.
Another concept being considered is non-aircraft revenue, which is important, as aircraft
revenue alone cannot cover air termination activity and capital expenditures. For some air
borders in the region, non-airline revenue is the main source of revenue. In total, Asia-Pacific
airports account for up to 45% of their revenue from non-aviation sources. The decline in
passengers is having a major impact on the building and its wholesale concerns.
⊘ This is a preview!⊘
Do you want full access?
Subscribe today to unlock all pages.
Trusted by 1+ million students worldwide
From a human perspective, it has an added impact on the network and on all the teachers who
work with the various areas and specific groups of the airport. It has been common for retailers
and couriers to ask their employees to take unpaid leave at this critical time.
The market structure in which Malta International airport operate is monopoly and Airmalta
is operate in is commercial flights and lies under monopolistic competition where it has less
flights available and has less interference of passengers which also reflects that there will be less
impact on these Airports (Bayar, 2017).
2. Features of each market structure
The Market Structure refers to the characteristics of the market either organizational or
competitive, that describes the nature of competition and the pricing policy followed in the
market.
Oligopoly Market:
Oligopoly is a market structure with very few companies, none of which can prevent others from
having a big impact. The focus portion measures the pie portion of the largest companies. The
barrier infrastructure is one company, the duopoly is two companies and the oligopoly is at least
two companies. The biggest real cut in company size is not in oligopoly, but the number must be
low enough for one company's business to completely outperform the others (Bayar, 2017).
Conditions that allow oligopolies to exist include high participation costs in the uses of
capital, legitimate earnings (permission to use remote areas or land for railways), and a degree
that increase motivation with more customers (e.g. online media). Global technological and trade
changes have changed some of these conditions: the creation of a side to the sea and the rise of
"smaller than expected factories" have affected the steel industry, for example. Instead of a
workplace programming application, Microsoft was targeted by Google Docs, which Google
supported using money from its web analytics business.
Monopolistic competition
Monopolistic competition is a key point between restrictive infrastructure and extreme conflict
(just hypothetical state) and the union of parts of each. All monopoly conflict groups have equal,
generally low, market power; they are all value creators. In the long run, demand is highly
flexible, making it difficult to assess changes. In the short term, the financial gain is positive, but
Paraphrase This Document
Need a fresh take? Get an instant paraphrase of this document with our AI Paraphraser
in the long run it will be close to zero. Companies in conflict with a monopoly are usually
strongly motivated.
Monopoly competition is a type of conflict that involves various activities that are natural to
buyers in their daily lives. Models include cafes, boutiques, clothing and appliances for
customers. To represent the conflict characteristics of a monopoly, we will use the case of
household cleaning products.
Monopolistic competition in general encourages heavy advertising, because different
companies like Airmalta have to identify relatively comparable elements. An organization can
choose to reduce the cost of their cleaning item, providing a higher total income as a trade, in a
perfect world, for a higher business. Another could take the opposite course, increasing costs and
using an organization that recommends quality and improvement. Third parties can sell
themselves as being more environmentally friendly, using a “green” symbolism and displaying
the blessing of a natural watch group (which may be okay for several brands, but not displayed).
In fact, all brands can have the same success (Kononenko and Kugai, 2019).
3. Distinguish between two market structures.
There are some similarities in monopoly and monopolistic competition, but there are also a
number of important differences. Both are examples of conflict that can be found by following a
structure between the goals of a brilliant conflict and an elegant business model. However, there
aren't many large companies in an oligopoly, and a large number of small companies are in
monopoly conflict. The lonely line between oligopoly and monopoly conflict may be hidden due
to the number of companies in the industry (Bayar, 2017).
The monopoly market is represented by a single owner and dealer of goods without any
agent. This indicates that the monopolist is decreasing an interest curve and can choose the cost
of selling his item. There are high barriers to division for another company in harmony.
Monopoly conflict differs from individual conflict in that it cannot be identified by objects. Each
company separates its products from different companies through a variety of differences in the
quality of articles, key articles and advertising. Companies opposed to the monopoly conflict are
decreasing demand, but the interest is not entirely flexible. The block chain infrastructure, on the
other hand, is represented by a single company that delivers the object. In between is monopoly
conflict (different groups with separate objects) and oligopoly (almost all groups complain
differently).
The application of the product source of the trading companies comes from components,
for example, copyrights or licenses. Authority over the funds specifically needed to do this could
be another source of intensity for a union firm. As a general rule, the public authority maintains
strength of the business model. Monopolists are valuable researchers because they have
insufficient data on advertising demand. They should explore different ways of spending to find
the one that is profitable.
Malta international airport has only two competitors and it has covered large area large
number of flights could access this airport. This airport covers most of the destinations, due to
which passengers have high demand and there's usually rush here. Malta international airport has
monopoly over other domestic airports.
Air Malta which lies under monopolistic competition serves different product service in
terms of timely take off and landing of flights and providing necessary convenience such as
eatable shops, medical facilities, ATM and massage room which makes it different from other
airports and is an example of monopolistic competition because it serves passengers with
differentiation in product.
4. Diagram for market structure
Short run Oligopoly
⊘ This is a preview!⊘
Do you want full access?
Subscribe today to unlock all pages.
Trusted by 1+ million students worldwide
1 out of 21
Related Documents


Your All-in-One AI-Powered Toolkit for Academic Success.
+13062052269
info@desklib.com
Available 24*7 on WhatsApp / Email
![[object Object]](/_next/static/media/star-bottom.7253800d.svg)
Unlock your academic potential
Copyright © 2020–2026 A2Z Services. All Rights Reserved. Developed and managed by ZUCOL.