EMBA04 Economics Report: Analysis of COVID-19's Economic Consequences
VerifiedAdded on 2023/01/06
|19
|5111
|24
Report
AI Summary
This economics report examines the economic consequences of the COVID-19 pandemic, focusing on shifts in demand and supply, market structures, and macroeconomic indicators. The report begins by defining demand and supply, distinguishing between shifts and movements along the demand function, and illustrating these concepts with the surge in video conferencing software demand. It analyzes the impact of the pandemic on equilibrium prices in the video conferencing market and presents similar scenarios, such as the hand sanitizer market, to illustrate the effects of changes in demand. The report then explores the market structure of Malta International Airport and Air Malta, considering monopolistic competition and oligopoly. The study further investigates the pandemic's effects on unemployment and GDP, and government deficits. The report concludes with a synthesis of the findings and a discussion of the pandemic's broad economic impacts.

Economics
Paraphrase This Document
Need a fresh take? Get an instant paraphrase of this document with our AI Paraphraser
Table of Contents
INTRODUCTION...........................................................................................................................3
CASE SCENARIO 1.......................................................................................................................3
1. Definition of demand and supply.............................................................................................3
2. Distinction between shift and movement along the demand function.....................................4
3. Explanation of the case scenario using a diagram...................................................................7
4. Impact on equilibrium price of video conferencing software post the COVID-19 pandemic.8
5. Changes in demand and equilibrium price due to COVID-19 pandemic: A Similar scenario 8
Scenario 2.......................................................................................................................................10
COVID 19 outbreak on The Malta International Airport and Malta.........................................10
Scenario 3.......................................................................................................................................16
COVID 19 outbreak unemployment .........................................................................................16
Scenario 4.......................................................................................................................................19
COVID 19 effect on GDP and Government Deficit .................................................................19
CONCLUSION .............................................................................................................................21
REFERENCES..............................................................................................................................21
Maastricht Treaty, 2020. [Online]. Available Through:................................................................22
INTRODUCTION
Concepts of economic involve various concepts such as law of demand, supply and
different other. IN this report various concepts associated with economics would be projected.
Demand and supply concepts of economics will be discussed. Effects on equilibrium price would
also demonstrate due to covid will also explain. Factors affect demand would also be explained
in this report. Market structure of Air Malta would be evaluated. Features and different aspects
of market would be analysis. Impact of COVID 19 over unemployment would be emphasis in
this report. How the pandemic at global level afftected the unem,ployment rate in country would
also project in this report. Furthermore, this report will also project in what ways COVID could
influence gross domestic product of country.
CASE SCENARIO 1
1. Definition of demand and supply
Demand refers to the amount or quantity of goods and services that consumers are able
and willing to buy at a specific price. When a consumer pays for a unit of a particular service or
good using price, total number of units that are bought at that price is called quantity
demanded. Demand and price are inversely related, which means that a rise in price of goods or
services would decrease demand. Supply is amount of goods and services that a producer or
supplier is willing to manufacture or supply at a specific price. Price is consideration that a
supplier receives in exchange for one unit of a service or good. An increase in price always
leads to a rise in quantity supplied, this direct relation between price (Guiso and et.al., 2017).
2. Distinction between shift and movement along the demand function
Demand function is a description of a relationship between a variable and its
determinants. It determines the quantity of goods that is purchased at particular prices or
alternative values due to change in tastes and preferences of consumers, number of customers,
income level of price of related or complementary goods etc.
⊘ This is a preview!⊘
Do you want full access?
Subscribe today to unlock all pages.
Trusted by 1+ million students worldwide

For example, there has been a huge surge in the demand of video chat and video
conferencing applications. This scenario will be used to explain the movement of shift of the
demand function graphically, indicated by movement and shift of demand curve.
A movement along the demand curve denotes a change in price as well as quantity
demanded from one point to the snother . This movement is implying that demand relationship is
consistent, and this movement happens when the price of video-calling/conferencing apps
Illustration 1: Growth in Videoconferencing apps
Source: Sarah Perez, 2020
Paraphrase This Document
Need a fresh take? Get an instant paraphrase of this document with our AI Paraphraser

changes and the quantity that is demanded also changes in accordance with original demand
(Dean and et.al., 2020). There is a change in price which is only caused by change in the
demand and vice versa. The red line in the above graph denotes demand curve for video-
calling applications, and assuming that P is the current price for a particular app that is $10 and
current demand is Q, assuming 40 million downloads. When there is a change in price and it
increases to p1= $12 quantity demanded (e1) will decrease to 35 million downloads. The price
here is only cause for reduction in demand.
On the other hand, the shift along the demand function happens when the price of the
good remains constant, i.e., price of videoconferencing and video-chat applications remain
constant, and there is a noticeable change in quantity demanded. This change in demand is
affected by another factor. In present case scenario, Covid-19 pandemic has completely
eliminated casual socializing and office work, due to which most work started happening from
home and people started using video chat apps for interaction. This sudden change in situation
led to a huge increase in worldwide demand of these applications from around $40 million
downloads in February 2020, to above 60 million downloads in March 2020. In this case, there
was no change in price but the quantity demanded still changed. This explains shift in the
demand curve in above graph.
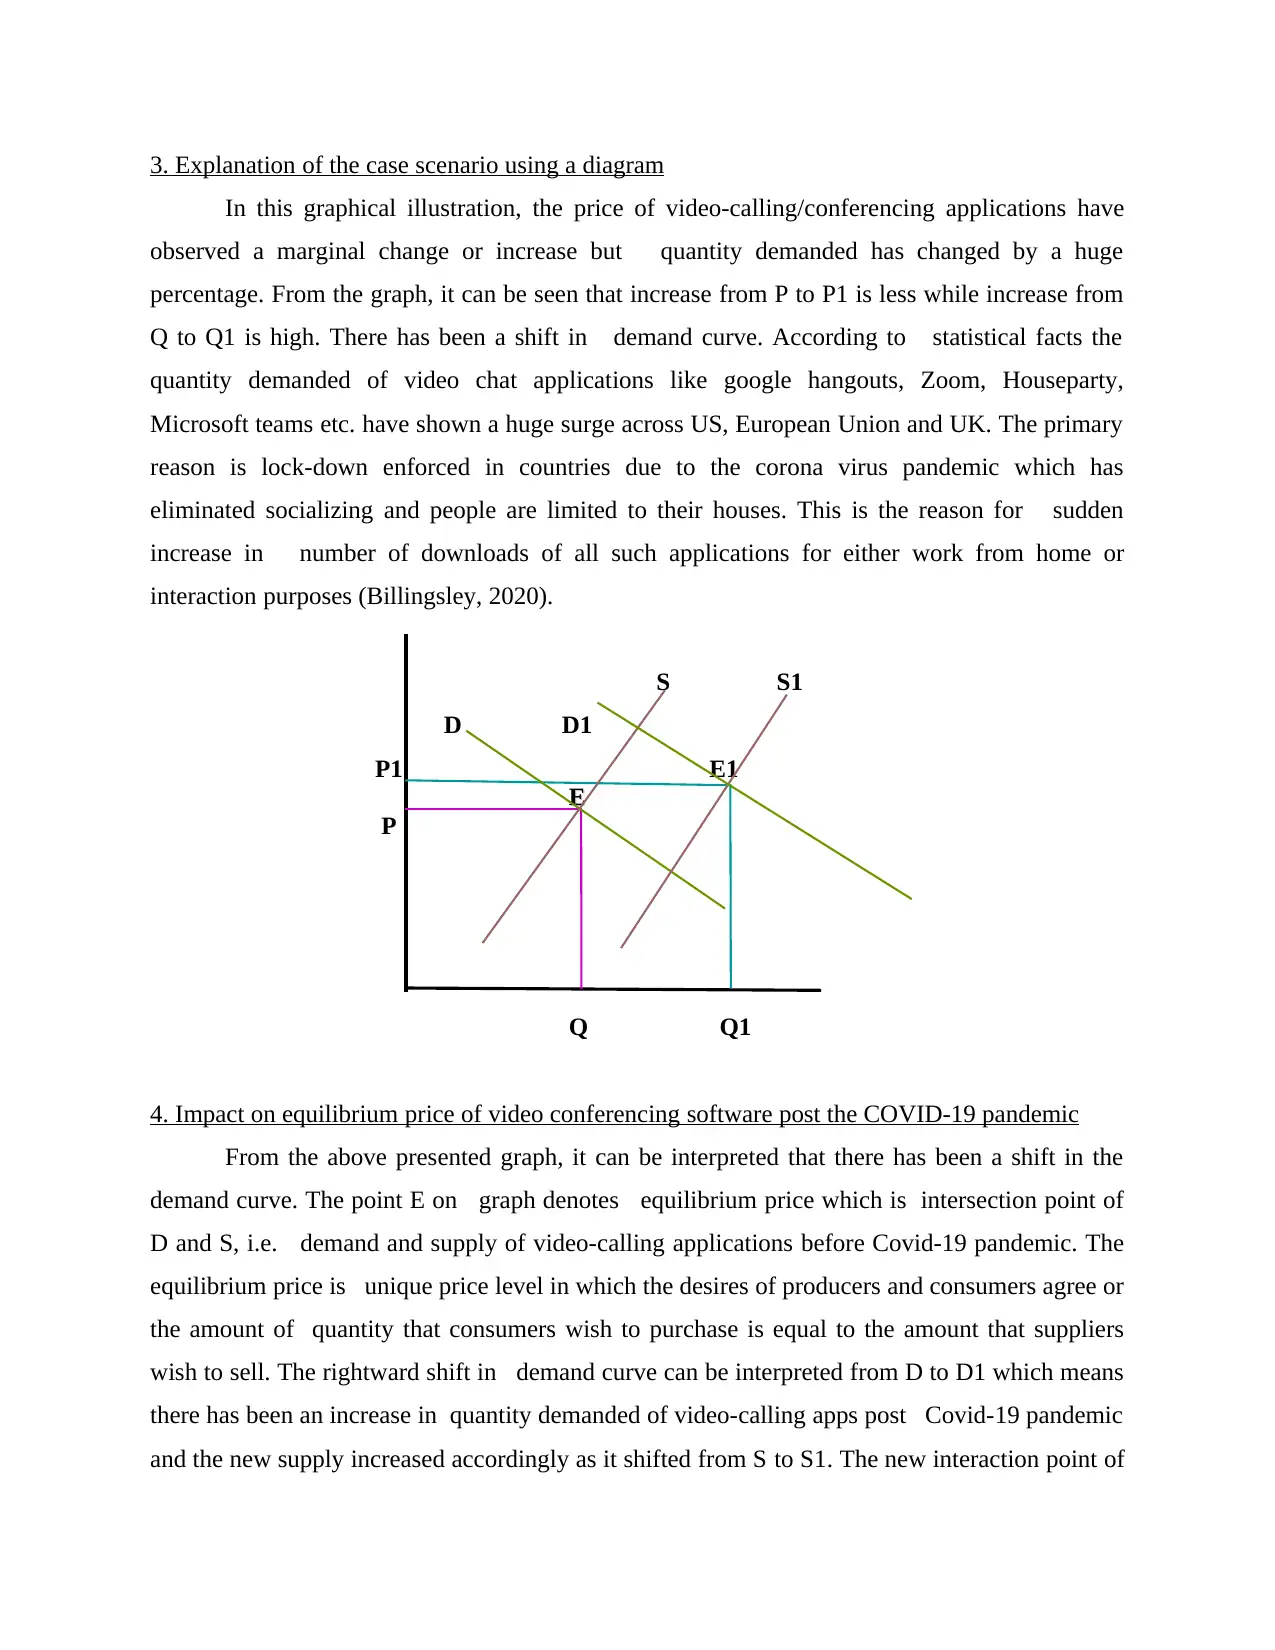
3. Explanation of the case scenario using a diagram
In this graphical illustration, the price of video-calling/conferencing applications have
observed a marginal change or increase but quantity demanded has changed by a huge
percentage. From the graph, it can be seen that increase from P to P1 is less while increase from
Q to Q1 is high. There has been a shift in demand curve. According to statistical facts the
quantity demanded of video chat applications like google hangouts, Zoom, Houseparty,
Microsoft teams etc. have shown a huge surge across US, European Union and UK. The primary
reason is lock-down enforced in countries due to the corona virus pandemic which has
eliminated socializing and people are limited to their houses. This is the reason for sudden
increase in number of downloads of all such applications for either work from home or
interaction purposes (Billingsley, 2020).
S S1
D D1
P1 E1
EE
P
Q Q1
4. Impact on equilibrium price of video conferencing software post the COVID-19 pandemic
From the above presented graph, it can be interpreted that there has been a shift in the
demand curve. The point E on graph denotes equilibrium price which is intersection point of
D and S, i.e. demand and supply of video-calling applications before Covid-19 pandemic. The
equilibrium price is unique price level in which the desires of producers and consumers agree or
the amount of quantity that consumers wish to purchase is equal to the amount that suppliers
wish to sell. The rightward shift in demand curve can be interpreted from D to D1 which means
there has been an increase in quantity demanded of video-calling apps post Covid-19 pandemic
and the new supply increased accordingly as it shifted from S to S1. The new interaction point of
⊘ This is a preview!⊘
Do you want full access?
Subscribe today to unlock all pages.
Trusted by 1+ million students worldwide
D1 and S1 is E1 which determines the current equilibrium price. Equilibrium denotes a balanced
market which is efficient and balances the quantity supplied and demanded (Glasserman and
Nouri, 2016).
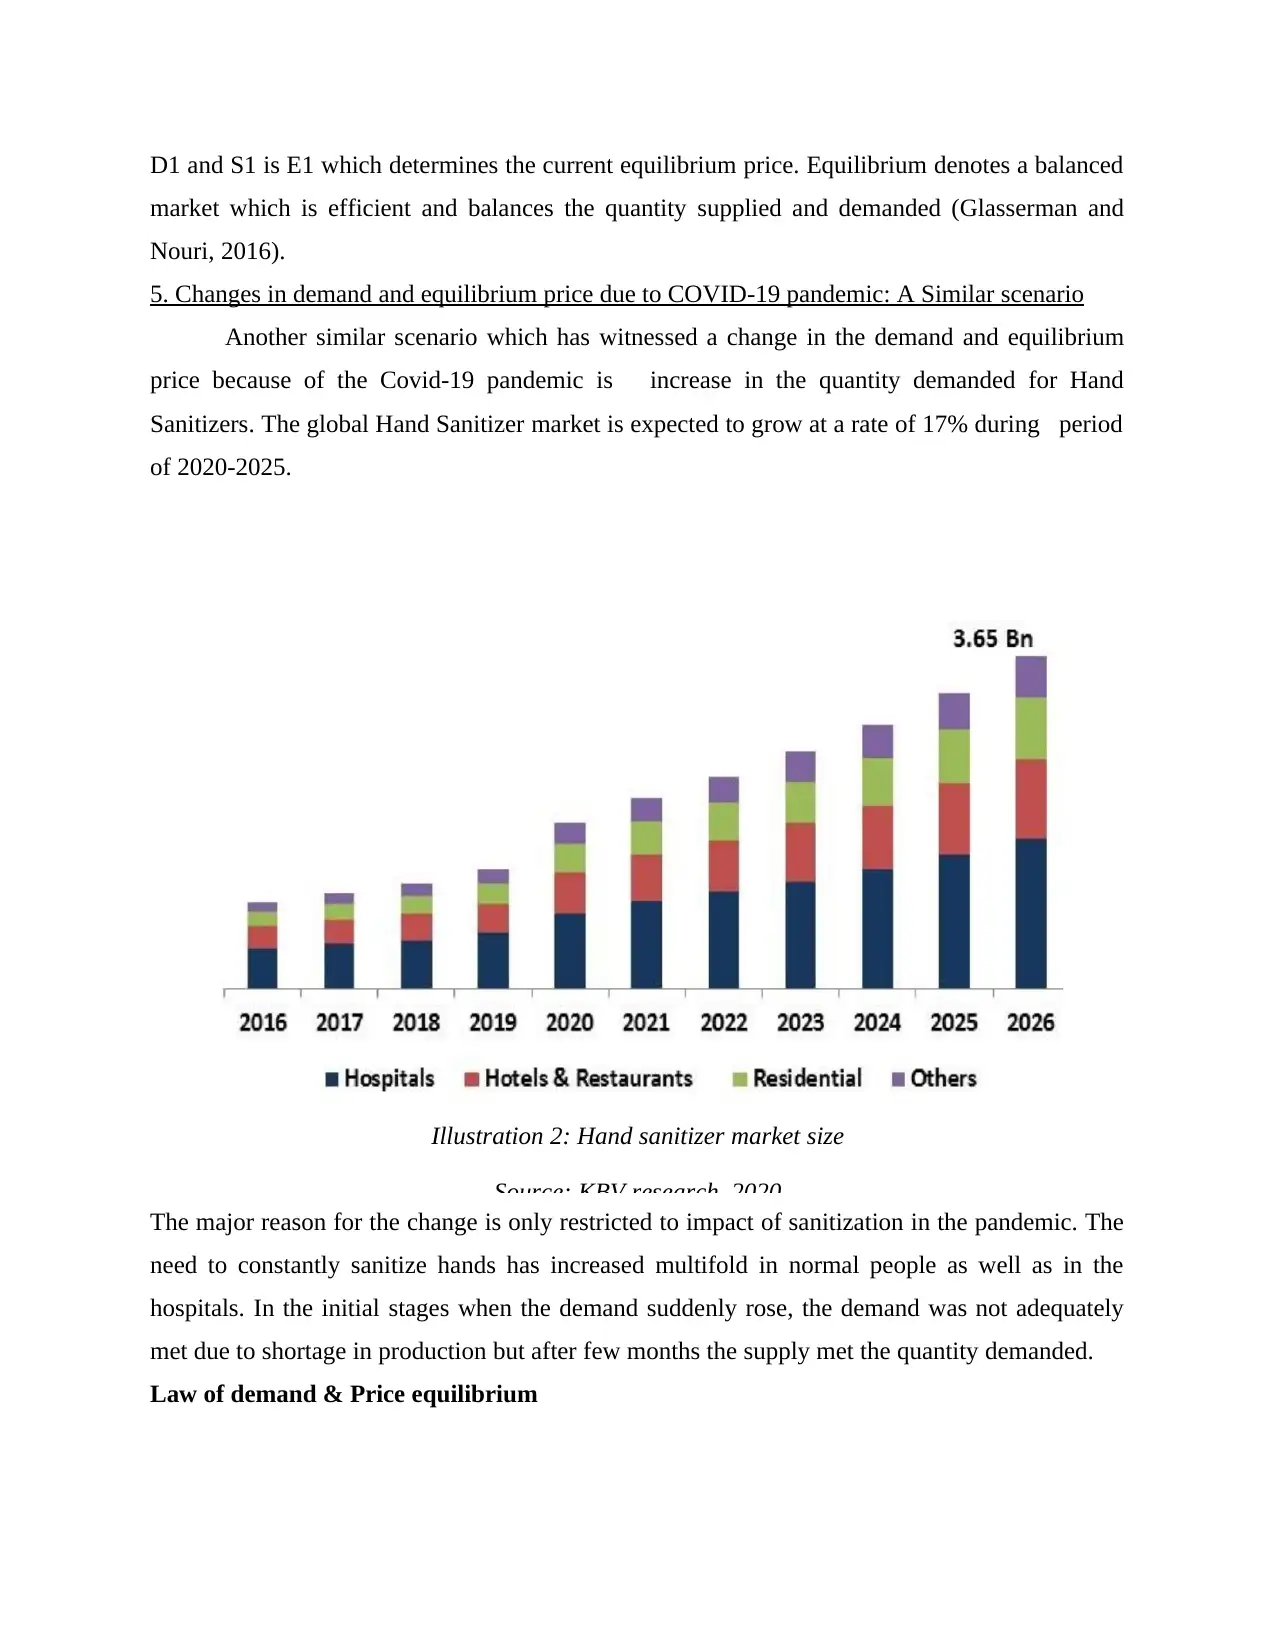
5. Changes in demand and equilibrium price due to COVID-19 pandemic: A Similar scenario
Another similar scenario which has witnessed a change in the demand and equilibrium
price because of the Covid-19 pandemic is increase in the quantity demanded for Hand
Sanitizers. The global Hand Sanitizer market is expected to grow at a rate of 17% during period
of 2020-2025.
The major reason for the change is only restricted to impact of sanitization in the pandemic. The
need to constantly sanitize hands has increased multifold in normal people as well as in the
hospitals. In the initial stages when the demand suddenly rose, the demand was not adequately
met due to shortage in production but after few months the supply met the quantity demanded.
Law of demand & Price equilibrium
Illustration 2: Hand sanitizer market size
Source: KBV research, 2020
market which is efficient and balances the quantity supplied and demanded (Glasserman and
Nouri, 2016).
5. Changes in demand and equilibrium price due to COVID-19 pandemic: A Similar scenario
Another similar scenario which has witnessed a change in the demand and equilibrium
price because of the Covid-19 pandemic is increase in the quantity demanded for Hand
Sanitizers. The global Hand Sanitizer market is expected to grow at a rate of 17% during period
of 2020-2025.
The major reason for the change is only restricted to impact of sanitization in the pandemic. The
need to constantly sanitize hands has increased multifold in normal people as well as in the
hospitals. In the initial stages when the demand suddenly rose, the demand was not adequately
met due to shortage in production but after few months the supply met the quantity demanded.
Law of demand & Price equilibrium
Illustration 2: Hand sanitizer market size
Source: KBV research, 2020
Paraphrase This Document
Need a fresh take? Get an instant paraphrase of this document with our AI Paraphraser
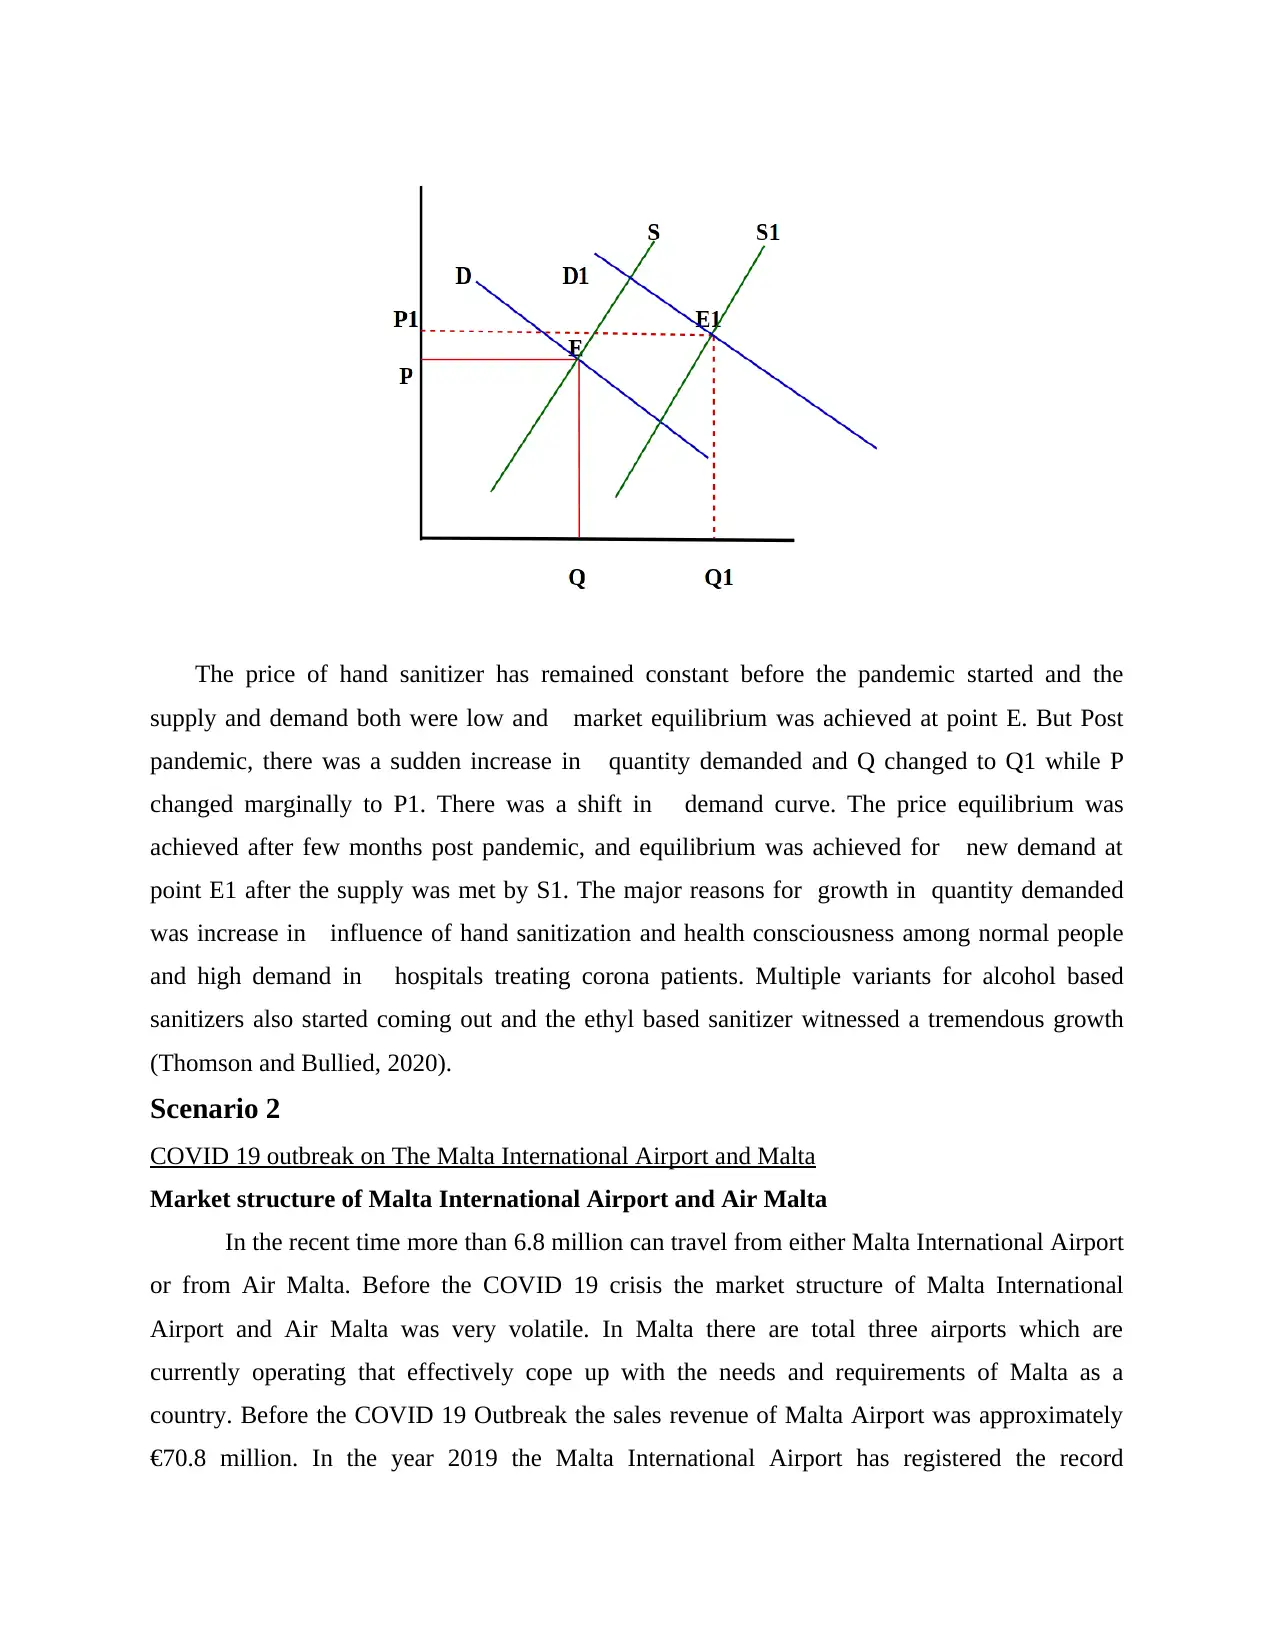
The price of hand sanitizer has remained constant before the pandemic started and the
supply and demand both were low and market equilibrium was achieved at point E. But Post
pandemic, there was a sudden increase in quantity demanded and Q changed to Q1 while P
changed marginally to P1. There was a shift in demand curve. The price equilibrium was
achieved after few months post pandemic, and equilibrium was achieved for new demand at
point E1 after the supply was met by S1. The major reasons for growth in quantity demanded
was increase in influence of hand sanitization and health consciousness among normal people
and high demand in hospitals treating corona patients. Multiple variants for alcohol based
sanitizers also started coming out and the ethyl based sanitizer witnessed a tremendous growth
(Thomson and Bullied, 2020).
Scenario 2
COVID 19 outbreak on The Malta International Airport and Malta
Market structure of Malta International Airport and Air Malta
In the recent time more than 6.8 million can travel from either Malta International Airport
or from Air Malta. Before the COVID 19 crisis the market structure of Malta International
Airport and Air Malta was very volatile. In Malta there are total three airports which are
currently operating that effectively cope up with the needs and requirements of Malta as a
country. Before the COVID 19 Outbreak the sales revenue of Malta Airport was approximately
€70.8 million. In the year 2019 the Malta International Airport has registered the record

passengers travelling from the airport was approximately 7310289 in number (Marinescu,
Skandalis and Zhao, 2020). From the Malta Intergenerational Airport 25 different airlines are
operating its business and operate flights to different locations all around the world. It can be
projected that market structure of Malta International Airport was open as flights are departed to
all the major airports all across the globe. Engaged routes of Malta Airport can be projected to
London, Leonardo de vinci Fiumcino and many other such popular airports at a global level. Air
Malta operate total 9 flights from the Malta International Airport and two other locations of
Malta. Air Malta is among the top prioritised airline brand at Malta International Airport. Due to
its native aspect government also promote this airline to attract more passengers travelling from
this airline. Air Malta depart to 39 different locations across the globe. IT can be projected that
company could effective deal with the international traffic in a very systematic manner.
It can be projected that market structure at Malta International Airport is projected as
competitive structure from the above analysis. Monopolistic competition can also be projected as
market structure. Competitive structure can be denoted due to all top airlines across the globe are
operating their business in Malta International Airport. Monopoly can be denoted due to
government support to Air Malta which also support the airline in attracting more passengers at
all its business locations from Malta International Airport. In case of monopoly it can be denoted
as in respect to Malta International Airport and Air Malta there is not pure monopoly can be
addressed as the airline and airport do not cater any specific service that is unavailable at any
other location across the globe. Services are almost similar at all locations but on some ground,
monopoly can be entertained in respect to Air Malta such as the services are luxury in a very
affordable price range and many such services that create a unique impression over passengers
travel from Air Malta Company.
Feature of each market segment
Market segment are denoted as monopolistic competition and oligopoly associated with
Malta International Airport and Air Malta.
Monopolistic competition: Monopolistic market structure is denoted as the market structure
where many companies are engaged in the competition of market. In case of Malta International
Airport and Air Malta many companies are engaged in catering services at the airport. Other
companies like Spice Jet and many other which are catering healthy level of competition to
company (Bauer and Weber, 2020). Products are remarkably similar in context to this market
⊘ This is a preview!⊘
Do you want full access?
Subscribe today to unlock all pages.
Trusted by 1+ million students worldwide
segment. All companies offer similar range of products as it can be projected that there is not any
major differentiation between the products offer by all companies.
Oligopoly: The Malta International Airport and Air Malta are associated with the oligopoly
market segment. In this market segment only the limited number of companies are involved in
associating business services. Malta International Airport offers numerous airlines abut only in
limited number. Not all international airlines are operating their business at Malta International
Airport. This aspect of the airport associates the airport with the market segment denoted as
oligopoly. In this market segment even the new companies and entity get to establish their
businesses in short run also.
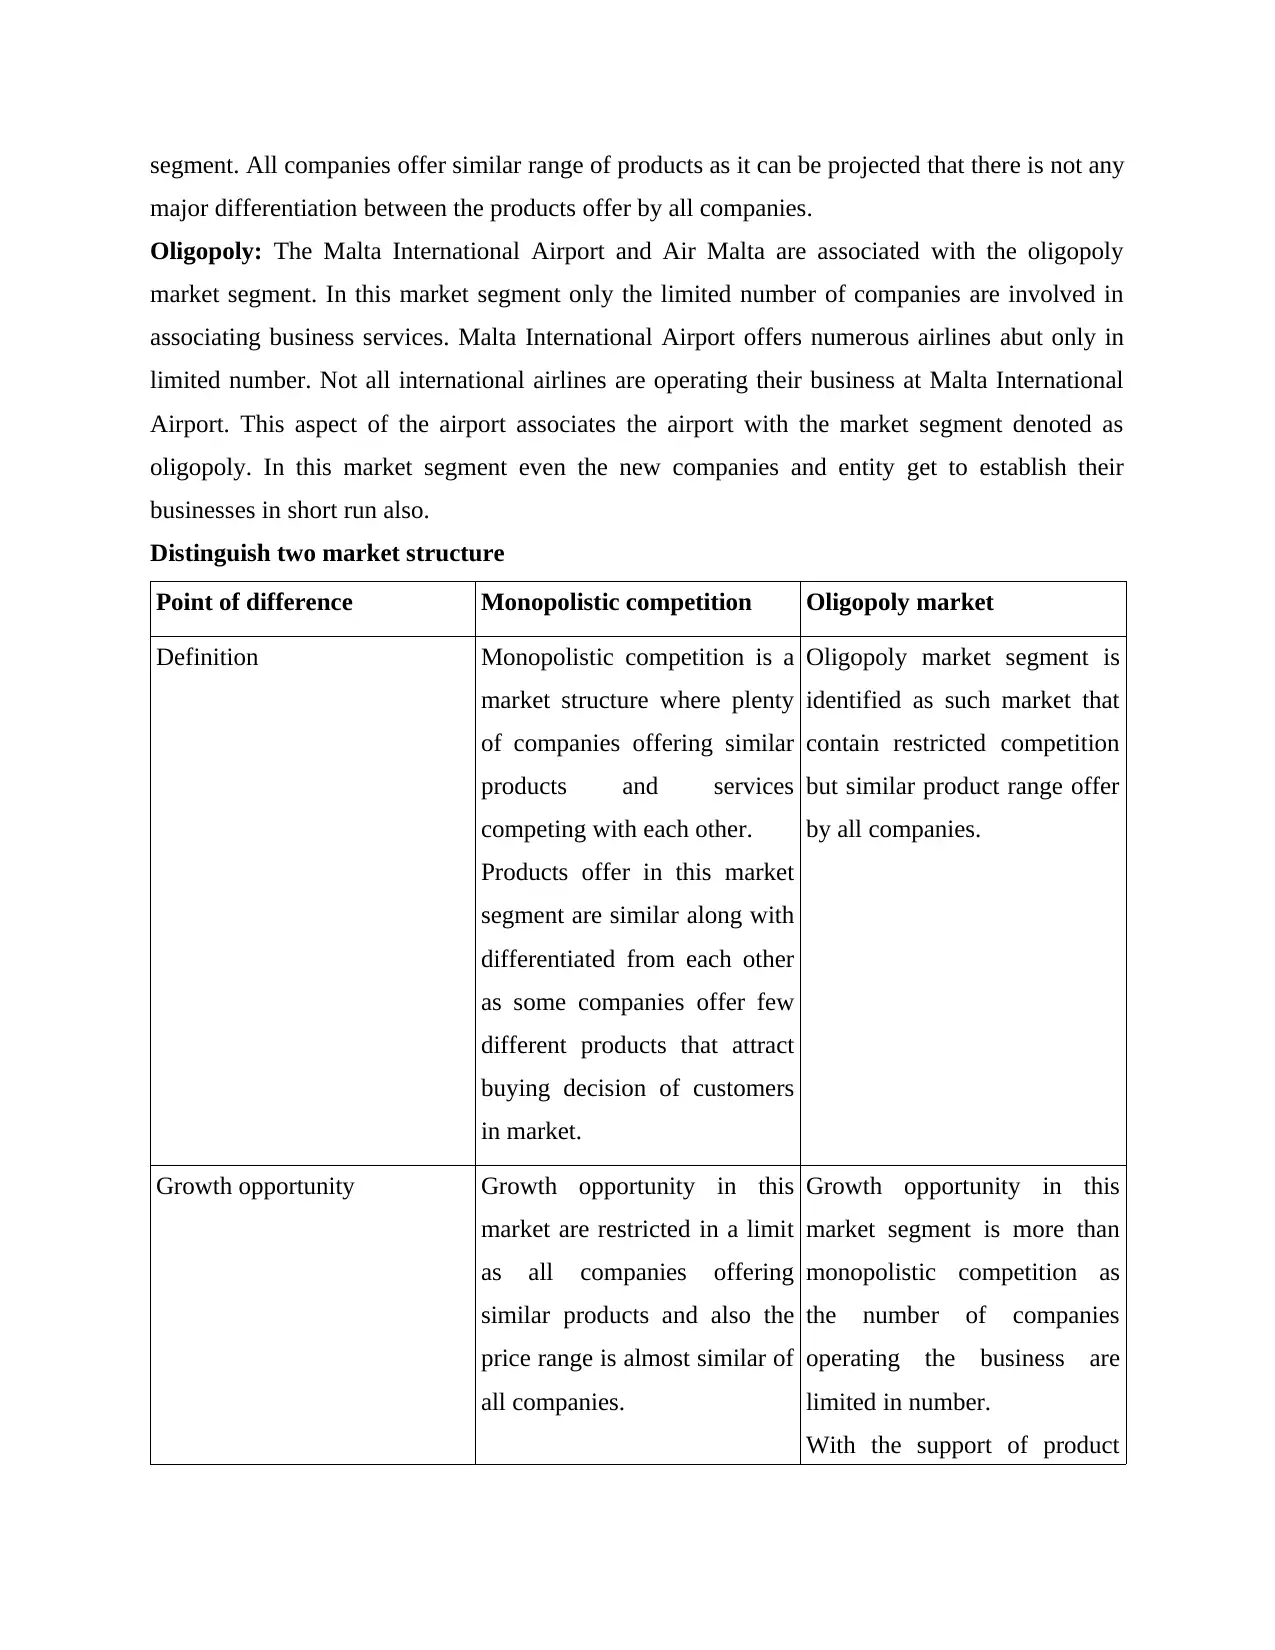
Distinguish two market structure
Point of difference Monopolistic competition Oligopoly market
Definition Monopolistic competition is a
market structure where plenty
of companies offering similar
products and services
competing with each other.
Products offer in this market
segment are similar along with
differentiated from each other
as some companies offer few
different products that attract
buying decision of customers
in market.
Oligopoly market segment is
identified as such market that
contain restricted competition
but similar product range offer
by all companies.
Growth opportunity Growth opportunity in this
market are restricted in a limit
as all companies offering
similar products and also the
price range is almost similar of
all companies.
Growth opportunity in this
market segment is more than
monopolistic competition as
the number of companies
operating the business are
limited in number.
With the support of product
major differentiation between the products offer by all companies.
Oligopoly: The Malta International Airport and Air Malta are associated with the oligopoly
market segment. In this market segment only the limited number of companies are involved in
associating business services. Malta International Airport offers numerous airlines abut only in
limited number. Not all international airlines are operating their business at Malta International
Airport. This aspect of the airport associates the airport with the market segment denoted as
oligopoly. In this market segment even the new companies and entity get to establish their
businesses in short run also.
Distinguish two market structure
Point of difference Monopolistic competition Oligopoly market
Definition Monopolistic competition is a
market structure where plenty
of companies offering similar
products and services
competing with each other.
Products offer in this market
segment are similar along with
differentiated from each other
as some companies offer few
different products that attract
buying decision of customers
in market.
Oligopoly market segment is
identified as such market that
contain restricted competition
but similar product range offer
by all companies.
Growth opportunity Growth opportunity in this
market are restricted in a limit
as all companies offering
similar products and also the
price range is almost similar of
all companies.
Growth opportunity in this
market segment is more than
monopolistic competition as
the number of companies
operating the business are
limited in number.
With the support of product
Paraphrase This Document
Need a fresh take? Get an instant paraphrase of this document with our AI Paraphraser

differentiation companies get
to channelise competitive
advantages in market.
Diagram for each market segment
Growth are different in all various market segments. As every market caters its own level
of competition and demand which directly impact over growth of companies. Growth diagram
for different market segment can be stated in the following manner.
Monopolistic competition
(Wolfermann, 2016)
In short run companies take time to get established in case of monopolistic competition.
Number of competitors are heavy that are involved in selling products. Air Malta Company
needs to compete with all different competitors like Spice Jet and many other that caters the
aggressive level. IN short run company might not entertain healthy profitability even in many
cases company require to suffer losses in short run due to healthy level of market competition. In
recent time many companies along with the Air Malta needed to face losses due to COVID 19
crisis all across the globe (Sera, Abafita and Berecha, 2020). The crisis could result into reduced
demand of the airlines and all different public transportation.
Oligopoly market

(Bairoliya and Imrohoroglu, 2020)
Oligopoly market caters limited level of market competition which allow companies to
entertain profitability even in short span of time. This market allows small companies and new
entrants to entertain profits even in the initial time of business. Oligopoly market segment do not
cater aggressive level of market competition due to limited number of companies conducting
business operations in market.
Comparative analysis of two market segments with perfect competition
Both the market segments identified like monopolistic competition and oligopoly market
segment are different from perfect competition. As company carry the power to influence the
entire industry unless like perfectly competition where single entity do not contain power to
influence the industry. Airline industry is also not associated with the perfectly competition
market as only few industries are a part of this market segment.
Scenario 3
COVID 19 outbreak unemployment
Unemployment
Unemployment is defined as when a person not being able to find the job. In case of
unemployment even after having the eligibility and education background individuals not able to
find the job. All such individuals who are not able to find the job are called as unemployed.
COVID 19 impact over unemployment
⊘ This is a preview!⊘
Do you want full access?
Subscribe today to unlock all pages.
Trusted by 1+ million students worldwide
1 out of 19
Related Documents


Your All-in-One AI-Powered Toolkit for Academic Success.
+13062052269
info@desklib.com
Available 24*7 on WhatsApp / Email
![[object Object]](/_next/static/media/star-bottom.7253800d.svg)
Unlock your academic potential
Copyright © 2020–2026 A2Z Services. All Rights Reserved. Developed and managed by ZUCOL.