Economics Assignment: Economics for Decision Making S2 2019
VerifiedAdded on 2022/09/18
|12
|1496
|24
Homework Assignment
AI Summary
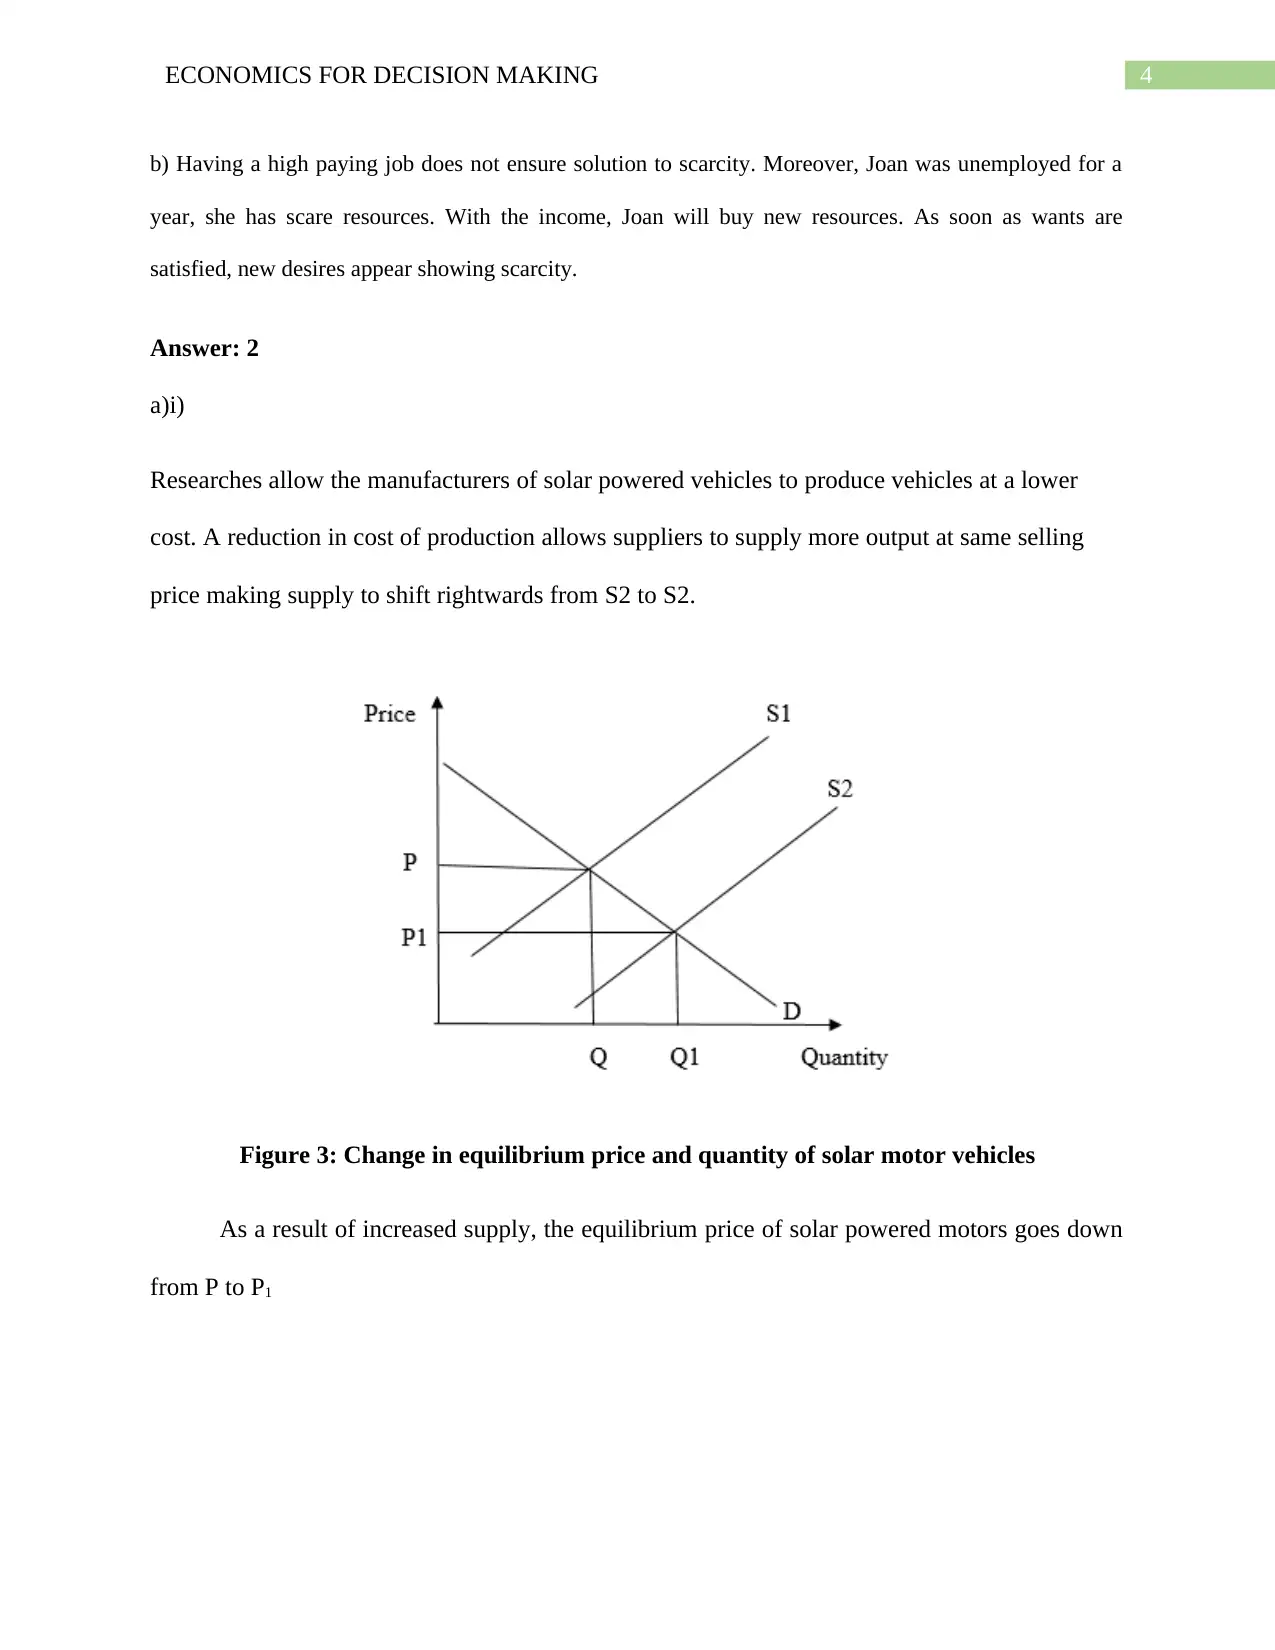
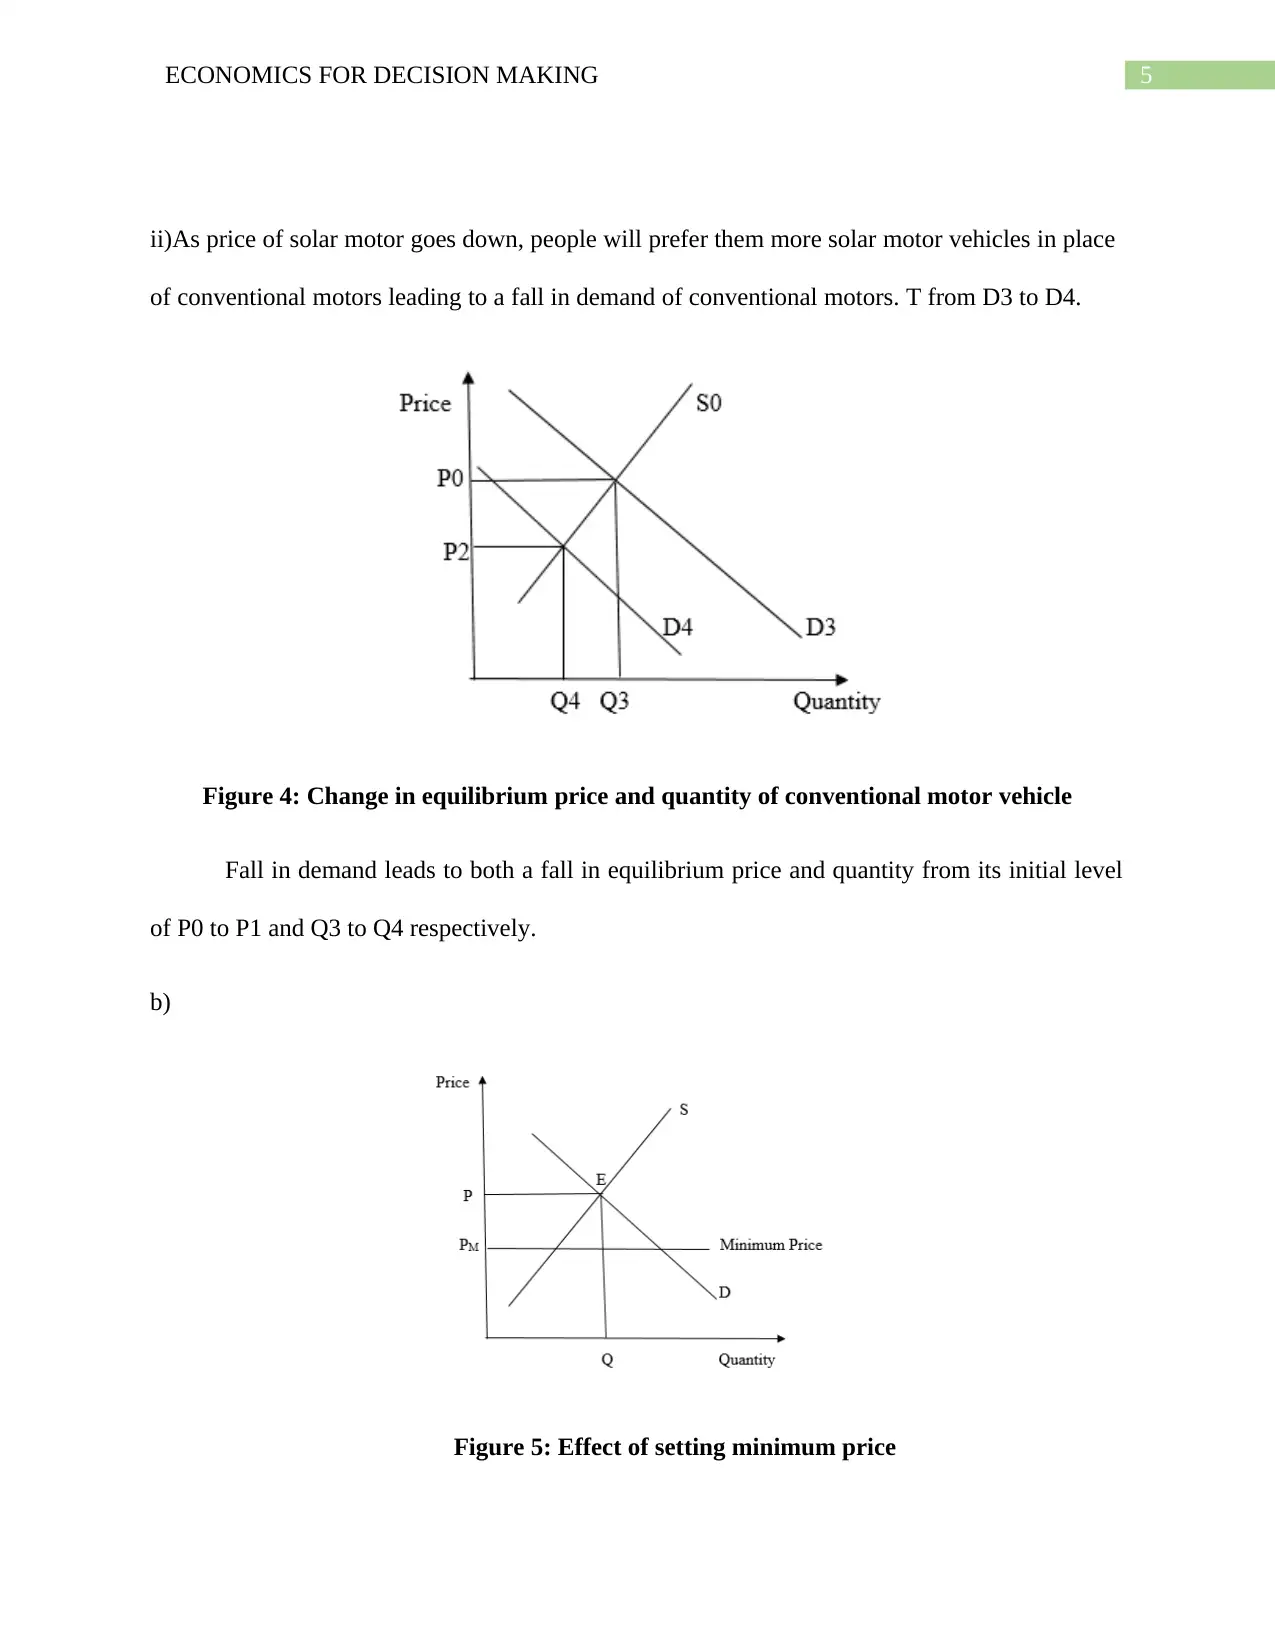
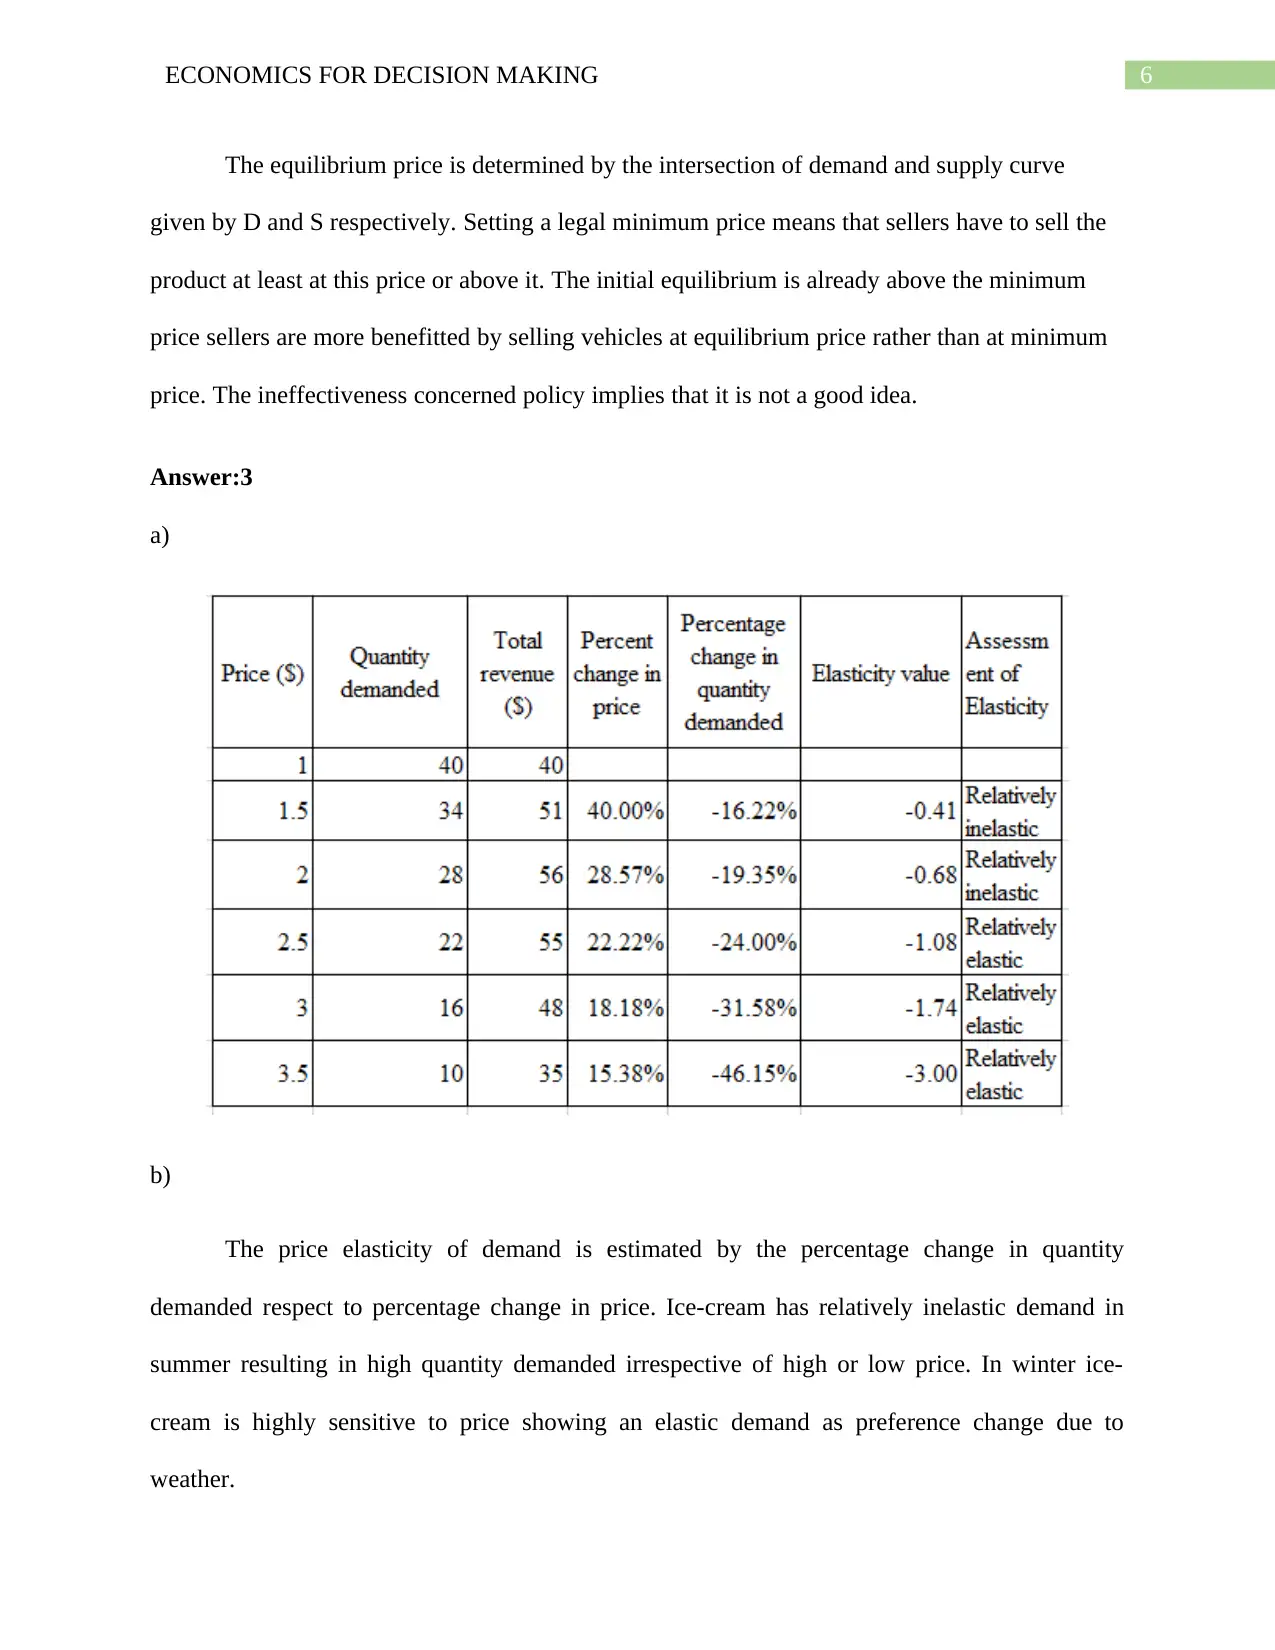
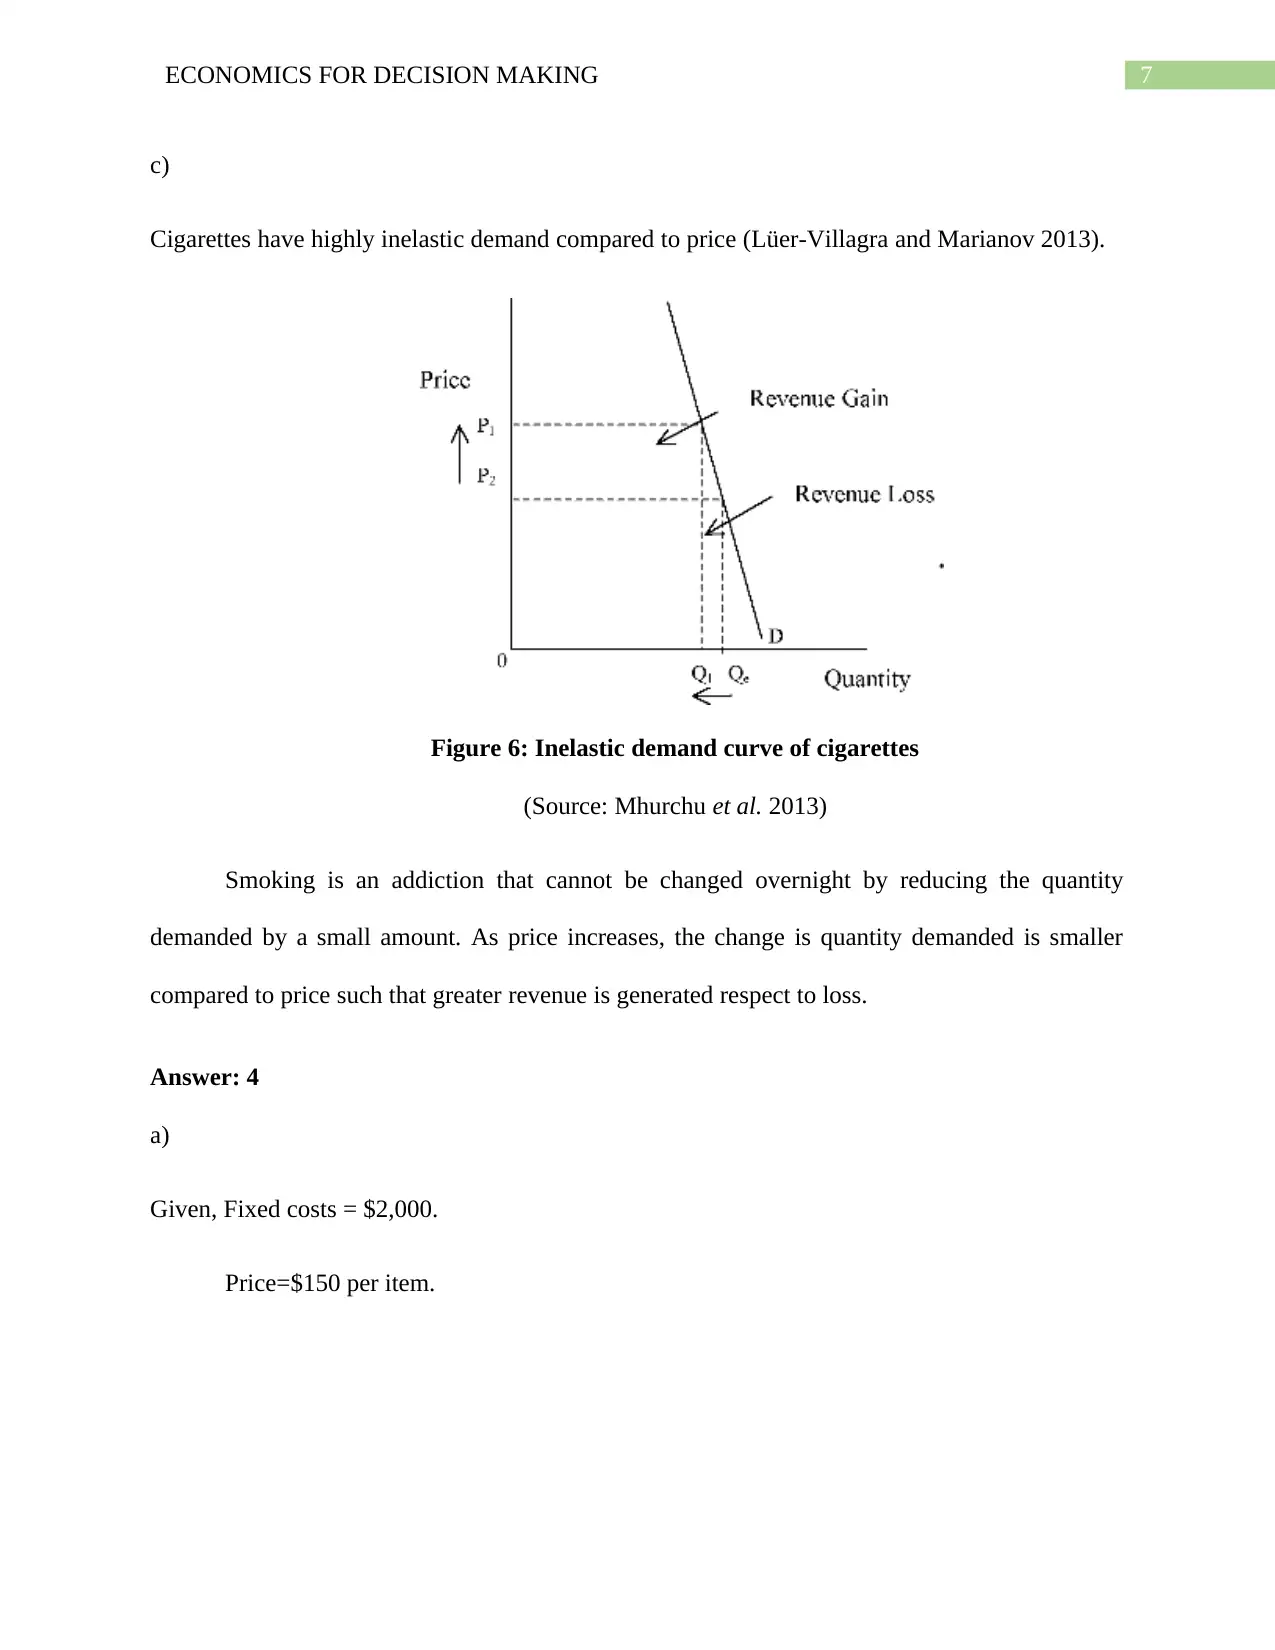
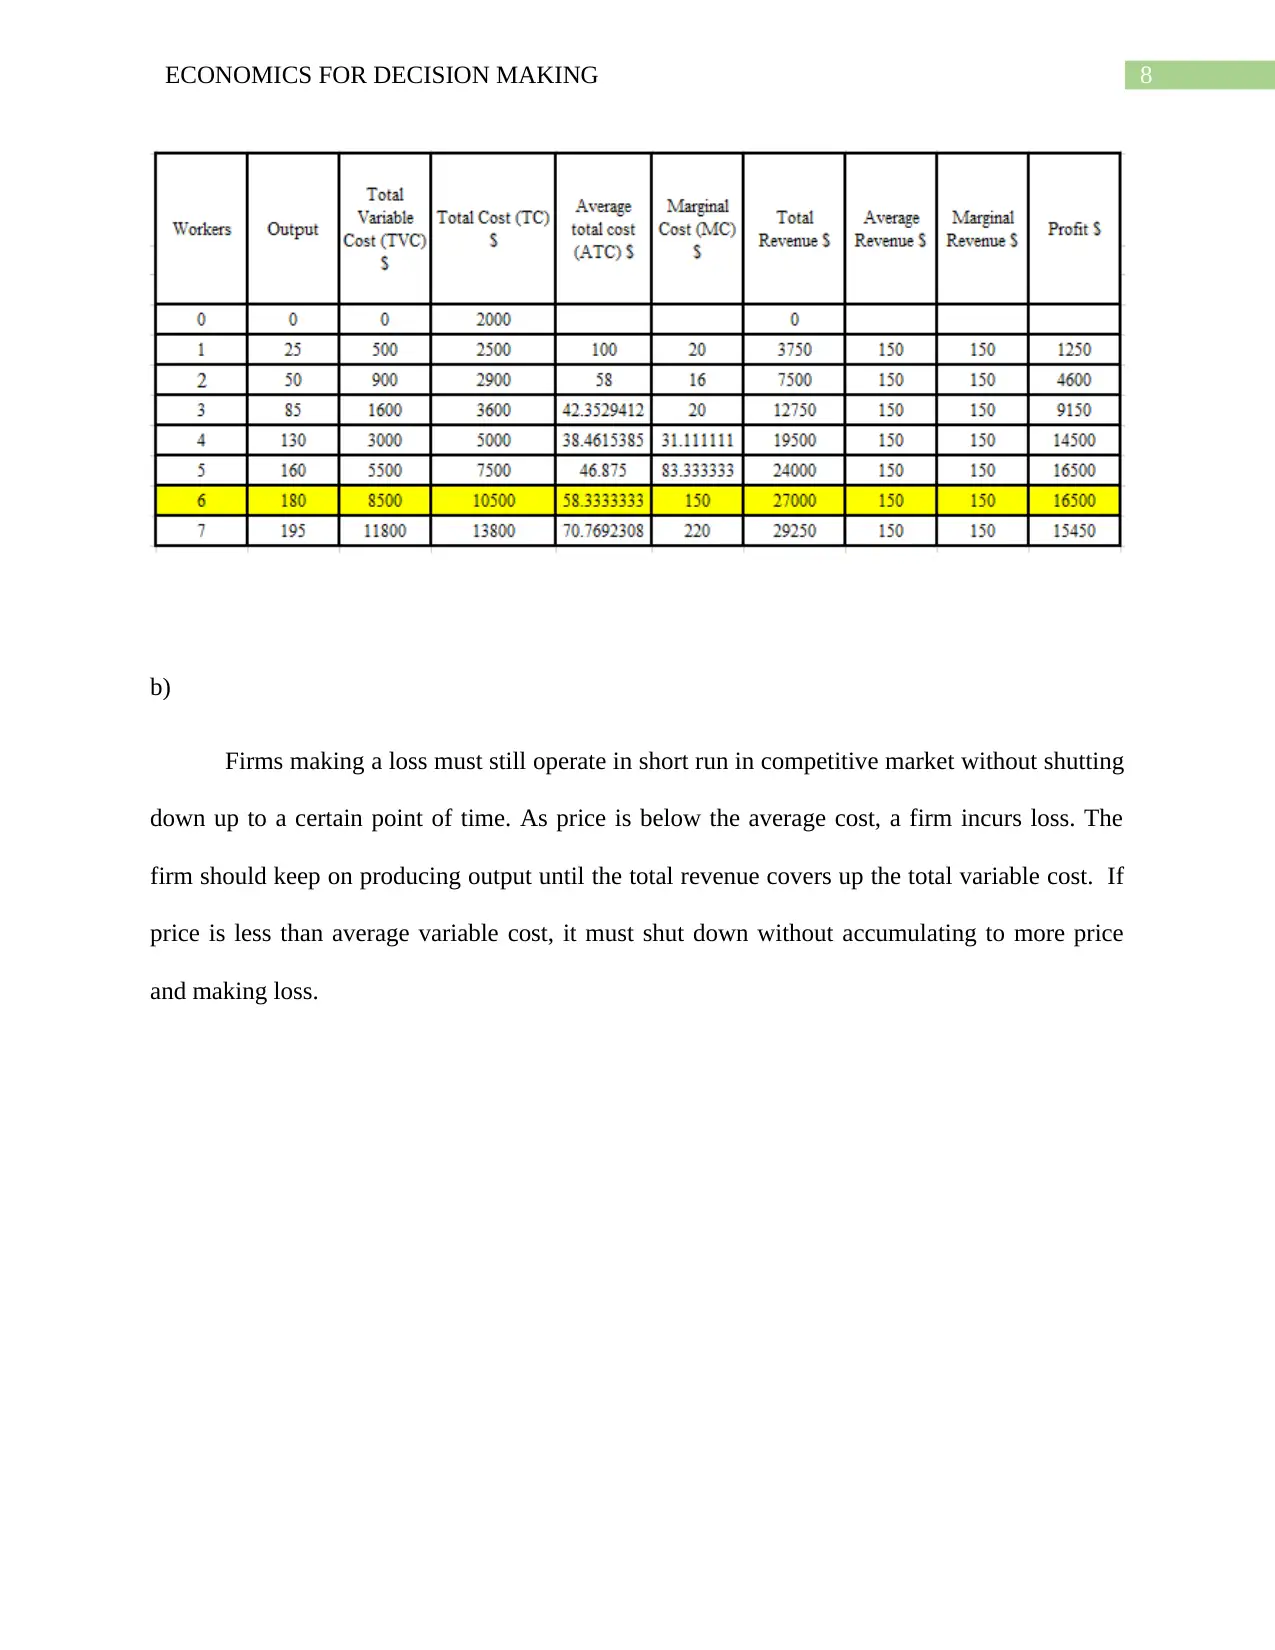
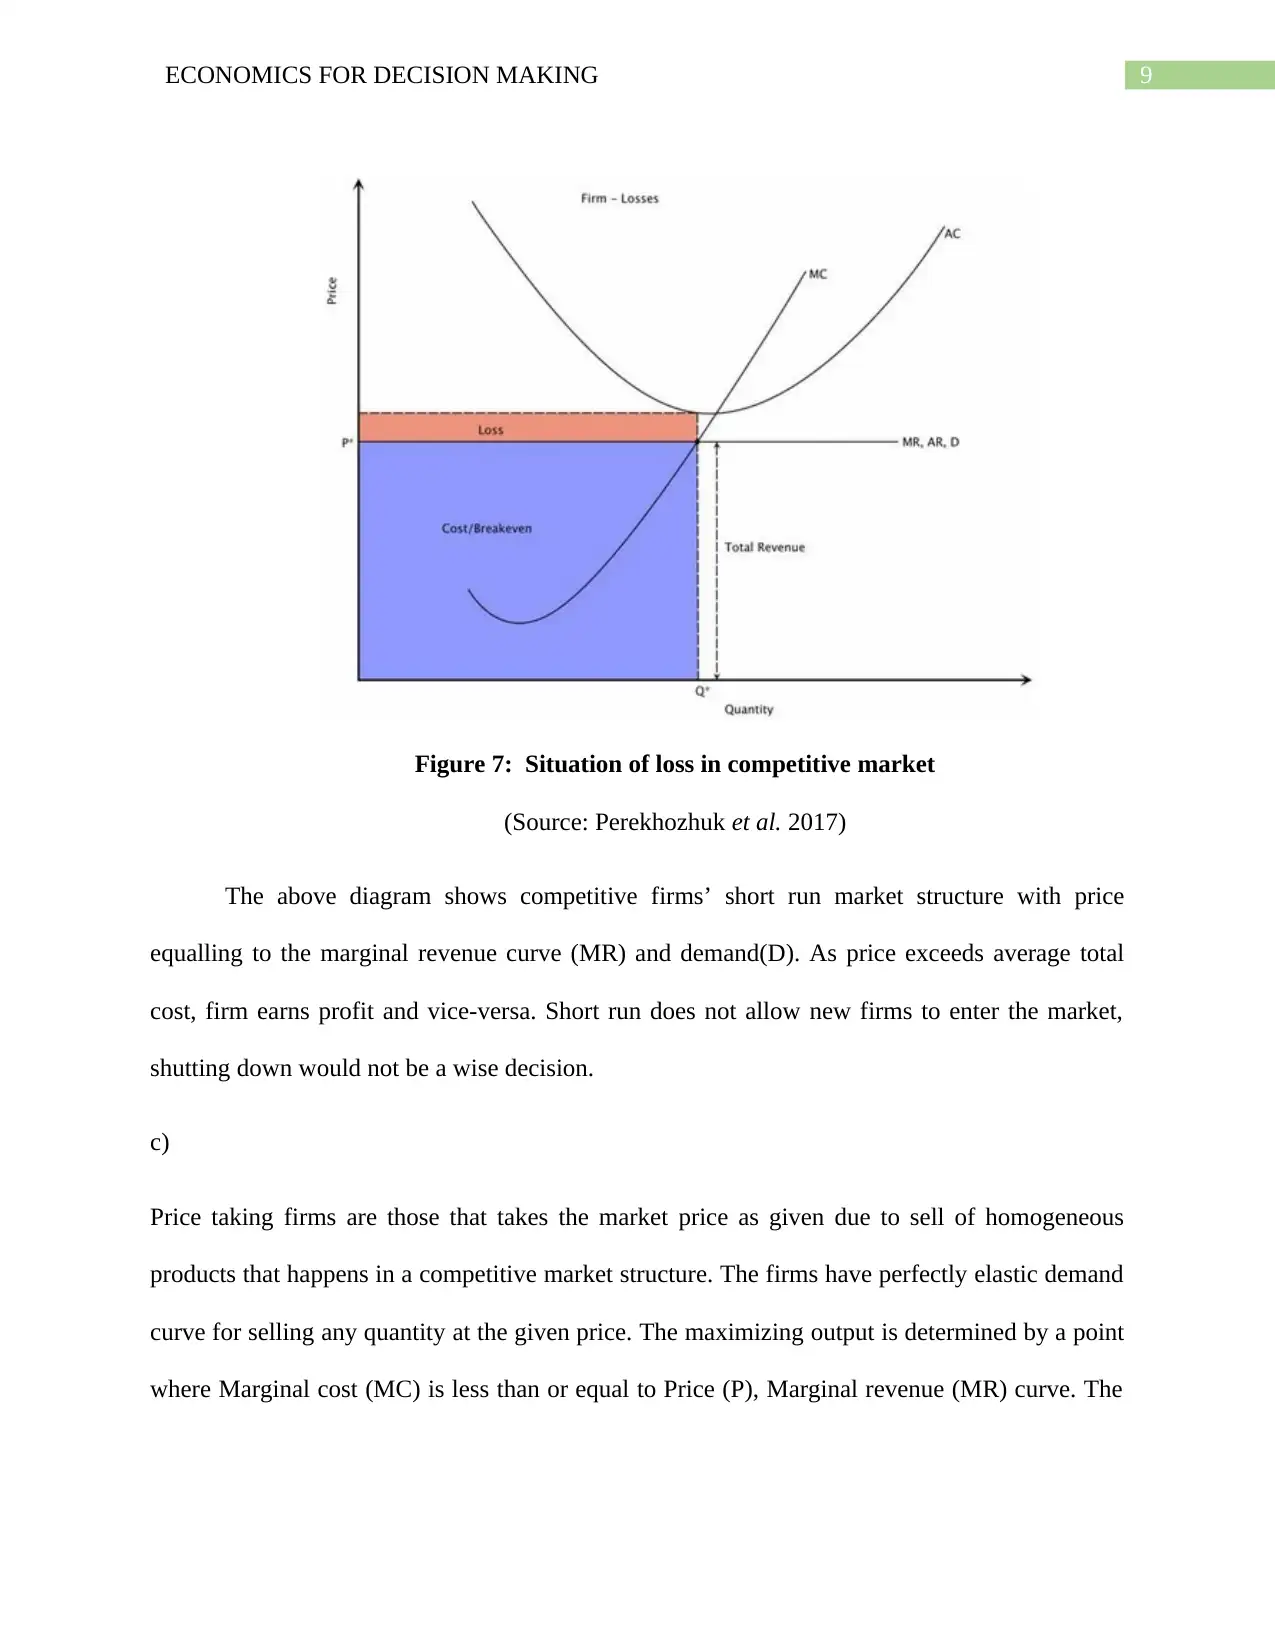
This economics assignment addresses core concepts in microeconomics. The first question analyzes Joan's production possibility curve, illustrating opportunity cost and resource allocation. The second question examines market shifts in supply and demand, focusing on solar and conventional motor vehicles. The third question explores price elasticity of demand using ice cream and cigarettes as examples. The fourth question covers cost structures, profit maximization in competitive markets, and price-taking firms. The fifth question compares perfect competition and monopoly, using the Australian banking sector as a case study. The assignment demonstrates an understanding of economic principles and their application to real-world scenarios.

Running Head: ECONOMICS FOR DECISION MAKING
Economics for Decision Making
Name of the Student
Name of University
Author’s Note
Economics for Decision Making
Name of the Student
Name of University
Author’s Note
Paraphrase This Document
Need a fresh take? Get an instant paraphrase of this document with our AI Paraphraser

1ECONOMICS FOR DECISION MAKING
Table of Contents
Answer: 1.........................................................................................................................................2
Answer: 2.........................................................................................................................................4
Answer:3..........................................................................................................................................6
Answer: 4.........................................................................................................................................7
Answer: 5.......................................................................................................................................10
Reference List................................................................................................................................11

2ECONOMICS FOR DECISION MAKING
Answer: 1
a) i) The Production Possibility Curve of Joan is given below.
0 10 20 30 40 50 60 70 80 90
0
10
20
30
40
50
60
70
A
B
C
D
E
Production Possibility Curve
Grade (%)
Work (hours per week)
Figure 1: Production possibility curve of Joan
a) ii)
With the help of above table, the concept of increasing opportunity cost can be explained. The
opportunity costs of work hours for grades are computed in the third column. This shows to
devote more and more hours to work Joan has to sacrifice more and more percentage of grades
indicating the tendency of increasing opportunity cost. This actually indicates the slope of PPC
and makes the PPC to bowed outward. (Chen and Schwartz 2013).
⊘ This is a preview!⊘
Do you want full access?
Subscribe today to unlock all pages.

Trusted by 1+ million students worldwide

3ECONOMICS FOR DECISION MAKING
a) iii) If the opportunity cost of Joan increasing her grade was constant regardless of how many hours
she worked, the Production Possibility Curve(PPC) will be a straight line.
Grades
Constant slope
Working hours
Figure 2: Graph representing constant opportunity cost
In practical world, opportunity costs are more likely to increase rather than being
constant. As the resources used to produce different goods or services are not perfect substitutes
there is a general tendency of increasing the opportunity cost as the resources are relocated from
one industry to another. The shape of PPC in figure 1 thus is more relevant.
a)iv) Points below (inside) the PPF express inefficient allocation of resources. When resources
are efficiently used, they lie on the PPF. Joan’s combination of grades and work hours are not
accurately used up.
a)v) In order to push her combination of her grades and hours of work per week past (outside) the PPF,
Joan needs to reallocate the resources efficiently. Joan has to increase the efficiency per hour both in
work and studies by working harder to shift the PPF rightwards (Goering 2014).
Paraphrase This Document
Need a fresh take? Get an instant paraphrase of this document with our AI Paraphraser

4ECONOMICS FOR DECISION MAKING
b) Having a high paying job does not ensure solution to scarcity. Moreover, Joan was unemployed for a
year, she has scare resources. With the income, Joan will buy new resources. As soon as wants are
satisfied, new desires appear showing scarcity.
Answer: 2
a)i)
Researches allow the manufacturers of solar powered vehicles to produce vehicles at a lower
cost. A reduction in cost of production allows suppliers to supply more output at same selling
price making supply to shift rightwards from S2 to S2.
Figure 3: Change in equilibrium price and quantity of solar motor vehicles
As a result of increased supply, the equilibrium price of solar powered motors goes down
from P to P1

5ECONOMICS FOR DECISION MAKING
ii)As price of solar motor goes down, people will prefer them more solar motor vehicles in place
of conventional motors leading to a fall in demand of conventional motors. T from D3 to D4.
Figure 4: Change in equilibrium price and quantity of conventional motor vehicle
Fall in demand leads to both a fall in equilibrium price and quantity from its initial level
of P0 to P1 and Q3 to Q4 respectively.
b)
Figure 5: Effect of setting minimum price
⊘ This is a preview!⊘
Do you want full access?
Subscribe today to unlock all pages.

Trusted by 1+ million students worldwide

6ECONOMICS FOR DECISION MAKING
The equilibrium price is determined by the intersection of demand and supply curve
given by D and S respectively. Setting a legal minimum price means that sellers have to sell the
product at least at this price or above it. The initial equilibrium is already above the minimum
price sellers are more benefitted by selling vehicles at equilibrium price rather than at minimum
price. The ineffectiveness concerned policy implies that it is not a good idea.
Answer:3
a)
b)
The price elasticity of demand is estimated by the percentage change in quantity
demanded respect to percentage change in price. Ice-cream has relatively inelastic demand in
summer resulting in high quantity demanded irrespective of high or low price. In winter ice-
cream is highly sensitive to price showing an elastic demand as preference change due to
weather.
Paraphrase This Document
Need a fresh take? Get an instant paraphrase of this document with our AI Paraphraser

7ECONOMICS FOR DECISION MAKING
c)
Cigarettes have highly inelastic demand compared to price (Lüer-Villagra and Marianov 2013).
Figure 6: Inelastic demand curve of cigarettes
(Source: Mhurchu et al. 2013)
Smoking is an addiction that cannot be changed overnight by reducing the quantity
demanded by a small amount. As price increases, the change is quantity demanded is smaller
compared to price such that greater revenue is generated respect to loss.
Answer: 4
a)
Given, Fixed costs = $2,000.
Price=$150 per item.

8ECONOMICS FOR DECISION MAKING
b)
Firms making a loss must still operate in short run in competitive market without shutting
down up to a certain point of time. As price is below the average cost, a firm incurs loss. The
firm should keep on producing output until the total revenue covers up the total variable cost. If
price is less than average variable cost, it must shut down without accumulating to more price
and making loss.
⊘ This is a preview!⊘
Do you want full access?
Subscribe today to unlock all pages.

Trusted by 1+ million students worldwide

9ECONOMICS FOR DECISION MAKING
Figure 7: Situation of loss in competitive market
(Source: Perekhozhuk et al. 2017)
The above diagram shows competitive firms’ short run market structure with price
equalling to the marginal revenue curve (MR) and demand(D). As price exceeds average total
cost, firm earns profit and vice-versa. Short run does not allow new firms to enter the market,
shutting down would not be a wise decision.
c)
Price taking firms are those that takes the market price as given due to sell of homogeneous
products that happens in a competitive market structure. The firms have perfectly elastic demand
curve for selling any quantity at the given price. The maximizing output is determined by a point
where Marginal cost (MC) is less than or equal to Price (P), Marginal revenue (MR) curve. The
Paraphrase This Document
Need a fresh take? Get an instant paraphrase of this document with our AI Paraphraser

10ECONOMICS FOR DECISION MAKING
second condition for profit maximization requires marginal cost curve to cut the marginal
revenue line from below.
Answer: 5
A perfect competition is a structure having many buyers and sellers selling homogenous
products. Whereas monopoly market operates with a single seller and many buyers and
permission of government is essential for operation. The Australian Banking sector consists of
major banks- National Australian Bank, Westpac Banking Corporation, Common Wealth Bank
of Australia and Australia and New Zealand Banking Group. They dominate the economy by
putting entry barriers to new companies. Huge capital and legal documents is hard to gather
making the firms to behave as monopoly market.
The banking structure hurts public by usage of limited services and charging an
unnecessary high price. As new firms’ entry has barriers, this refrains companies to develop new
methods and help customers (Zeuthen 2018).
The Australian Post work as a monopoly market because private postal companies are not
allowed to enter the market. Delivering parcels and posts at office of government, post office
boxes is fully restricted. Grocery supermarket and electricity market are some industry having
similar market structure like Australian bank.

11ECONOMICS FOR DECISION MAKING
Reference List
Chen, Y. and Schwartz, M., 2013. Product innovation incentives: Monopoly vs. competition.
Journal of Economics & Management Strategy, 22(3), pp.513-528.
Goering, G.E., 2014. The profit‐maximizing case for corporate social responsibility in a bilateral
monopoly. Managerial and Decision Economics, 35(7), pp.493-499.
Lüer-Villagra, A. and Marianov, V., 2013. A competitive hub location and pricing problem.
European Journal of Operational Research, 231(3), pp.734-744.
Mhurchu, C.N., Eyles, H., Schilling, C., Yang, Q., Kaye-Blake, W., Genç, M. and Blakely, T.,
2013. Food prices and consumer demand: differences across income levels and ethnic groups.
PloS one, 8(10), p.e75934.
Perekhozhuk, O., Glauben, T., Grings, M. and Teuber, R., 2017. Approaches and methods for the
econometric analysis of market power: a survey and empirical comparison. Journal of Economic
Surveys, 31(1), pp.303-325.
Zeuthen, F., 2018. Problems of monopoly and economic warfare. Routledge.
⊘ This is a preview!⊘
Do you want full access?
Subscribe today to unlock all pages.

Trusted by 1+ million students worldwide
1 out of 12
Related Documents

Your All-in-One AI-Powered Toolkit for Academic Success.
+13062052269
info@desklib.com
Available 24*7 on WhatsApp / Email
Unlock your academic potential
Copyright © 2020–2025 A2Z Services. All Rights Reserved. Developed and managed by ZUCOL.