Economics for Decision Making Assignment - Module Analysis

Verified

Added on  2022/09/27

|12
|1481
|20
Homework Assignment
AI Summary
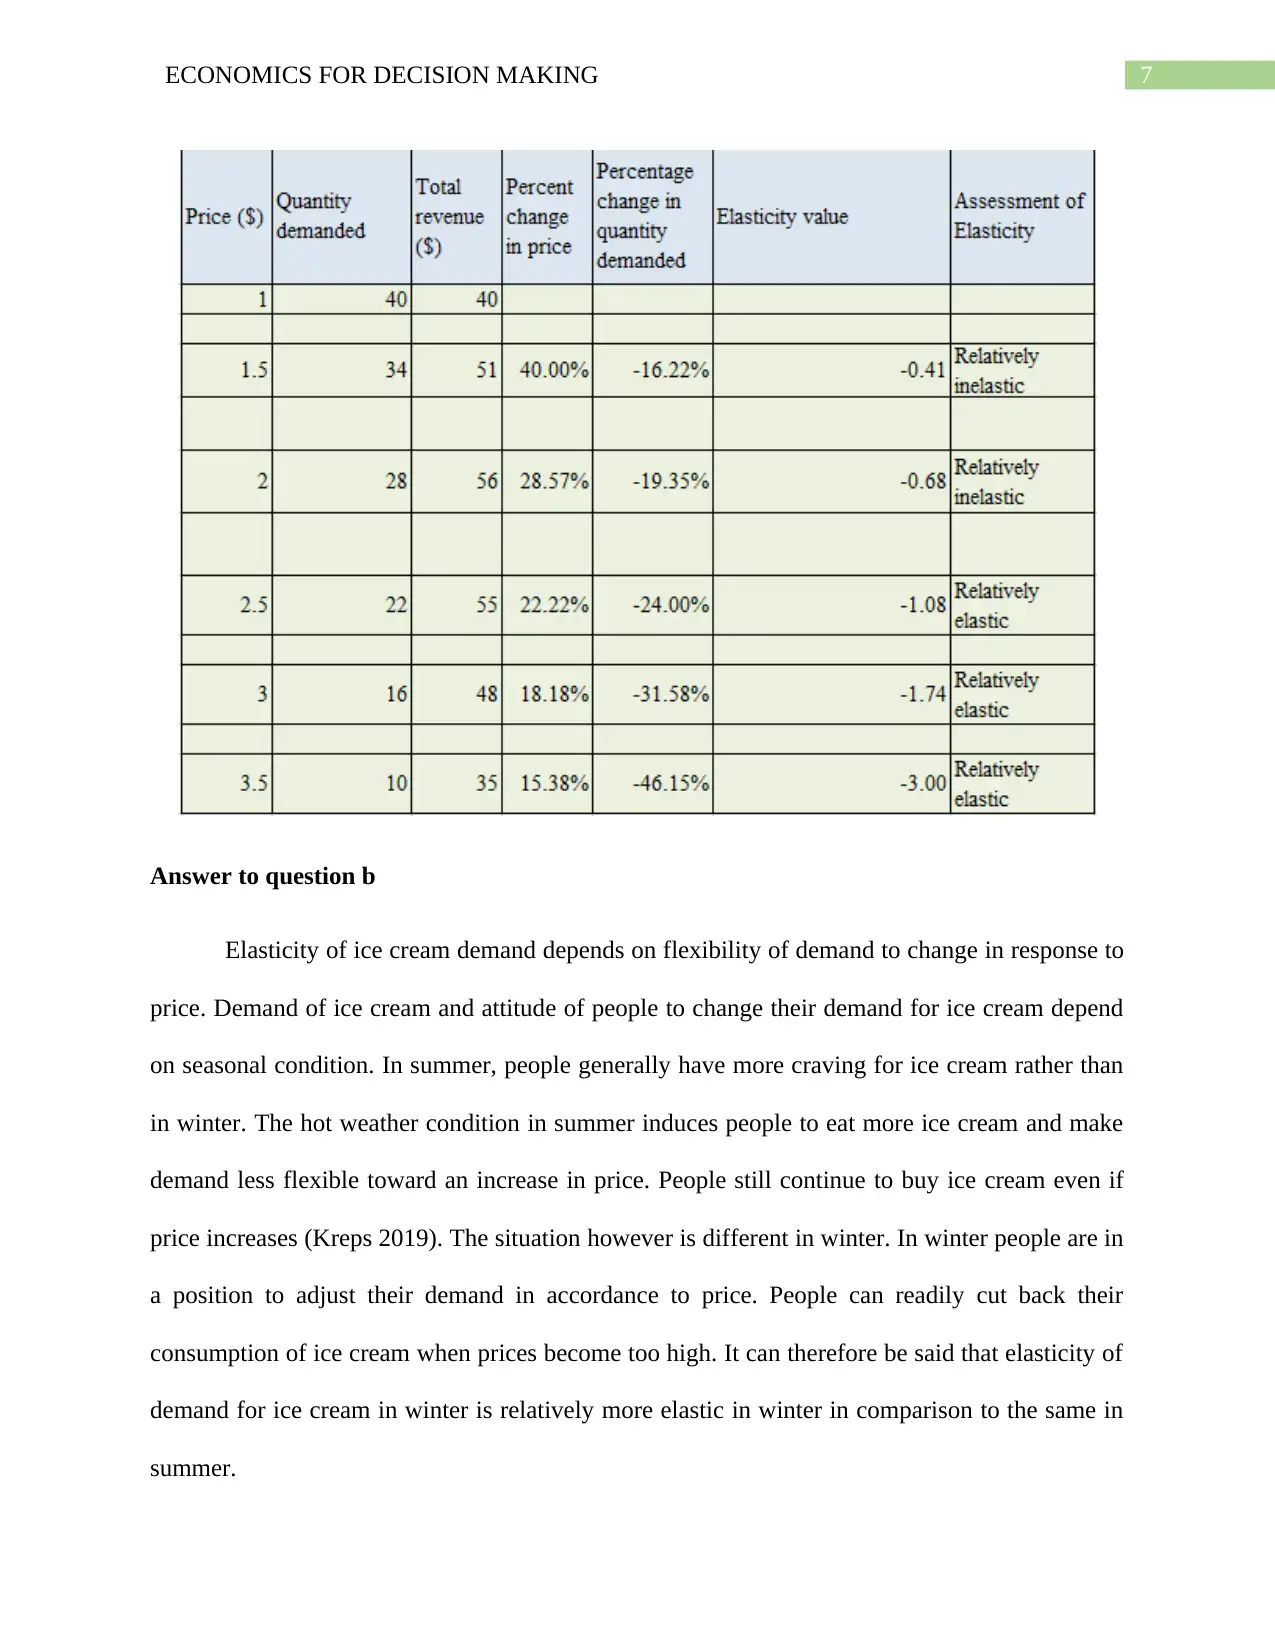
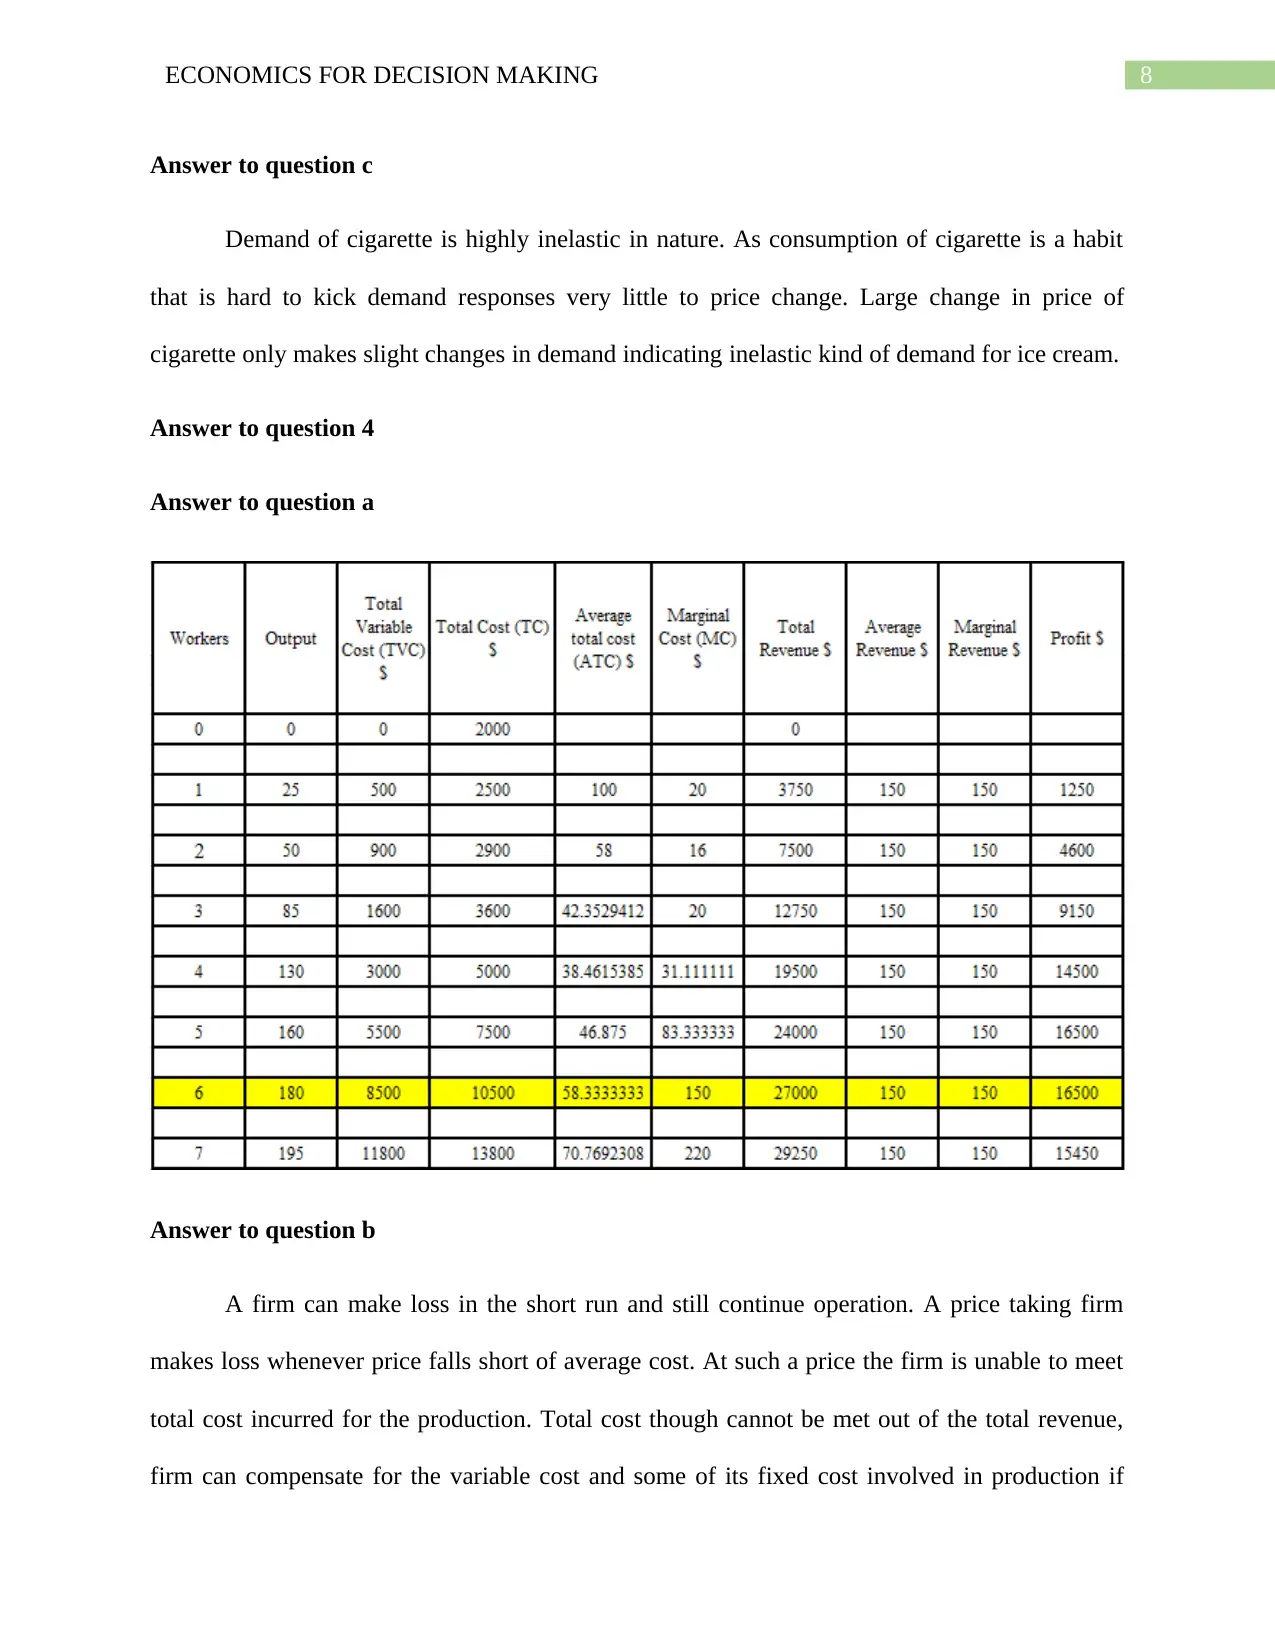
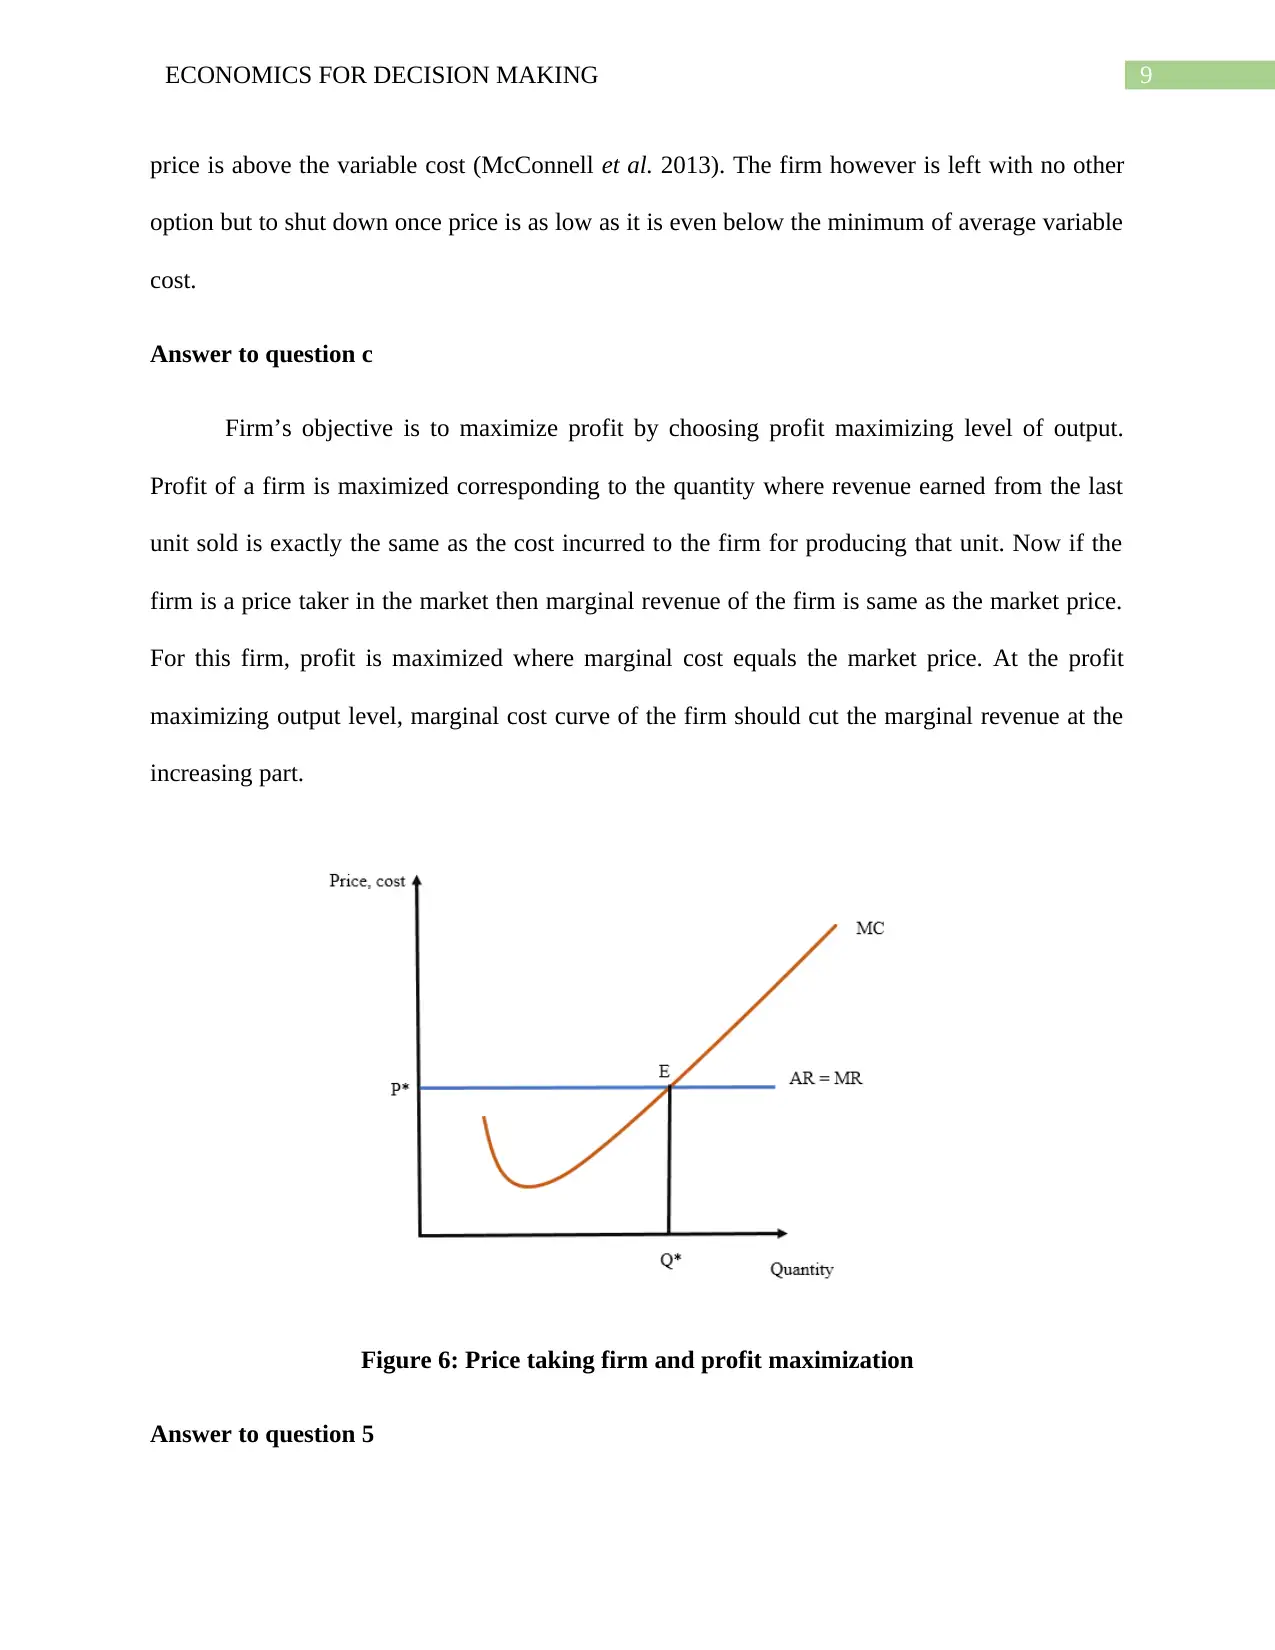
This economics assignment solution addresses key microeconomic concepts. It begins with an analysis of Joan's production possibility curve, illustrating opportunity cost and resource allocation. The assignment then explores market dynamics, including the impact of supply and demand shifts in the solar-powered vehicle market and the effects of a price floor. Elasticity of demand is examined through examples of ice cream and cigarettes. The solution also covers cost structures, profit maximization for a price-taking firm, and the identification of market structures, particularly in the Australian banking industry. The assignment uses graphs and explanations to clarify economic principles.
Document Page
Running head: ECONOMICS FOR DECISION MAKING
Economics for Decision Making
Name of the Student
Name of the University
Author note
tabler-icon-diamond-filled.svg

Paraphrase This Document

Need a fresh take? Get an instant paraphrase of this document with our AI Paraphraser
Document Page
1ECONOMICS FOR DECISION MAKING
Table of Contents
Answer to question 1.......................................................................................................................2
Answer to question a...................................................................................................................2
Answer to question b...................................................................................................................4
Answer to question 2.......................................................................................................................4
Answer to question a...................................................................................................................4
Answer to question b...................................................................................................................6
Answer to question 3.......................................................................................................................6
Answer to question a...................................................................................................................6
Answer to question b...................................................................................................................7
Answer to question c...................................................................................................................8
Answer to question 4.......................................................................................................................8
Answer to question a...................................................................................................................8
Answer to question b...................................................................................................................8
Answer to question c...................................................................................................................9
Answer to question 5.......................................................................................................................9
References......................................................................................................................................11
Document Page
2ECONOMICS FOR DECISION MAKING
Answer to question 1
Answer to question a
i)
0 10 20 30 40 50 60 70 80 90
0
10
20
30
40
50
60
70
A
B
C
D
E
Production Possibility Curve
Grade (%)
Work (hours per week)
Figure 1: Production Possibility Curve
ii)
The concept of increasing opportunity cost can be explained with the help of above table.
The table above shows opportunity cost of grade for work hours. The estimates suggest that
opportunity cost increases along the PPC meaning in order to obtain more grades Joan must
sacrifice more and more hours of work.
Document Page
3ECONOMICS FOR DECISION MAKING
iii)
If the opportunity cost that Joan faces for increasing her grade in terms of work hours
become constant the PPC would have a constant slope. The PPC would then be a straight line.
The concave shape of PPC (Figure 1) is more likely to occur rather than straight line (McConnell
et al. 2013). This is because opportunity costs in real world in mostly increasing in nature rather
than being constant.
Figure 2: Straight line PPC (constant opportunity cost)
iv)
Resources (here time) would not be used optimally if combination of grades and work hours of
Joan were inside the PPC.
v)
In order to attain a combination of grades and hours of work per week Joan should study more
efficiently such that more grades can be obtained along with devoting more time for works.
tabler-icon-diamond-filled.svg

Paraphrase This Document

Need a fresh take? Get an instant paraphrase of this document with our AI Paraphraser
Document Page
4ECONOMICS FOR DECISION MAKING
Answer to question b
Getting a job with an international hotel does not mean Joan would no longer experience
the problem of scarcity. Scarcity is a primary economic problem soured from limited means and
unlimited ends (Kreps 2019). Money income cannot solve the scarcity problem of Joan because
with the limited money income Joan will still have limitless desires resulting in scarcity problem.
Answer to question 2
Answer to question a
i)
Figure 3: Equilibrium price and quantity of solar powered motor vehicles
Research in the field of solar power generation helps the manufacturers of solar powered
vehicles by reducing cost of producing solar powered vehicles. As manufacturers face a lower
cost they can now produce more solar powered vehicles. This will increase market supply of
Document Page
5ECONOMICS FOR DECISION MAKING
these vehicles. The favorable change in supply cause the supply curve to move right from the
initial. Given the market, the increased supply causes equilibrium price to fall and equilibrium
quantity to increases as shown in the above figure.
ii)
Figure 4: Equilibrium price and quantity of conventional motor vehicles
The relation between solar power motor vehicles and that of conventional motor vehicles
is like substitute goods. Demand of a particular good and price of its substitutes are positively
related. Therefore, low price of solar powered vehicles due to increase in available supply
reduces demand for solar powered vehicles. Decline in demand of solar powered motor vehicles
causes demand curve of these vehicles inward (McConnell et al. 2013). In the market of
conventional motor vehicles, there is a resulted decline in both equilibrium price and equilibrium
number of vehicles.
Document Page
6ECONOMICS FOR DECISION MAKING
Answer to question b
Figure 5: Non-binding minimum price
When government attempts to set a minimum price for solar-powered vehicles, then price
in the market has to be at least that level. In economic terms the policy of determining a
minimum price is termed as price floor. This policy is effective if minimum price is above the
price at which the market clears. Given the scenario that to support solar power motor vehicles
industry government sets minimum price for vehicles below the market price, there is no change
in industry. The autonomous forces of demand and supply moves the price towards equilibrium
(Kreps 2019). Suppliers of solar powered vehicles are more benefitted by selling vehicles at
equilibrium price rather than selling it at the minimum price. The analysis therefore suggests this
is not a good idea.
Answer to question 3
Answer to question a
tabler-icon-diamond-filled.svg

Paraphrase This Document

Need a fresh take? Get an instant paraphrase of this document with our AI Paraphraser
Document Page
7ECONOMICS FOR DECISION MAKING
Answer to question b
Elasticity of ice cream demand depends on flexibility of demand to change in response to
price. Demand of ice cream and attitude of people to change their demand for ice cream depend
on seasonal condition. In summer, people generally have more craving for ice cream rather than
in winter. The hot weather condition in summer induces people to eat more ice cream and make
demand less flexible toward an increase in price. People still continue to buy ice cream even if
price increases (Kreps 2019). The situation however is different in winter. In winter people are in
a position to adjust their demand in accordance to price. People can readily cut back their
consumption of ice cream when prices become too high. It can therefore be said that elasticity of
demand for ice cream in winter is relatively more elastic in winter in comparison to the same in
summer.
Document Page
8ECONOMICS FOR DECISION MAKING
Answer to question c
Demand of cigarette is highly inelastic in nature. As consumption of cigarette is a habit
that is hard to kick demand responses very little to price change. Large change in price of
cigarette only makes slight changes in demand indicating inelastic kind of demand for ice cream.
Answer to question 4
Answer to question a
Answer to question b
A firm can make loss in the short run and still continue operation. A price taking firm
makes loss whenever price falls short of average cost. At such a price the firm is unable to meet
total cost incurred for the production. Total cost though cannot be met out of the total revenue,
firm can compensate for the variable cost and some of its fixed cost involved in production if
Document Page
9ECONOMICS FOR DECISION MAKING
price is above the variable cost (McConnell et al. 2013). The firm however is left with no other
option but to shut down once price is as low as it is even below the minimum of average variable
cost.
Answer to question c
Firm’s objective is to maximize profit by choosing profit maximizing level of output.
Profit of a firm is maximized corresponding to the quantity where revenue earned from the last
unit sold is exactly the same as the cost incurred to the firm for producing that unit. Now if the
firm is a price taker in the market then marginal revenue of the firm is same as the market price.
For this firm, profit is maximized where marginal cost equals the market price. At the profit
maximizing output level, marginal cost curve of the firm should cut the marginal revenue at the
increasing part.
Figure 6: Price taking firm and profit maximization
Answer to question 5
tabler-icon-diamond-filled.svg

Paraphrase This Document

Need a fresh take? Get an instant paraphrase of this document with our AI Paraphraser
Document Page
10ECONOMICS FOR DECISION MAKING
Identification of market structure of a particular firm depends on number of market
players in the market. In the Australian banking industry, there is huge dominance of four large
banks (Westpac, Commonwealth Bank, ANZ and National Australia bank). These dominant
players hold more than three fourth of total industry share (Kreps 2019). As the industry offers
an important service there is a huge customer base. Large number of consumers and few
dominating players indicate the industry is more of a monopoly.
In a seller dominated industry like Australian banking, firm is a price maker. The
dominant firm determines price in such a way that it can earn maximum surplus (McConnell et
al. 2013). This harms public interest as common people have to pay price more than the fair
price.
Grocery supermarket is another industry that possesses similar characteristics as
Australian banking does. Two dominant players occupying lion share in the market are
Woolsworth and Coles.
Document Page
11ECONOMICS FOR DECISION MAKING
References
Kreps, D.M., 2019. Microeconomics for managers. Princeton University Press.
McConnell, C.R., Brue, S.L., Flynn, S.M. and Grant, R.R., 2013. Microeconomics: Brief Edition.
McGraw-Hill/Irwin.
chevron_up_icon
1 out of 12
circle_padding
hide_on_mobile
zoom_out_icon
[object Object]