University Economics for Decision Making Assignment - ECO10250
VerifiedAdded on 2022/10/06
|13
|1660
|19
Homework Assignment
AI Summary
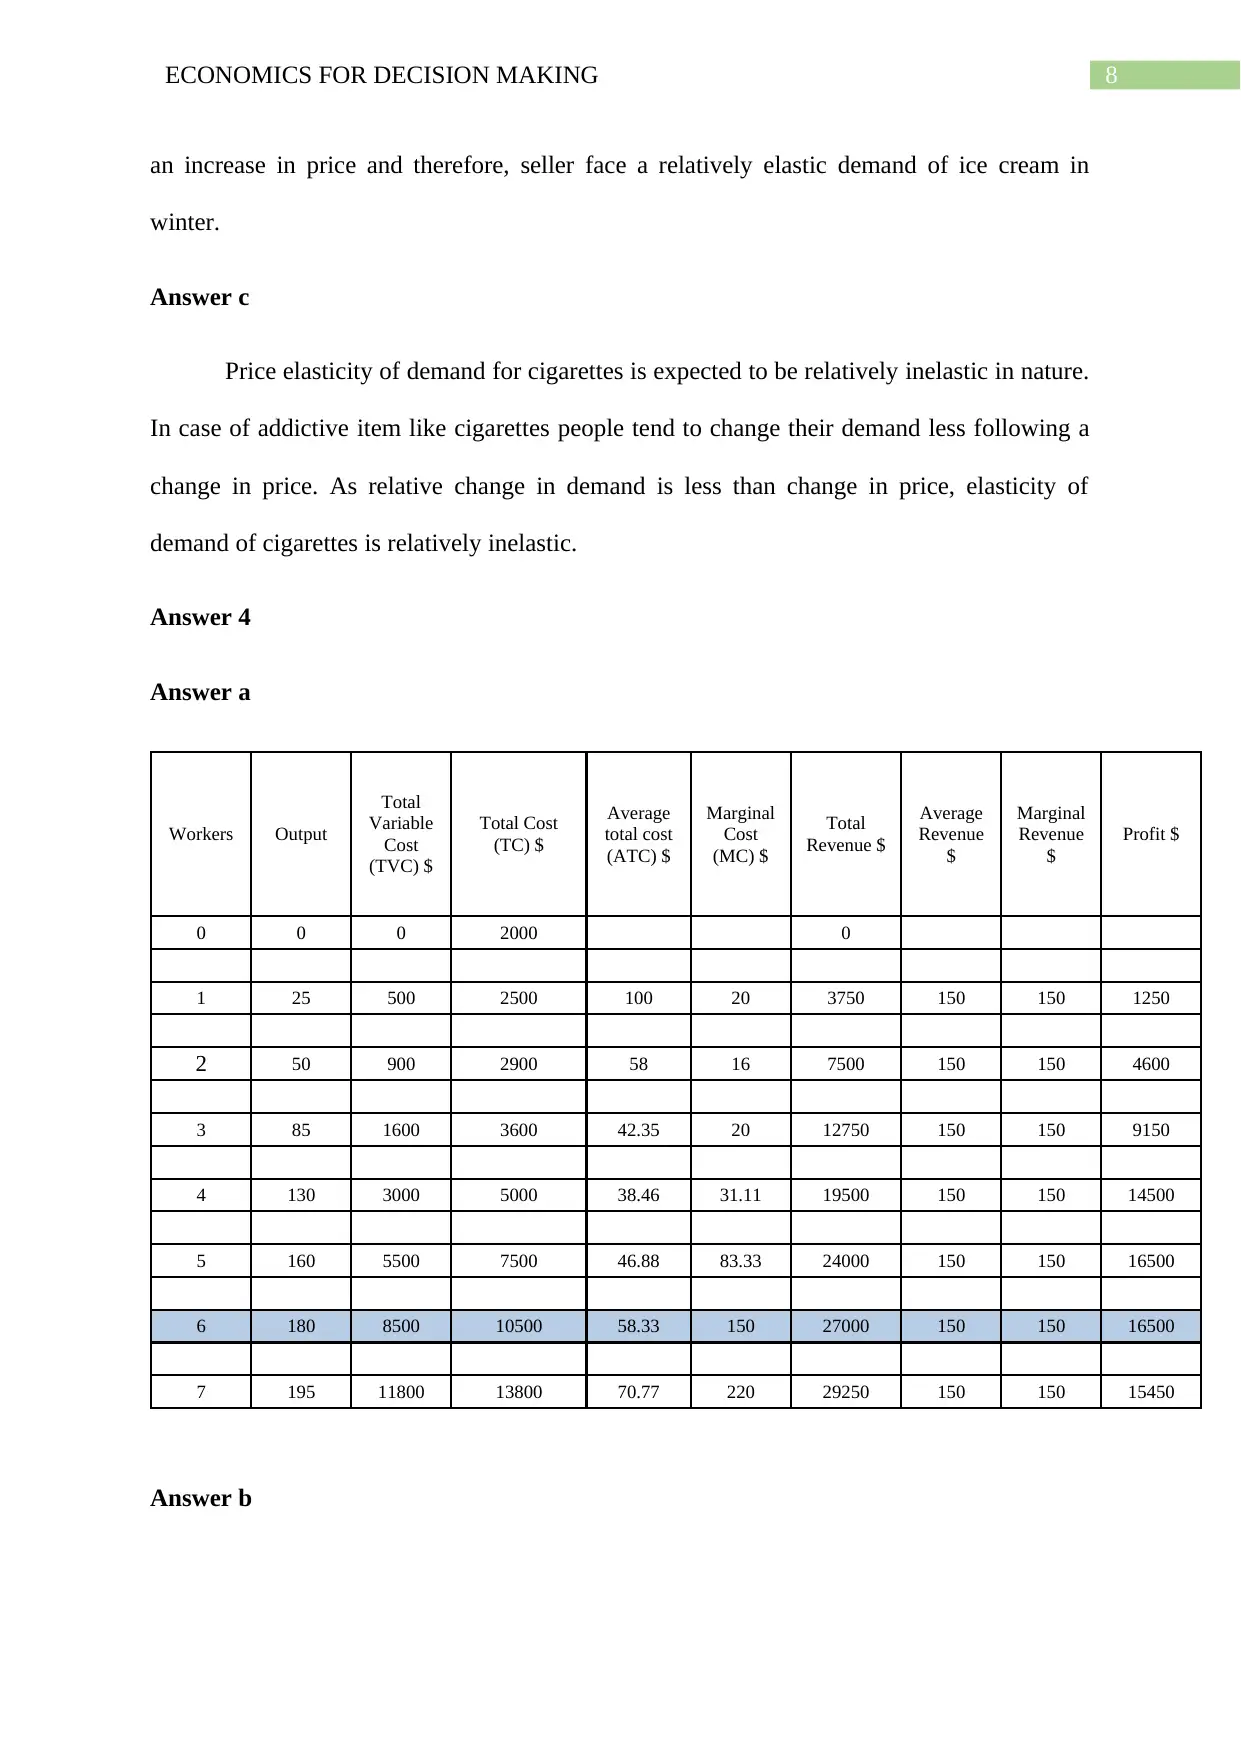
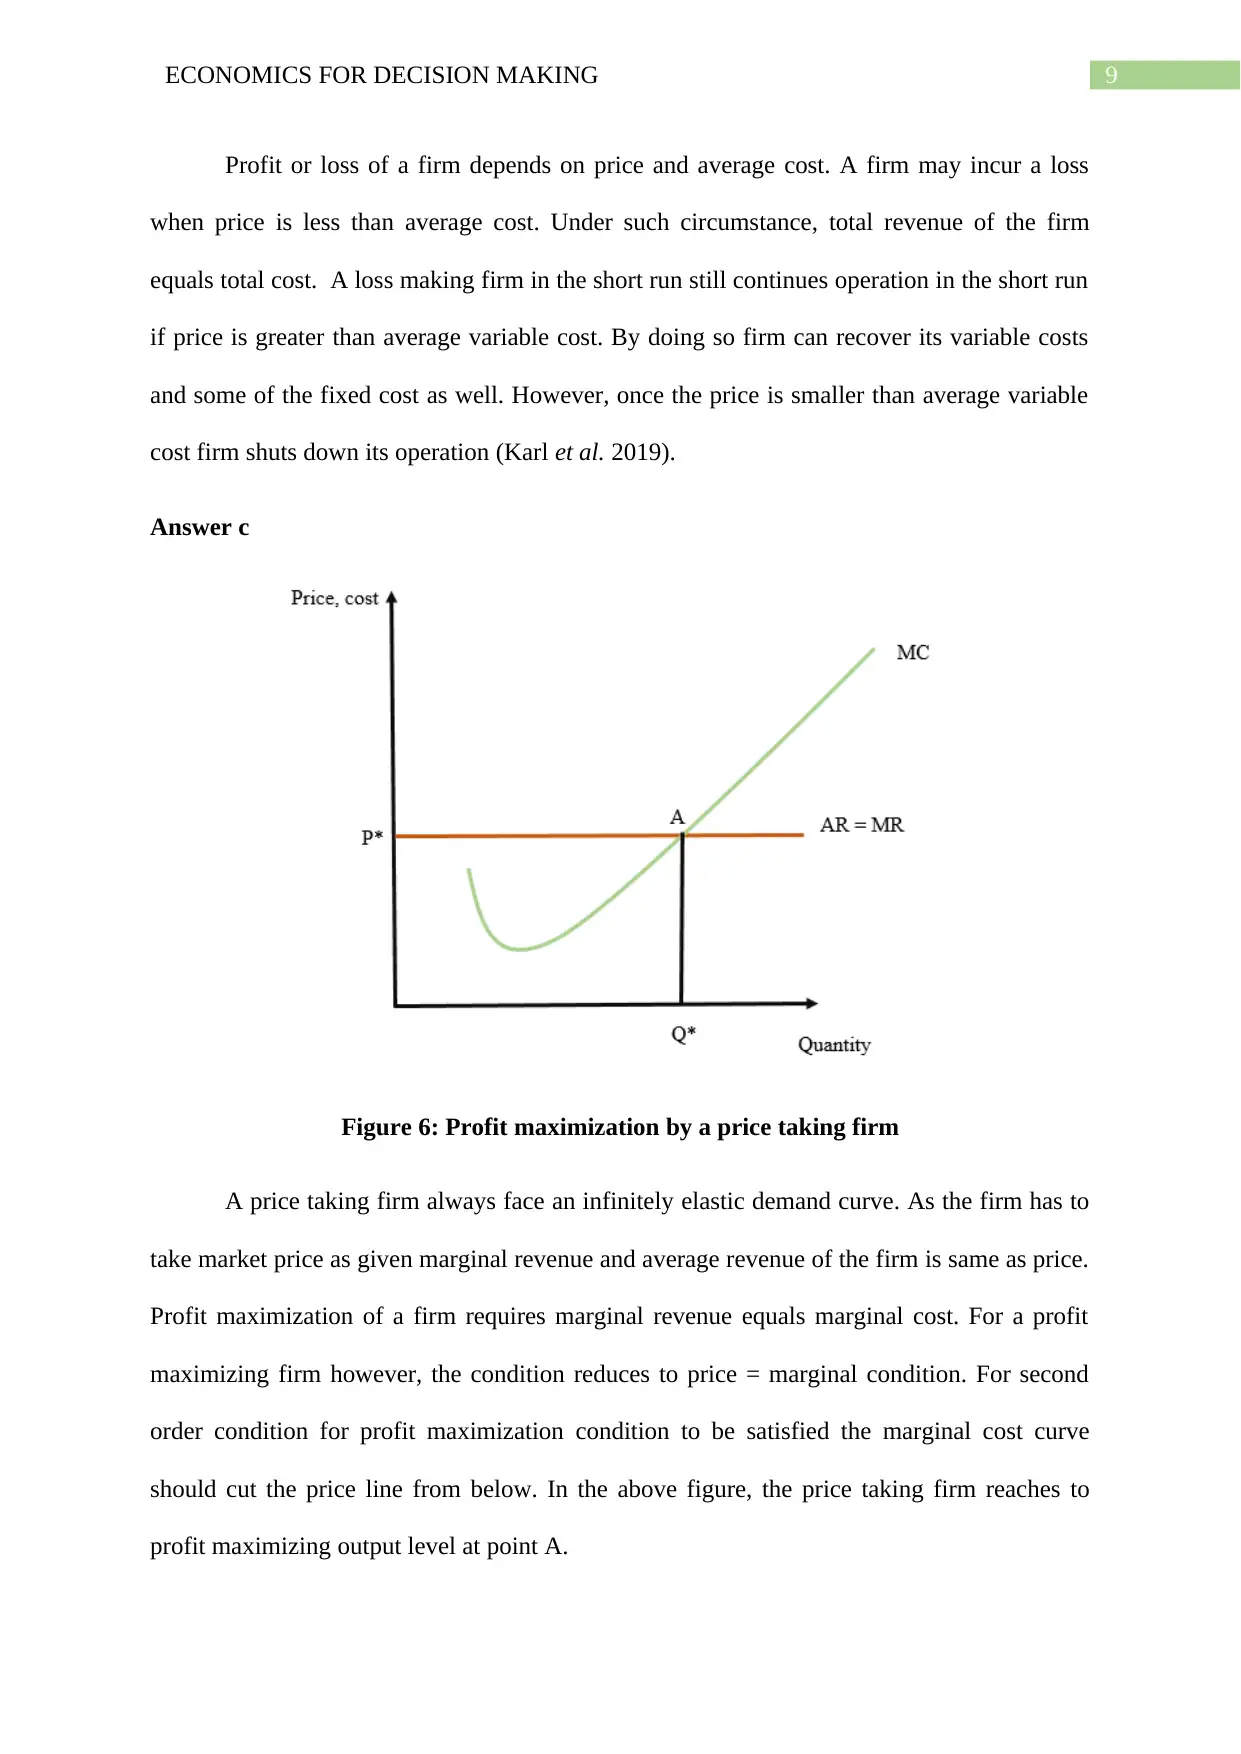
This economics assignment solution covers key microeconomic concepts. It begins with an analysis of production possibility curves, opportunity cost, and scarcity. The assignment then delves into supply and demand dynamics, examining the impact of manufacturing breakthroughs and price controls. Further, it explores price elasticity of demand and its application to different goods. The solution also includes cost analysis, profit maximization for firms, and a discussion of market structures, specifically focusing on the oligopolistic nature of the Australian banking industry. The assignment provides figures and calculations to support its analysis, demonstrating a comprehensive understanding of economic principles.

Running head: ECONOMICS FOR DECISION MAKING
Economics for Decision Making
Name of the Student
Name of the University
Student ID
Economics for Decision Making
Name of the Student
Name of the University
Student ID
Paraphrase This Document
Need a fresh take? Get an instant paraphrase of this document with our AI Paraphraser

1ECONOMICS FOR DECISION MAKING
Table of Contents
Answer 1....................................................................................................................................2
Answer a.................................................................................................................................2
Answer b................................................................................................................................4
Answer 2....................................................................................................................................4
Answer a.................................................................................................................................4
Answer b................................................................................................................................6
Answer 3....................................................................................................................................7
Answer a.................................................................................................................................7
Answer b................................................................................................................................7
Answer c.................................................................................................................................8
Answer 4....................................................................................................................................8
Answer a.................................................................................................................................8
Answer b................................................................................................................................8
Answer c.................................................................................................................................9
Answer 5..................................................................................................................................10
References................................................................................................................................11

2ECONOMICS FOR DECISION MAKING
Answer 1
Answer a
i.
0 10 20 30 40 50 60 70
0
10
20
30
40
50
60
70
80
90
A
B
C
D
E
Production Possibility Curve
Work (hours per week)
Grade (%)
Figure 1: Production Possibility Curve for Joan
ii.
The concept of increasing opportunity cost refers to the idea of increasing rate of sacrifice of
one good for obtaining additional unit of other good. Given the production possibility table of
Joan, the opportunity cost of Joan for work hours as against percentage of grade increase
from point A to point E indicating an increasing opportunity cost (Mochrie 2015). The
increasing opportunity cost explains the concave shape of PPC.
⊘ This is a preview!⊘
Do you want full access?
Subscribe today to unlock all pages.

Trusted by 1+ million students worldwide

3ECONOMICS FOR DECISION MAKING
iii.
Figure 2: Constant opportunity cost and PPC
In the presence of constant opportunity cost, the production possibility curve of Joan would
become a straight line. The shape of PPC as obtained in figure 1 is more likely than that
obtained in case of constant opportunity cost. This is because in real world, opportunity cost
increases with increase in production of one good. The reasons for increasing opportunity
cost are limited resources and the fact that resources are imperfect substitutes and hence,
cannot be produced all goods with equal efficiency.
iv.
If Joan’s combination of grades and hours of work per week were below the PPC, then this
implies inefficient allocation of resources between grades and hours of work.
v.
Joan could push combination of hours of work and grades outside her PPC by finding more
efficient and time saving method for studying to obtain more grades (Kolmar 2017). This will
enable her to increase hours of work at the same time.
Paraphrase This Document
Need a fresh take? Get an instant paraphrase of this document with our AI Paraphraser

4ECONOMICS FOR DECISION MAKING
Answer b
Scarcity is a problem related to limited availability of resources and associated
problem of making choice. The problem of scarcity is a fundamental problem of economies
that cannot be solve in terms of money income. Therefore, even after getting a high paying
job in an international hotel, Joan will still face the scarcity problem arising limited
availability of resources and unlimited wants.
Answer 2
Answer a
i)
Figure 2: Impact of manufacturing breakthrough on solar powered motor vehicles
The reduction in production cost of solar-powered motor vehicles due to breakthrough
in manufacturing increases supply of solar powered motor vehicles. This shifts the supply

5ECONOMICS FOR DECISION MAKING
curve of motor vehicles to the right (Jain and Ohri 2015). Consequently, the supply curve
shifts from S1S1 to S2S2 in the above figure. With increase in supply equilibrium price
decreases and equilibrium quantity increases.
ii)
Figure 4: Market condition of conventional motor vehicles
As the price of solar powered motor vehicles decreases people tend to use the solar
powered motor vehicles more. This decreases the demand for conventional motor vehicles.
Consequently, the demand curve of conventional motor vehicles shifts inward to D2D2. With
expansion of demand for conventional motor vehicles both equilibrium price and equilibrium
quantity of motor vehicles increases.
⊘ This is a preview!⊘
Do you want full access?
Subscribe today to unlock all pages.

Trusted by 1+ million students worldwide

6ECONOMICS FOR DECISION MAKING
Answer b
Figure 5: Impact of setting a minimum price of solar powered vehicles
In the above figure, P1 indicates equilibrium market price of solar powered vehicles.
Now, suppose government imposes a minimum price that is below the market equilibrium
price. The implication of setting the minimum price is that sellers are not allowed to sell the
price below that price (Hutchinson et al. 2017). In the market such a policy is ineffective as
market clearing price is already above the minimum price. Demand and supply force
automatically push the market towards equilibrium. Therefore, imposition of a binding
minimum price is not a good policy.
Paraphrase This Document
Need a fresh take? Get an instant paraphrase of this document with our AI Paraphraser

7ECONOMICS FOR DECISION MAKING
Answer 3
Answer a
Price
($)
Quantity
demanded
Total
revenue
($)
Percent
change
in price
Percentage
change in
quantity
demanded
Elasticity
value
Assessment of
Elasticity
1.00 40 40
1.50 34 51 40.00% -16.22% -0.41 Relatively
inelastic
2.00 28 56 28.57% -19.35% -0.68 Relatively
inelastic
2.50 22 55 22.22% -24.00% -1.08 Relatively
elastic
3.00 16 48 18.18% -31.58% -1.74 Relatively
elastic
3.50 10 35 15.38% -46.15% -3.00 Relatively
elastic
Answer b
Price elasticity of demand is an estimate of relative sensitivity of demand with respect
to a change in price. Degree of change in demand depends on various factors. In case of ice
cream, proportionate change in demand for ice cream varies across seasons. Price elasticity of
demand for ice cream winter is relatively larger than that in the summer. This is because, in
summer due to hot weather condition people are less willing to postpone their demand and
therefore, demand reduces by a relatively less magnitude when price increases (Devine et al.
2018). This is not the case in winter. People can easily postpone their demand in winter given

8ECONOMICS FOR DECISION MAKING
an increase in price and therefore, seller face a relatively elastic demand of ice cream in
winter.
Answer c
Price elasticity of demand for cigarettes is expected to be relatively inelastic in nature.
In case of addictive item like cigarettes people tend to change their demand less following a
change in price. As relative change in demand is less than change in price, elasticity of
demand of cigarettes is relatively inelastic.
Answer 4
Answer a
Workers Output
Total
Variable
Cost
(TVC) $
Total Cost
(TC) $
Average
total cost
(ATC) $
Marginal
Cost
(MC) $
Total
Revenue $
Average
Revenue
$
Marginal
Revenue
$
Profit $
0 0 0 2000 0
1 25 500 2500 100 20 3750 150 150 1250
2 50 900 2900 58 16 7500 150 150 4600
3 85 1600 3600 42.35 20 12750 150 150 9150
4 130 3000 5000 38.46 31.11 19500 150 150 14500
5 160 5500 7500 46.88 83.33 24000 150 150 16500
6 180 8500 10500 58.33 150 27000 150 150 16500
7 195 11800 13800 70.77 220 29250 150 150 15450
Answer b
⊘ This is a preview!⊘
Do you want full access?
Subscribe today to unlock all pages.

Trusted by 1+ million students worldwide

9ECONOMICS FOR DECISION MAKING
Profit or loss of a firm depends on price and average cost. A firm may incur a loss
when price is less than average cost. Under such circumstance, total revenue of the firm
equals total cost. A loss making firm in the short run still continues operation in the short run
if price is greater than average variable cost. By doing so firm can recover its variable costs
and some of the fixed cost as well. However, once the price is smaller than average variable
cost firm shuts down its operation (Karl et al. 2019).
Answer c
Figure 6: Profit maximization by a price taking firm
A price taking firm always face an infinitely elastic demand curve. As the firm has to
take market price as given marginal revenue and average revenue of the firm is same as price.
Profit maximization of a firm requires marginal revenue equals marginal cost. For a profit
maximizing firm however, the condition reduces to price = marginal condition. For second
order condition for profit maximization condition to be satisfied the marginal cost curve
should cut the price line from below. In the above figure, the price taking firm reaches to
profit maximizing output level at point A.
Paraphrase This Document
Need a fresh take? Get an instant paraphrase of this document with our AI Paraphraser

10ECONOMICS FOR DECISION MAKING

11ECONOMICS FOR DECISION MAKING
Answer 5
The banking industry in Australia is similar to an oligopoly market. Four of the
largest banks in Australia – Commonwealth Bank, ANZ, Westpac and National Australian
Bank together have almost 75 percent share in the market (Bullock 2019). Additionally, there
are high entry barriers for new entrants in the industry making the market structure closer to a
monopoly market.
Dominance of one or few firms in the market is not beneficial for the interest of
generally banks. As the dominating firm is price maker in the industry, a higher price is
charged for the given product or service. Due to lack of competition in the market consumers
are forced to purchase the product or service from the existing seller which lowers their
welfare (Coppock and Mateer 2017).
Examples of similar industries like Australian banking include national electricity
market, telecommunication industry and grocery supermarket.
⊘ This is a preview!⊘
Do you want full access?
Subscribe today to unlock all pages.

Trusted by 1+ million students worldwide
1 out of 13
Related Documents
Your All-in-One AI-Powered Toolkit for Academic Success.
+13062052269
info@desklib.com
Available 24*7 on WhatsApp / Email
Unlock your academic potential
Copyright © 2020–2025 A2Z Services. All Rights Reserved. Developed and managed by ZUCOL.


