Economic Analysis Assignment: Regular and Organic Ice Cream Demand
VerifiedAdded on 2021/04/21
|12
|1181
|89
Homework Assignment
AI Summary
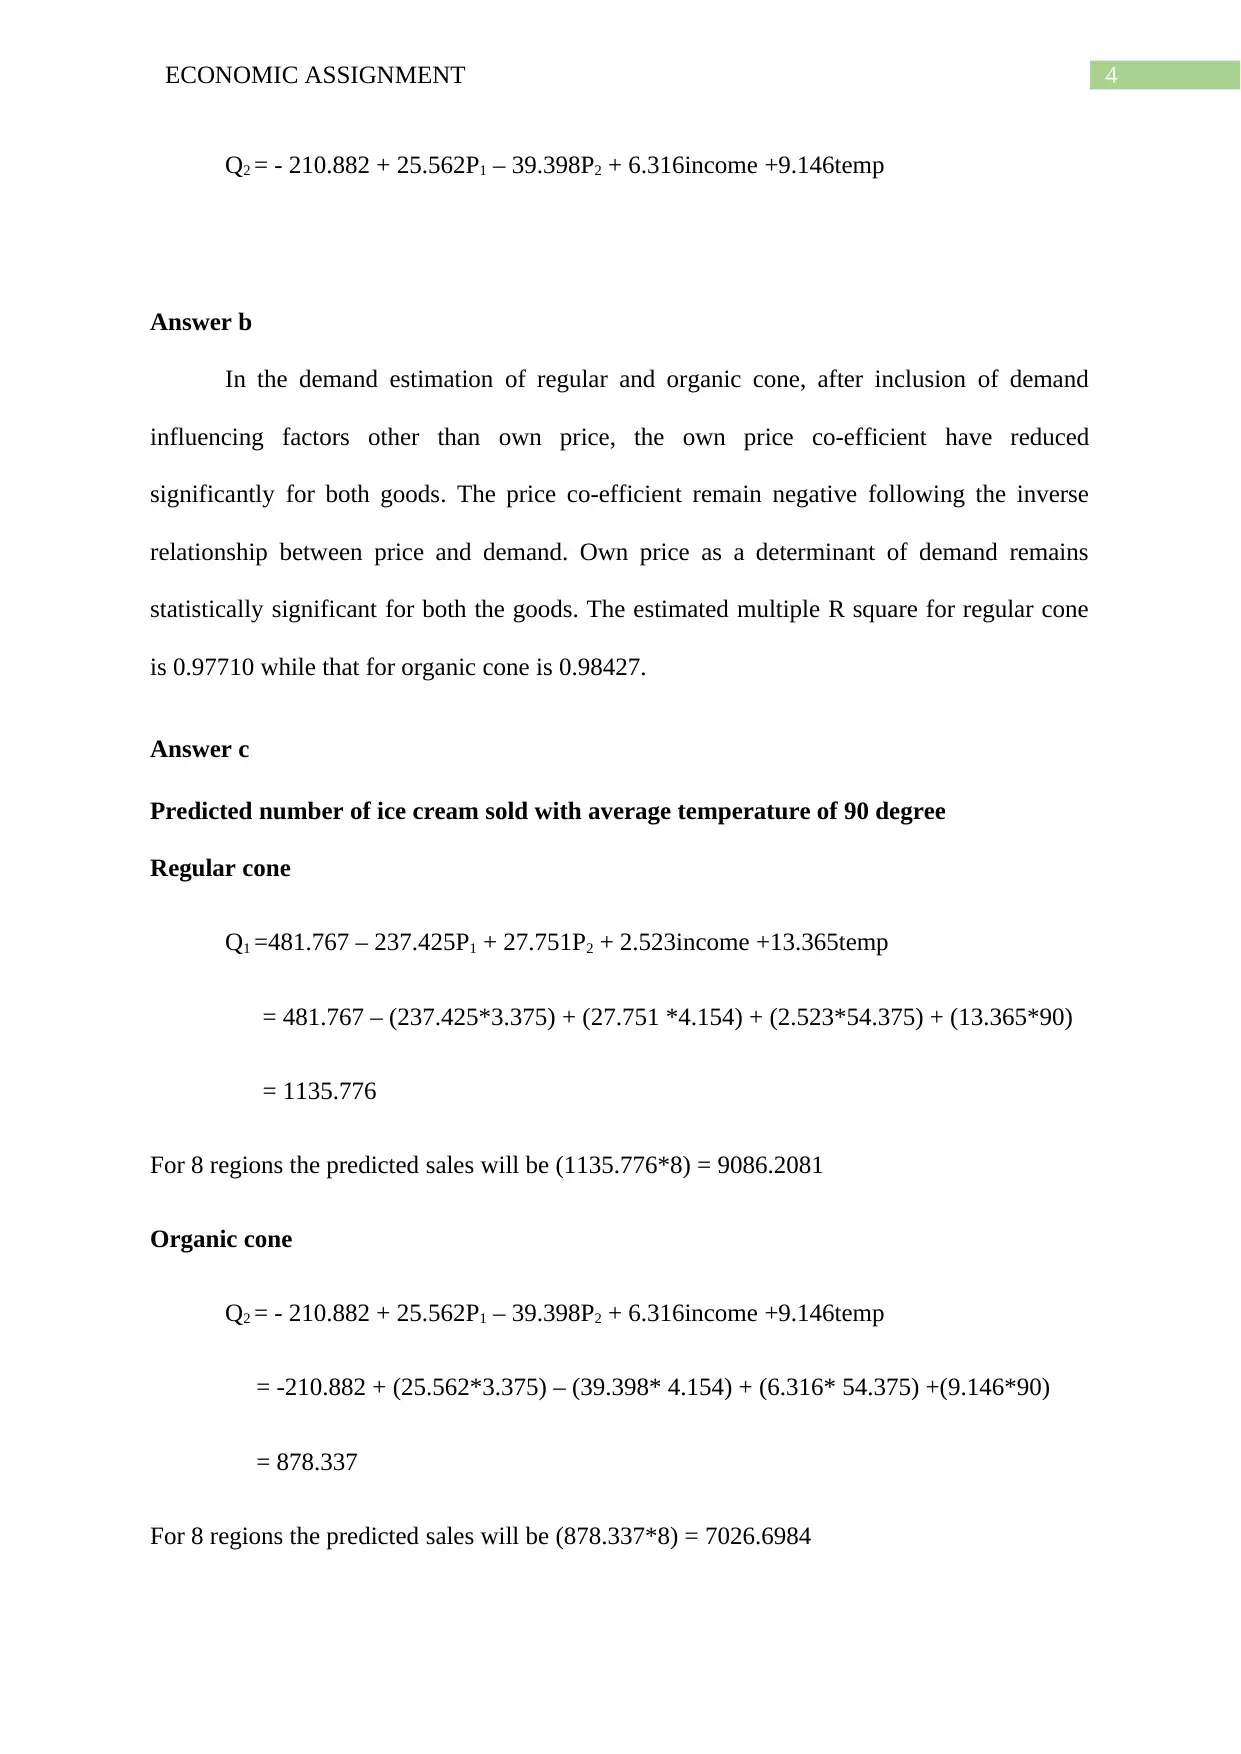
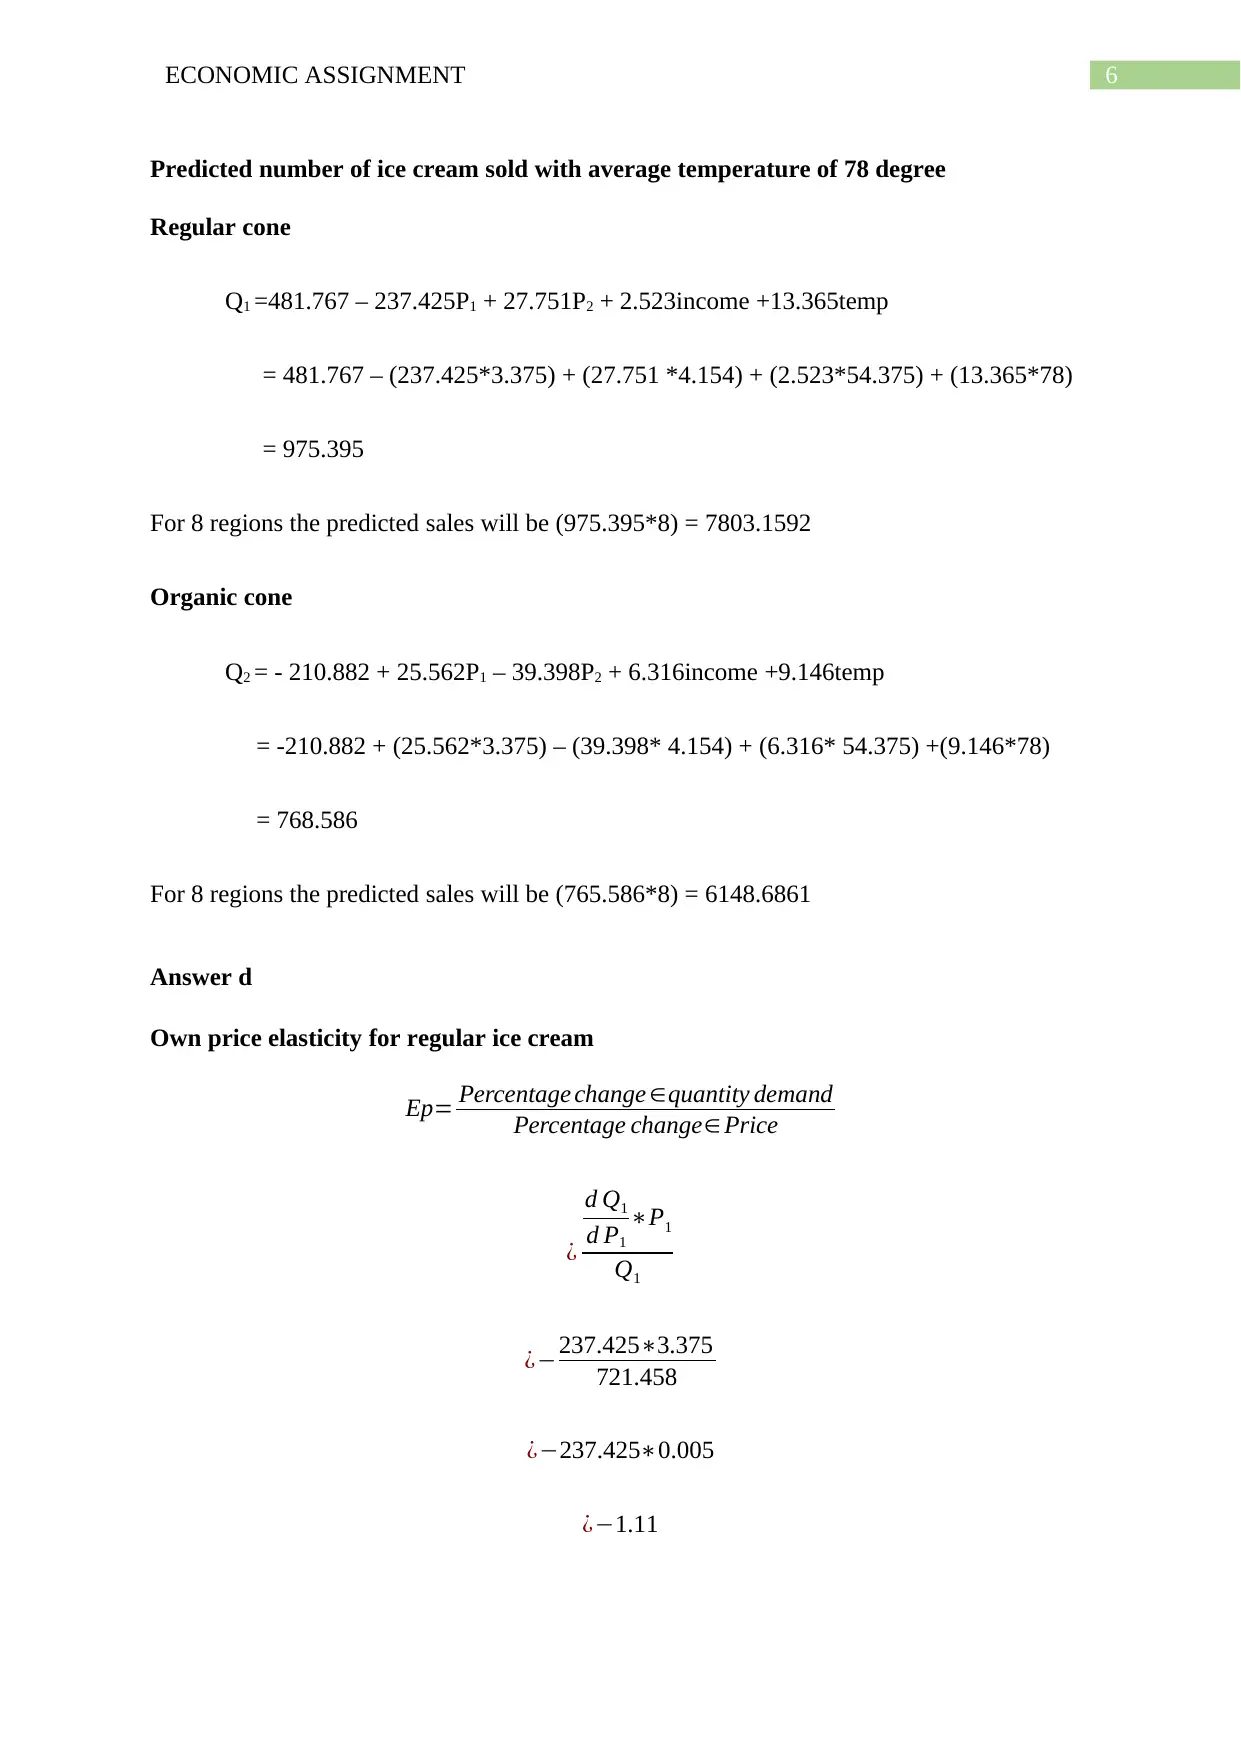
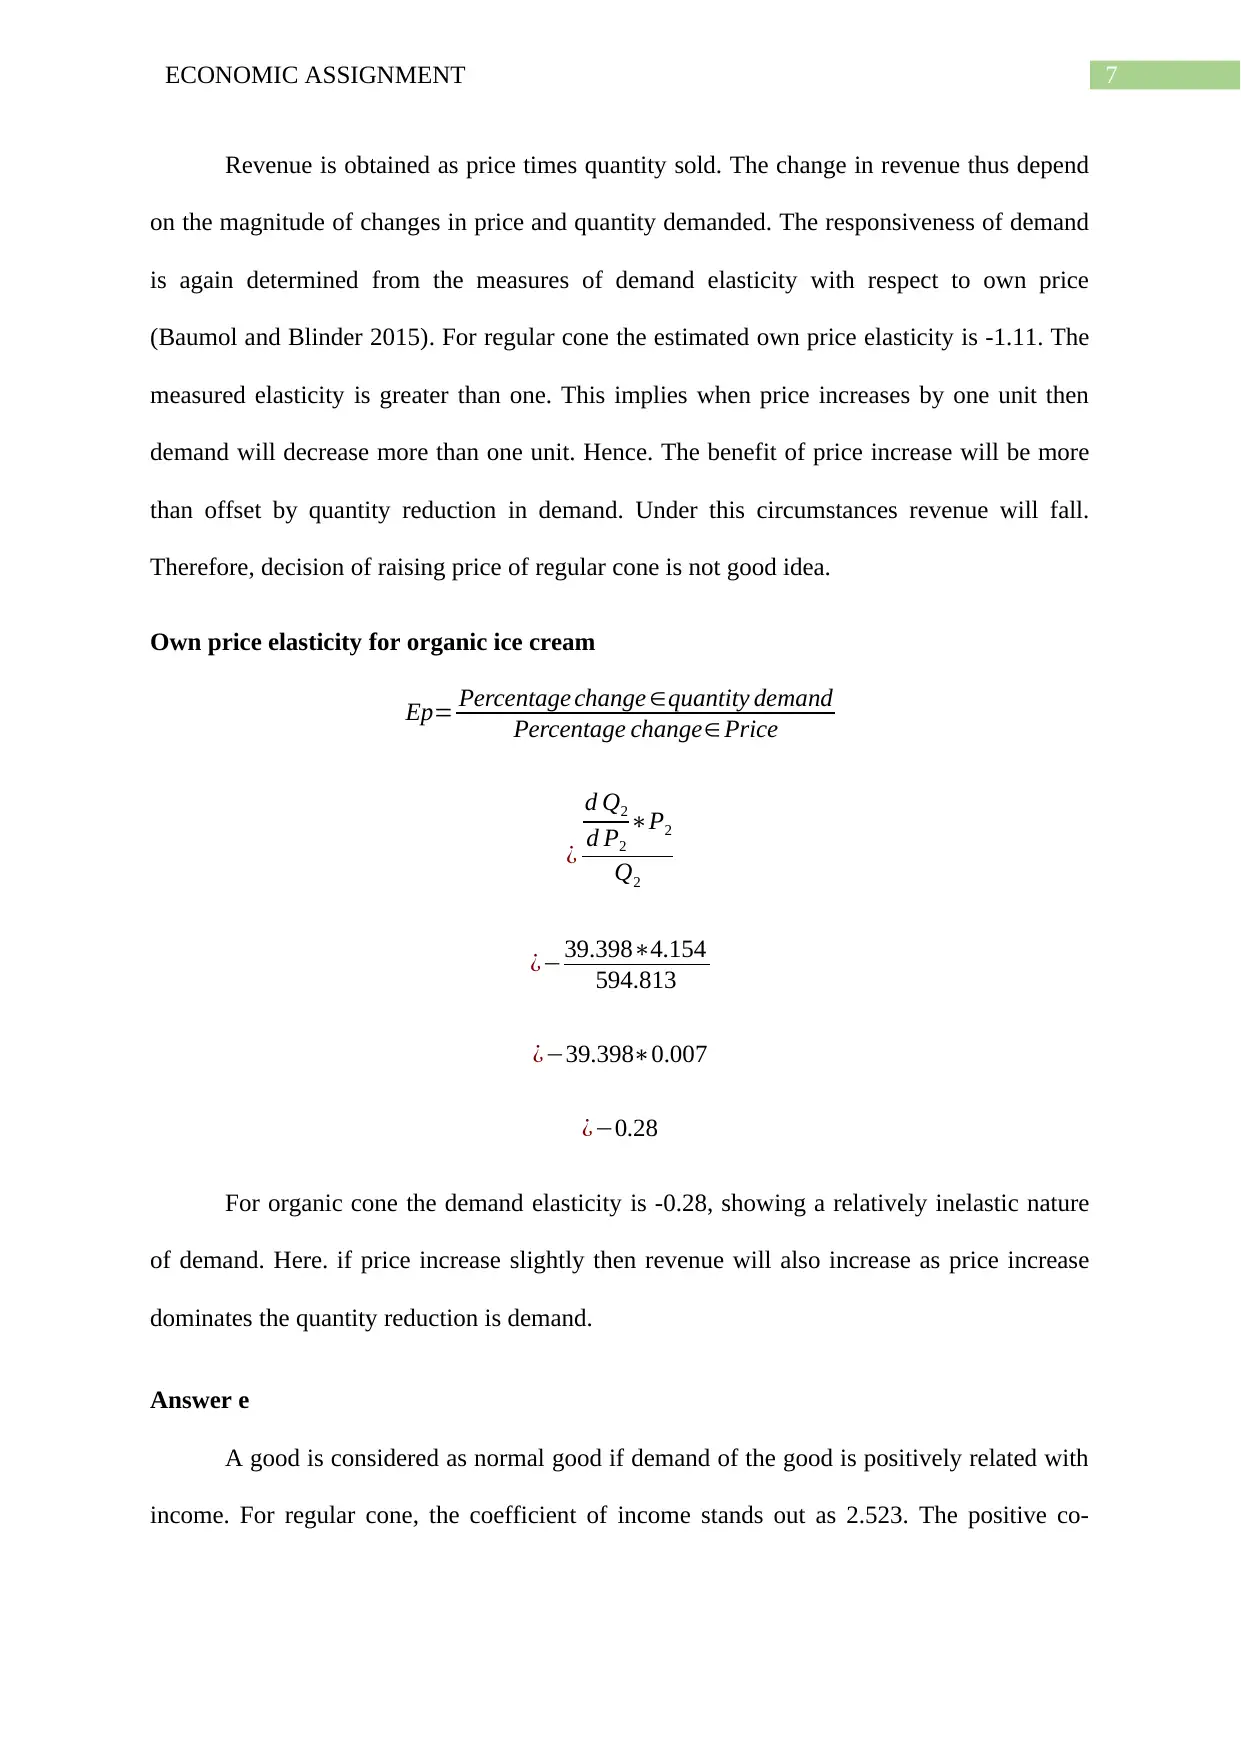
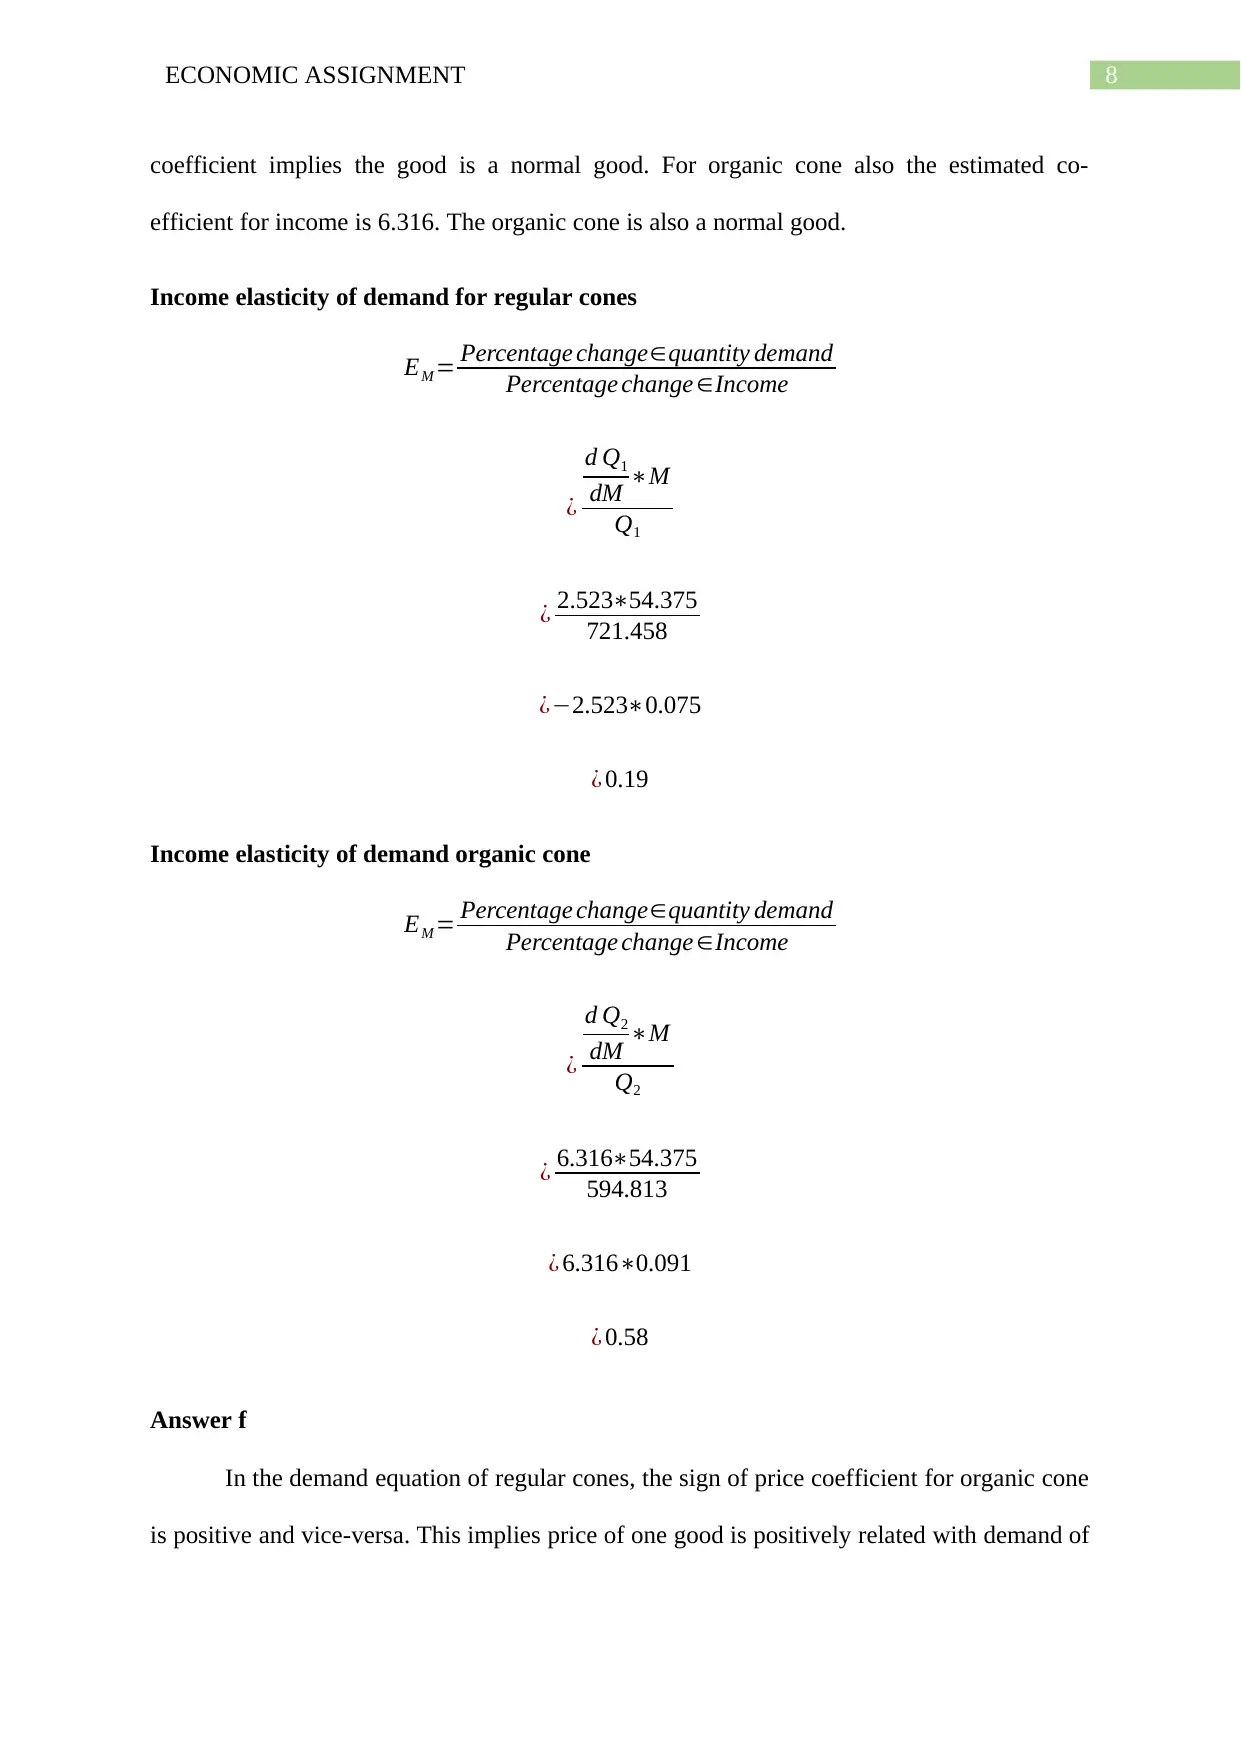
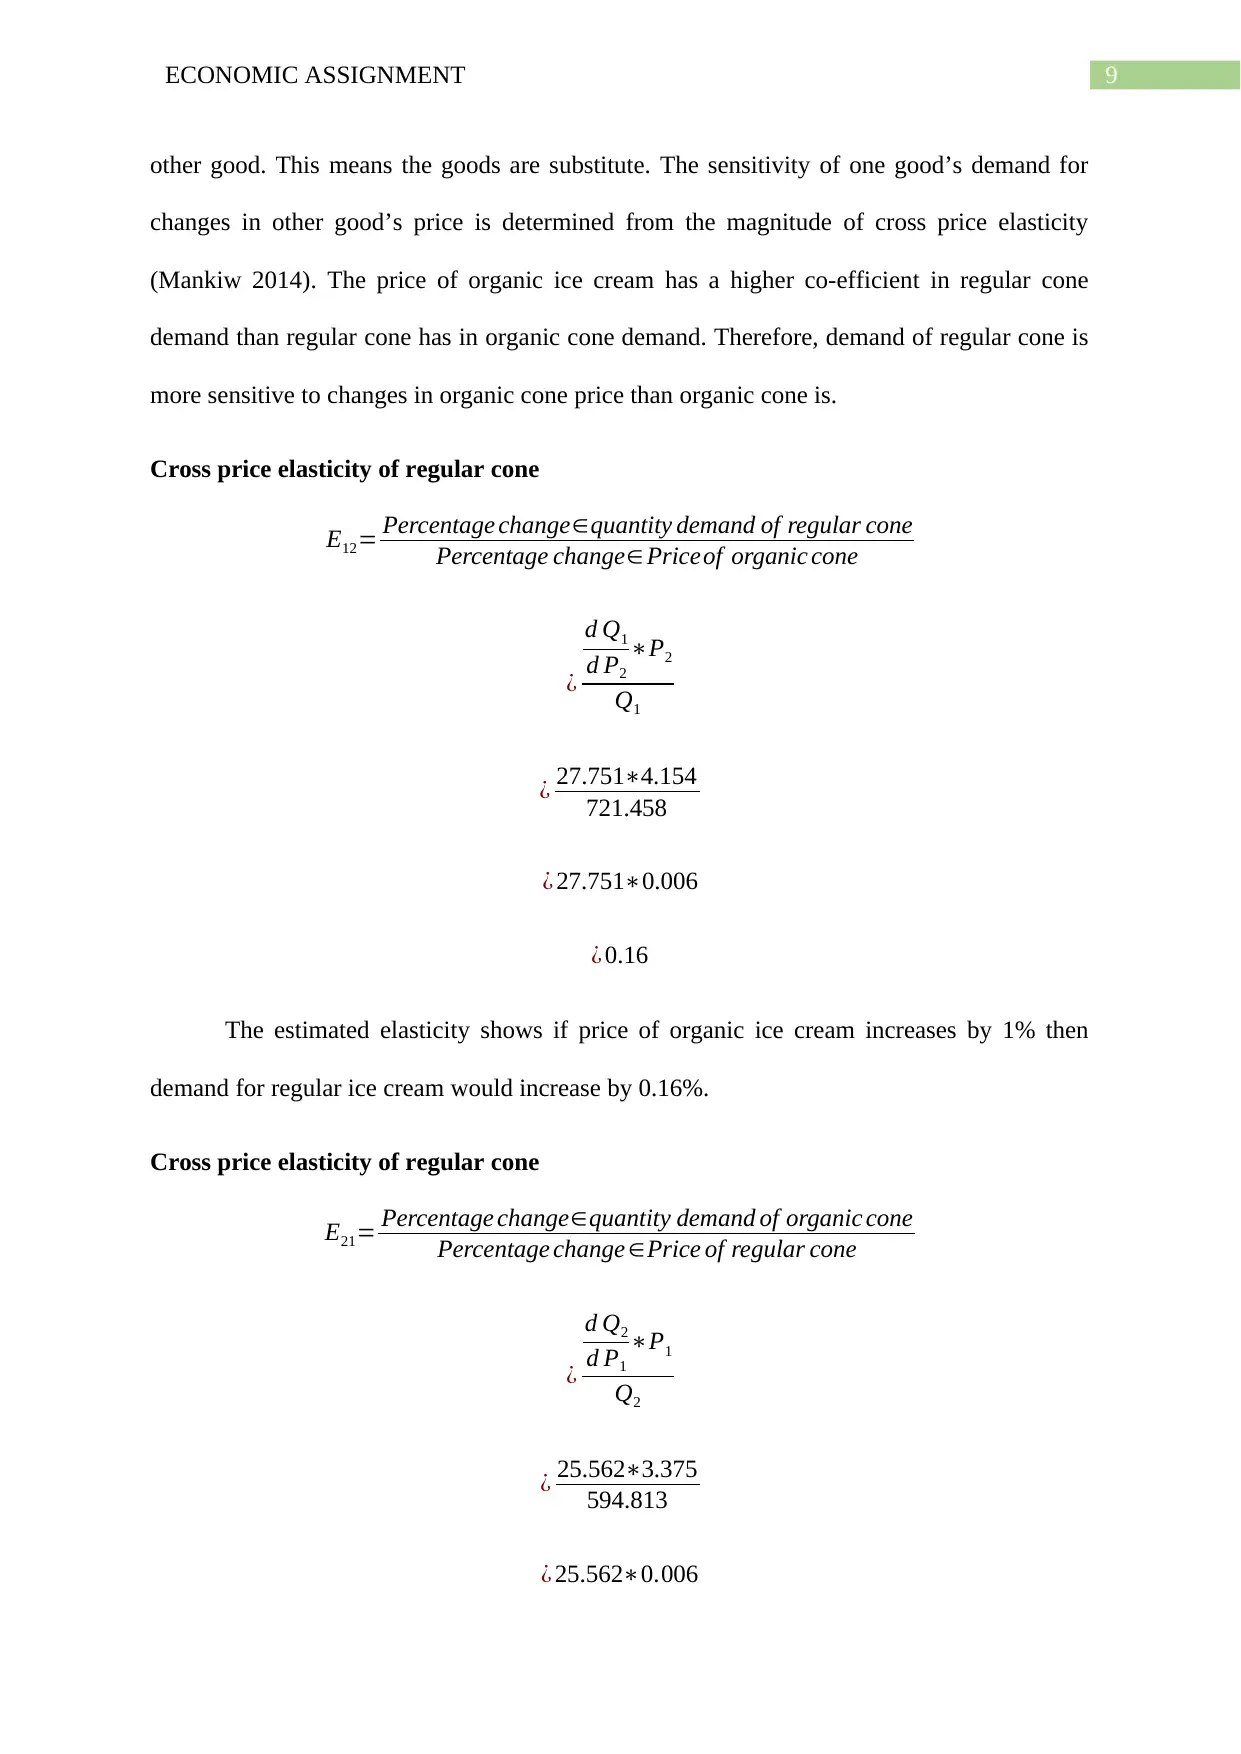
This economics assignment analyzes the demand for regular and organic ice cream using multiple regression analysis. The assignment explores the relationship between quantity demanded and factors such as own price, the price of the other good, income, and temperature. The student calculates and interprets regression statistics, including R-squared, coefficients, and p-values to determine the significance of each factor. The assignment also involves predicting ice cream sales at different temperatures and calculating various elasticities, including own price, income, and cross-price elasticity. The analysis reveals that both regular and organic ice cream are normal goods, and the goods are substitutes. The assignment concludes with an analysis of the implications of the elasticity calculations for pricing and revenue management.

Running Head: ECONOMIC ASSIGNMENT
Economic Assignment
Name of the Student
Name of the University
Author note
Economic Assignment
Name of the Student
Name of the University
Author note
Paraphrase This Document
Need a fresh take? Get an instant paraphrase of this document with our AI Paraphraser

1ECONOMIC ASSIGNMENT
Table of Contents
Answer a.....................................................................................................................................2
Answer b....................................................................................................................................4
Answer c.....................................................................................................................................4
Predicted number of ice cream sold with average temperature of 90 degree........................4
Predicted number of ice cream sold with average temperature of 78 degree........................5
Answer d....................................................................................................................................5
Own price elasticity for regular ice cream.............................................................................5
Own price elasticity for organic ice cream............................................................................6
Answer e.....................................................................................................................................6
Income elasticity of demand for regular cones......................................................................7
Income elasticity of demand organic cone.............................................................................7
Answer f.....................................................................................................................................7
Cross price elasticity of regular cone.....................................................................................8
Reference list............................................................................................................................10

2ECONOMIC ASSIGNMENT
Answer a
The multiple regression set for regular and organic ice cream demand is as follows
Quantity demanded = a + (b* own price) + (c * other good’s price) + (d * income) + (e *
temperature)
A: intercept
B: Coefficient of own price
C: Coefficient of other good’s price
D: Coefficient of income
E: Coefficient of temperature
The obtained regression results are
Regular cone
Regression Statistics
Multiple R 0.98
R Square 0.95
Adjusted R Square 0.95
Standard Error 78.95
Observations 96.00
ANOVA
df SS MS F Significance F
Regression 4 11959267.97 2989816.99 479.6392 3.11237E-60
Residual
9
1 567245.8632 6233.47102
Total
9
5 12526513.83
⊘ This is a preview!⊘
Do you want full access?
Subscribe today to unlock all pages.

Trusted by 1+ million students worldwide

3ECONOMIC ASSIGNMENT
Coefficients
Standard
Error t Stat P-value Lower 95% Upper 95%
Intercept 481.767 57.186 8.425 0.000 368.175 595.359
p1 -237.425 11.749 -20.209 0.000 -260.763 -214.088
p2 27.751 13.246 2.095 0.039 1.438 54.063
income 2.523 0.271 9.315 0.000 1.985 3.061
temp 13.365 0.430 31.109 0.000 12.512 14.218
Therefore, estimated multiple regression equation for regular cone demand is
Q1 =481.767 – 237.425P1 + 27.751P2 + 2.523income +13.365temp
Organic cone
Regression Statistics
Multiple R 0.98
R Square 0.97
Adjusted R Square 0.97
Standard Error 47.38
Observations 96
ANOVA
df SS MS F Significance F
Regression 4 6340130.754 1585032.69 706.101 1.40144E-67
Residual
9
1 204273.8712 2244.76782
Total
9
5 6544404.625
Coefficients
Standard
Error t Stat P-value Lower 95% Upper 95%
Intercept -210.882 34.317 -6.145 0.000 -279.048 -142.716
p1 25.562 7.050 3.626 0.000 11.557 39.566
p2 -39.398 7.949 -4.956 0.000 -55.188 -23.608
income 6.316 0.163 38.859 0.000 5.994 6.639
temp 9.146 0.258 35.475 0.000 8.634 9.658
Therefore, estimated multiple regression equation for regular cone demand is
Coefficients
Standard
Error t Stat P-value Lower 95% Upper 95%
Intercept 481.767 57.186 8.425 0.000 368.175 595.359
p1 -237.425 11.749 -20.209 0.000 -260.763 -214.088
p2 27.751 13.246 2.095 0.039 1.438 54.063
income 2.523 0.271 9.315 0.000 1.985 3.061
temp 13.365 0.430 31.109 0.000 12.512 14.218
Therefore, estimated multiple regression equation for regular cone demand is
Q1 =481.767 – 237.425P1 + 27.751P2 + 2.523income +13.365temp
Organic cone
Regression Statistics
Multiple R 0.98
R Square 0.97
Adjusted R Square 0.97
Standard Error 47.38
Observations 96
ANOVA
df SS MS F Significance F
Regression 4 6340130.754 1585032.69 706.101 1.40144E-67
Residual
9
1 204273.8712 2244.76782
Total
9
5 6544404.625
Coefficients
Standard
Error t Stat P-value Lower 95% Upper 95%
Intercept -210.882 34.317 -6.145 0.000 -279.048 -142.716
p1 25.562 7.050 3.626 0.000 11.557 39.566
p2 -39.398 7.949 -4.956 0.000 -55.188 -23.608
income 6.316 0.163 38.859 0.000 5.994 6.639
temp 9.146 0.258 35.475 0.000 8.634 9.658
Therefore, estimated multiple regression equation for regular cone demand is
Paraphrase This Document
Need a fresh take? Get an instant paraphrase of this document with our AI Paraphraser

4ECONOMIC ASSIGNMENT
Q2 = - 210.882 + 25.562P1 – 39.398P2 + 6.316income +9.146temp
Answer b
In the demand estimation of regular and organic cone, after inclusion of demand
influencing factors other than own price, the own price co-efficient have reduced
significantly for both goods. The price co-efficient remain negative following the inverse
relationship between price and demand. Own price as a determinant of demand remains
statistically significant for both the goods. The estimated multiple R square for regular cone
is 0.97710 while that for organic cone is 0.98427.
Answer c
Predicted number of ice cream sold with average temperature of 90 degree
Regular cone
Q1 =481.767 – 237.425P1 + 27.751P2 + 2.523income +13.365temp
= 481.767 – (237.425*3.375) + (27.751 *4.154) + (2.523*54.375) + (13.365*90)
= 1135.776
For 8 regions the predicted sales will be (1135.776*8) = 9086.2081
Organic cone
Q2 = - 210.882 + 25.562P1 – 39.398P2 + 6.316income +9.146temp
= -210.882 + (25.562*3.375) – (39.398* 4.154) + (6.316* 54.375) +(9.146*90)
= 878.337
For 8 regions the predicted sales will be (878.337*8) = 7026.6984
Q2 = - 210.882 + 25.562P1 – 39.398P2 + 6.316income +9.146temp
Answer b
In the demand estimation of regular and organic cone, after inclusion of demand
influencing factors other than own price, the own price co-efficient have reduced
significantly for both goods. The price co-efficient remain negative following the inverse
relationship between price and demand. Own price as a determinant of demand remains
statistically significant for both the goods. The estimated multiple R square for regular cone
is 0.97710 while that for organic cone is 0.98427.
Answer c
Predicted number of ice cream sold with average temperature of 90 degree
Regular cone
Q1 =481.767 – 237.425P1 + 27.751P2 + 2.523income +13.365temp
= 481.767 – (237.425*3.375) + (27.751 *4.154) + (2.523*54.375) + (13.365*90)
= 1135.776
For 8 regions the predicted sales will be (1135.776*8) = 9086.2081
Organic cone
Q2 = - 210.882 + 25.562P1 – 39.398P2 + 6.316income +9.146temp
= -210.882 + (25.562*3.375) – (39.398* 4.154) + (6.316* 54.375) +(9.146*90)
= 878.337
For 8 regions the predicted sales will be (878.337*8) = 7026.6984

5ECONOMIC ASSIGNMENT
⊘ This is a preview!⊘
Do you want full access?
Subscribe today to unlock all pages.

Trusted by 1+ million students worldwide

6ECONOMIC ASSIGNMENT
Predicted number of ice cream sold with average temperature of 78 degree
Regular cone
Q1 =481.767 – 237.425P1 + 27.751P2 + 2.523income +13.365temp
= 481.767 – (237.425*3.375) + (27.751 *4.154) + (2.523*54.375) + (13.365*78)
= 975.395
For 8 regions the predicted sales will be (975.395*8) = 7803.1592
Organic cone
Q2 = - 210.882 + 25.562P1 – 39.398P2 + 6.316income +9.146temp
= -210.882 + (25.562*3.375) – (39.398* 4.154) + (6.316* 54.375) +(9.146*78)
= 768.586
For 8 regions the predicted sales will be (765.586*8) = 6148.6861
Answer d
Own price elasticity for regular ice cream
Ep= Percentage change ∈quantity demand
Percentage change∈ Price
¿
d Q1
d P1
∗P1
Q1
¿−237.425∗3.375
721.458
¿−237.425∗0.005
¿−1.11
Paraphrase This Document
Need a fresh take? Get an instant paraphrase of this document with our AI Paraphraser

7ECONOMIC ASSIGNMENT
Revenue is obtained as price times quantity sold. The change in revenue thus depend
on the magnitude of changes in price and quantity demanded. The responsiveness of demand
is again determined from the measures of demand elasticity with respect to own price
(Baumol and Blinder 2015). For regular cone the estimated own price elasticity is -1.11. The
measured elasticity is greater than one. This implies when price increases by one unit then
demand will decrease more than one unit. Hence. The benefit of price increase will be more
than offset by quantity reduction in demand. Under this circumstances revenue will fall.
Therefore, decision of raising price of regular cone is not good idea.
Own price elasticity for organic ice cream
Ep= Percentage change ∈quantity demand
Percentage change∈ Price
¿
d Q2
d P2
∗P2
Q2
¿−39.398∗4.154
594.813
¿−39.398∗0.007
¿−0.28
For organic cone the demand elasticity is -0.28, showing a relatively inelastic nature
of demand. Here. if price increase slightly then revenue will also increase as price increase
dominates the quantity reduction is demand.
Answer e
A good is considered as normal good if demand of the good is positively related with
income. For regular cone, the coefficient of income stands out as 2.523. The positive co-

8ECONOMIC ASSIGNMENT
coefficient implies the good is a normal good. For organic cone also the estimated co-
efficient for income is 6.316. The organic cone is also a normal good.
Income elasticity of demand for regular cones
EM = Percentage change∈quantity demand
Percentage change ∈Income
¿
d Q1
dM ∗M
Q1
¿ 2.523∗54.375
721.458
¿−2.523∗0.075
¿ 0.19
Income elasticity of demand organic cone
EM = Percentage change∈quantity demand
Percentage change ∈Income
¿
d Q2
dM ∗M
Q2
¿ 6.316∗54.375
594.813
¿ 6.316∗0.091
¿ 0.58
Answer f
In the demand equation of regular cones, the sign of price coefficient for organic cone
is positive and vice-versa. This implies price of one good is positively related with demand of
⊘ This is a preview!⊘
Do you want full access?
Subscribe today to unlock all pages.

Trusted by 1+ million students worldwide

9ECONOMIC ASSIGNMENT
other good. This means the goods are substitute. The sensitivity of one good’s demand for
changes in other good’s price is determined from the magnitude of cross price elasticity
(Mankiw 2014). The price of organic ice cream has a higher co-efficient in regular cone
demand than regular cone has in organic cone demand. Therefore, demand of regular cone is
more sensitive to changes in organic cone price than organic cone is.
Cross price elasticity of regular cone
E12= Percentage change∈quantity demand of regular cone
Percentage change∈ Priceof organic cone
¿
d Q1
d P2
∗P2
Q1
¿ 27.751∗4.154
721.458
¿ 27.751∗0.006
¿ 0.16
The estimated elasticity shows if price of organic ice cream increases by 1% then
demand for regular ice cream would increase by 0.16%.
Cross price elasticity of regular cone
E21= Percentage change∈quantity demand of organic cone
Percentage change ∈Price of regular cone
¿
d Q2
d P1
∗P1
Q2
¿ 25.562∗3.375
594.813
¿ 25.562∗0.006
Paraphrase This Document
Need a fresh take? Get an instant paraphrase of this document with our AI Paraphraser

10ECONOMIC ASSIGNMENT
¿ 0.15
The estimated elasticity shows if price of regular ice cream increases by 1% then
demand for regular ice cream would increase by 0.15%.
¿ 0.15
The estimated elasticity shows if price of regular ice cream increases by 1% then
demand for regular ice cream would increase by 0.15%.

11ECONOMIC ASSIGNMENT
Reference list
Baumol, W.J. and Blinder, A.S., 2015. Microeconomics: Principles and policy. Cengage
Learning.
Mankiw, N.G., 2014. Principles of macroeconomics. Cengage Learning.
Reference list
Baumol, W.J. and Blinder, A.S., 2015. Microeconomics: Principles and policy. Cengage
Learning.
Mankiw, N.G., 2014. Principles of macroeconomics. Cengage Learning.
⊘ This is a preview!⊘
Do you want full access?
Subscribe today to unlock all pages.

Trusted by 1+ million students worldwide
1 out of 12
Related Documents
Your All-in-One AI-Powered Toolkit for Academic Success.
+13062052269
info@desklib.com
Available 24*7 on WhatsApp / Email
Unlock your academic potential
Copyright © 2020–2025 A2Z Services. All Rights Reserved. Developed and managed by ZUCOL.


