University Business Economics: Demand Estimation Analysis Report
VerifiedAdded on 2022/08/21
|7
|597
|18
Homework Assignment
AI Summary
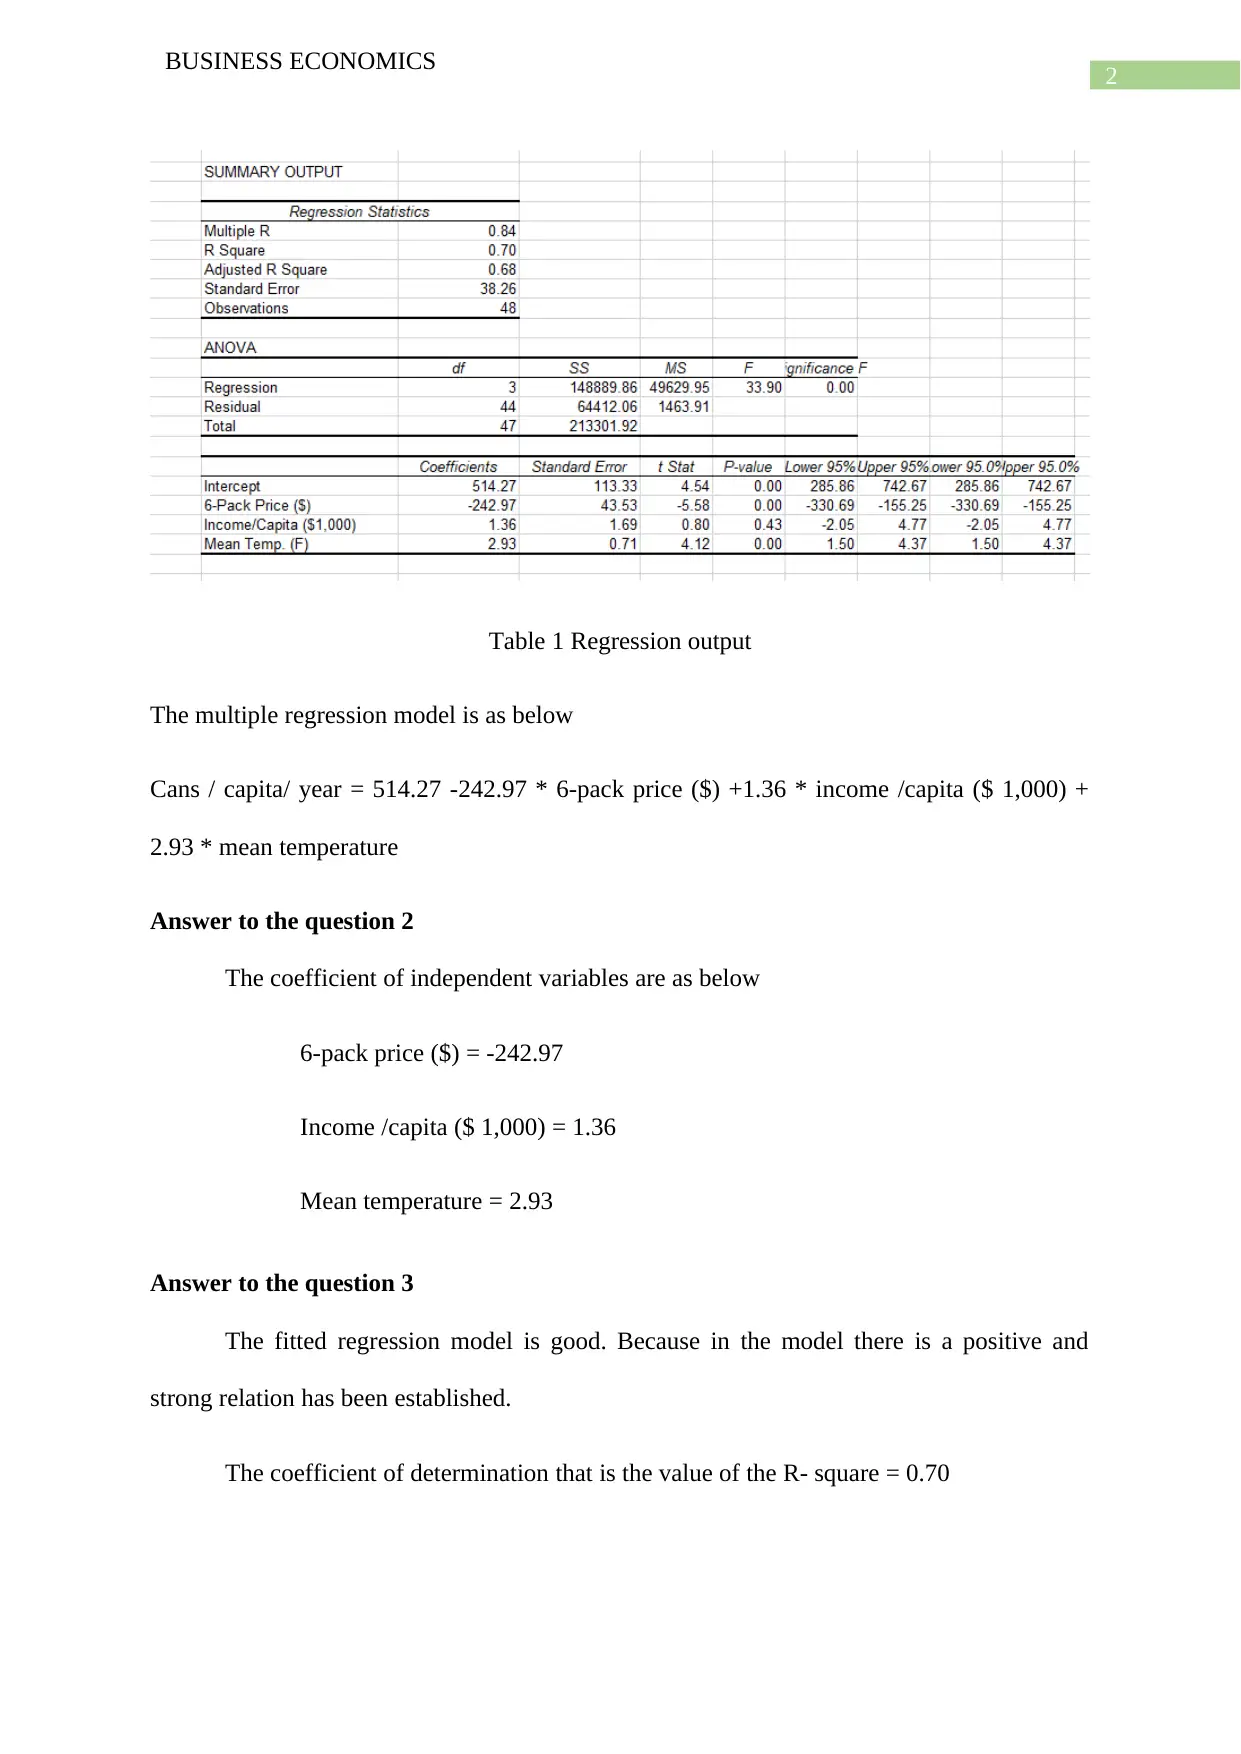
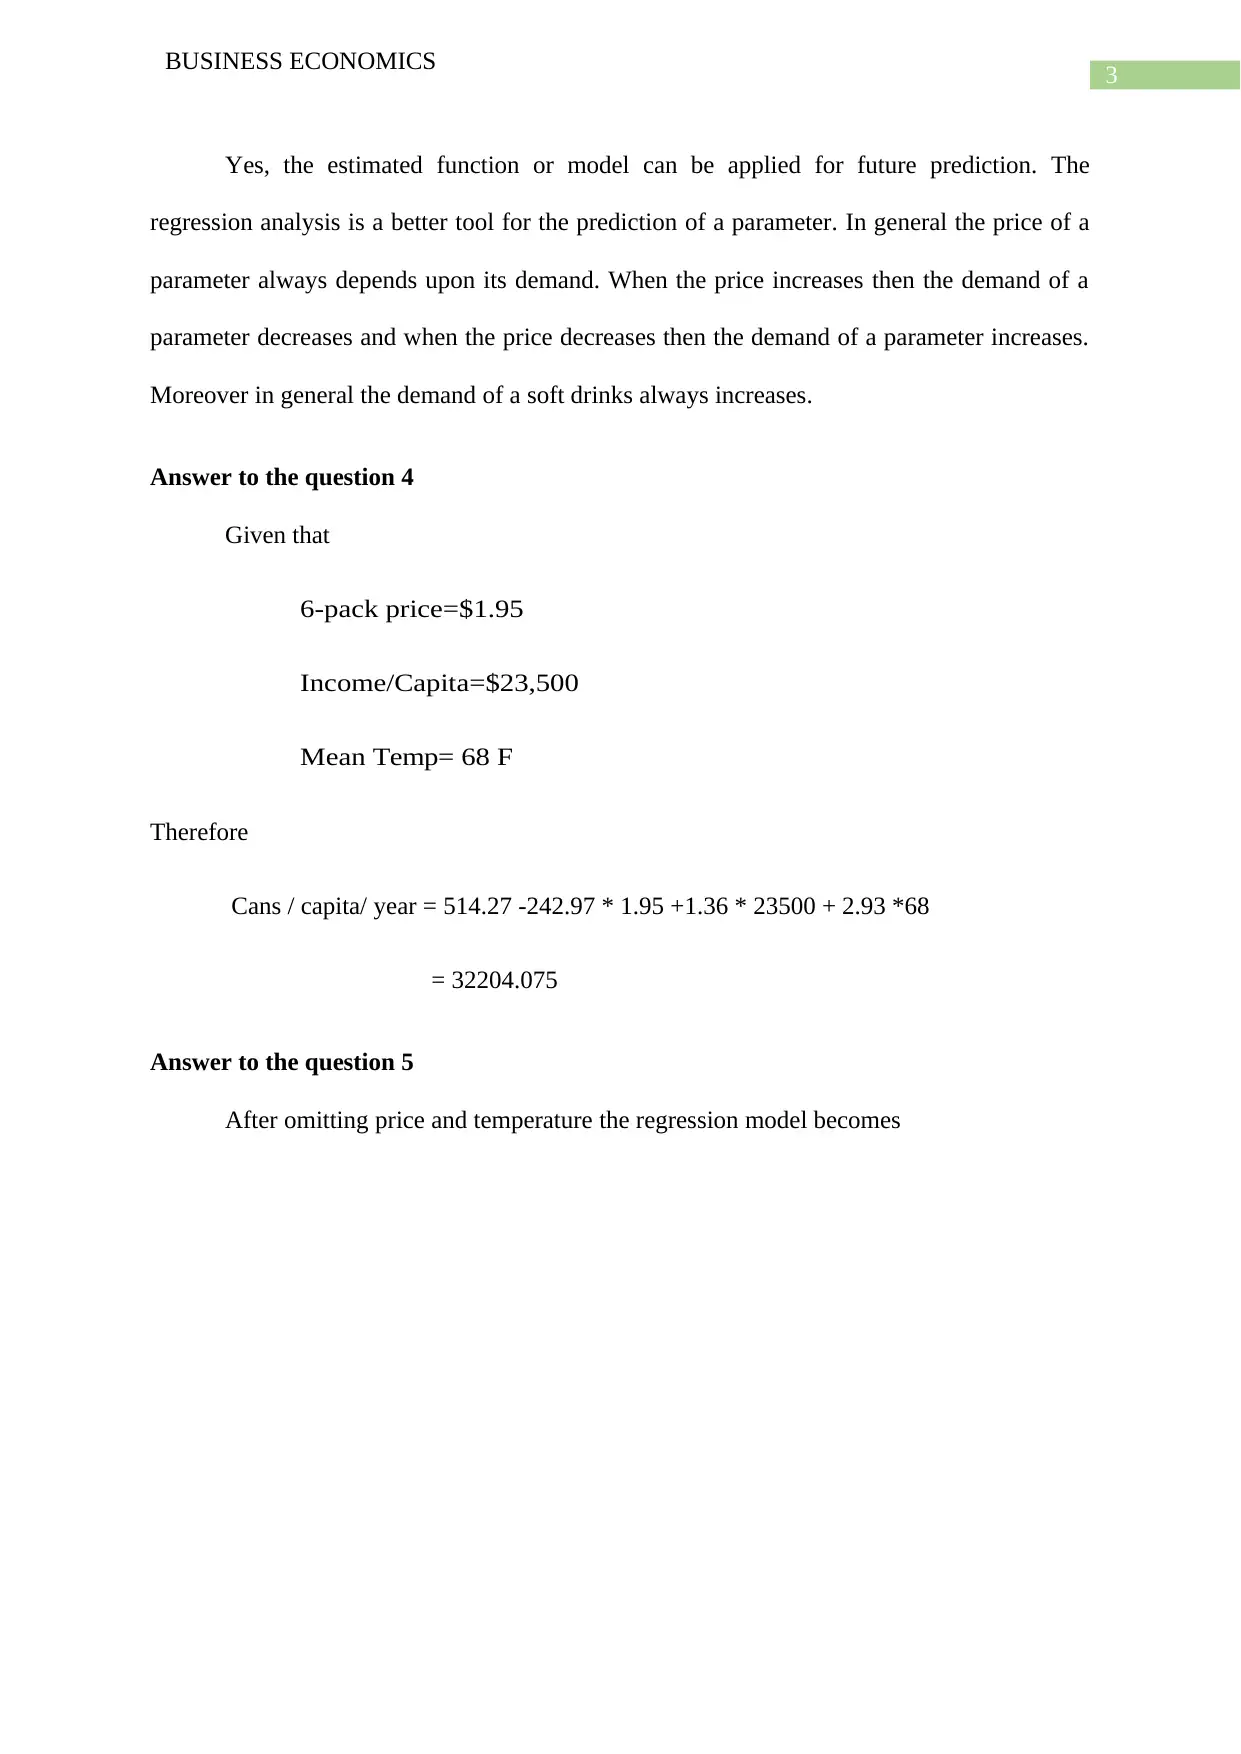
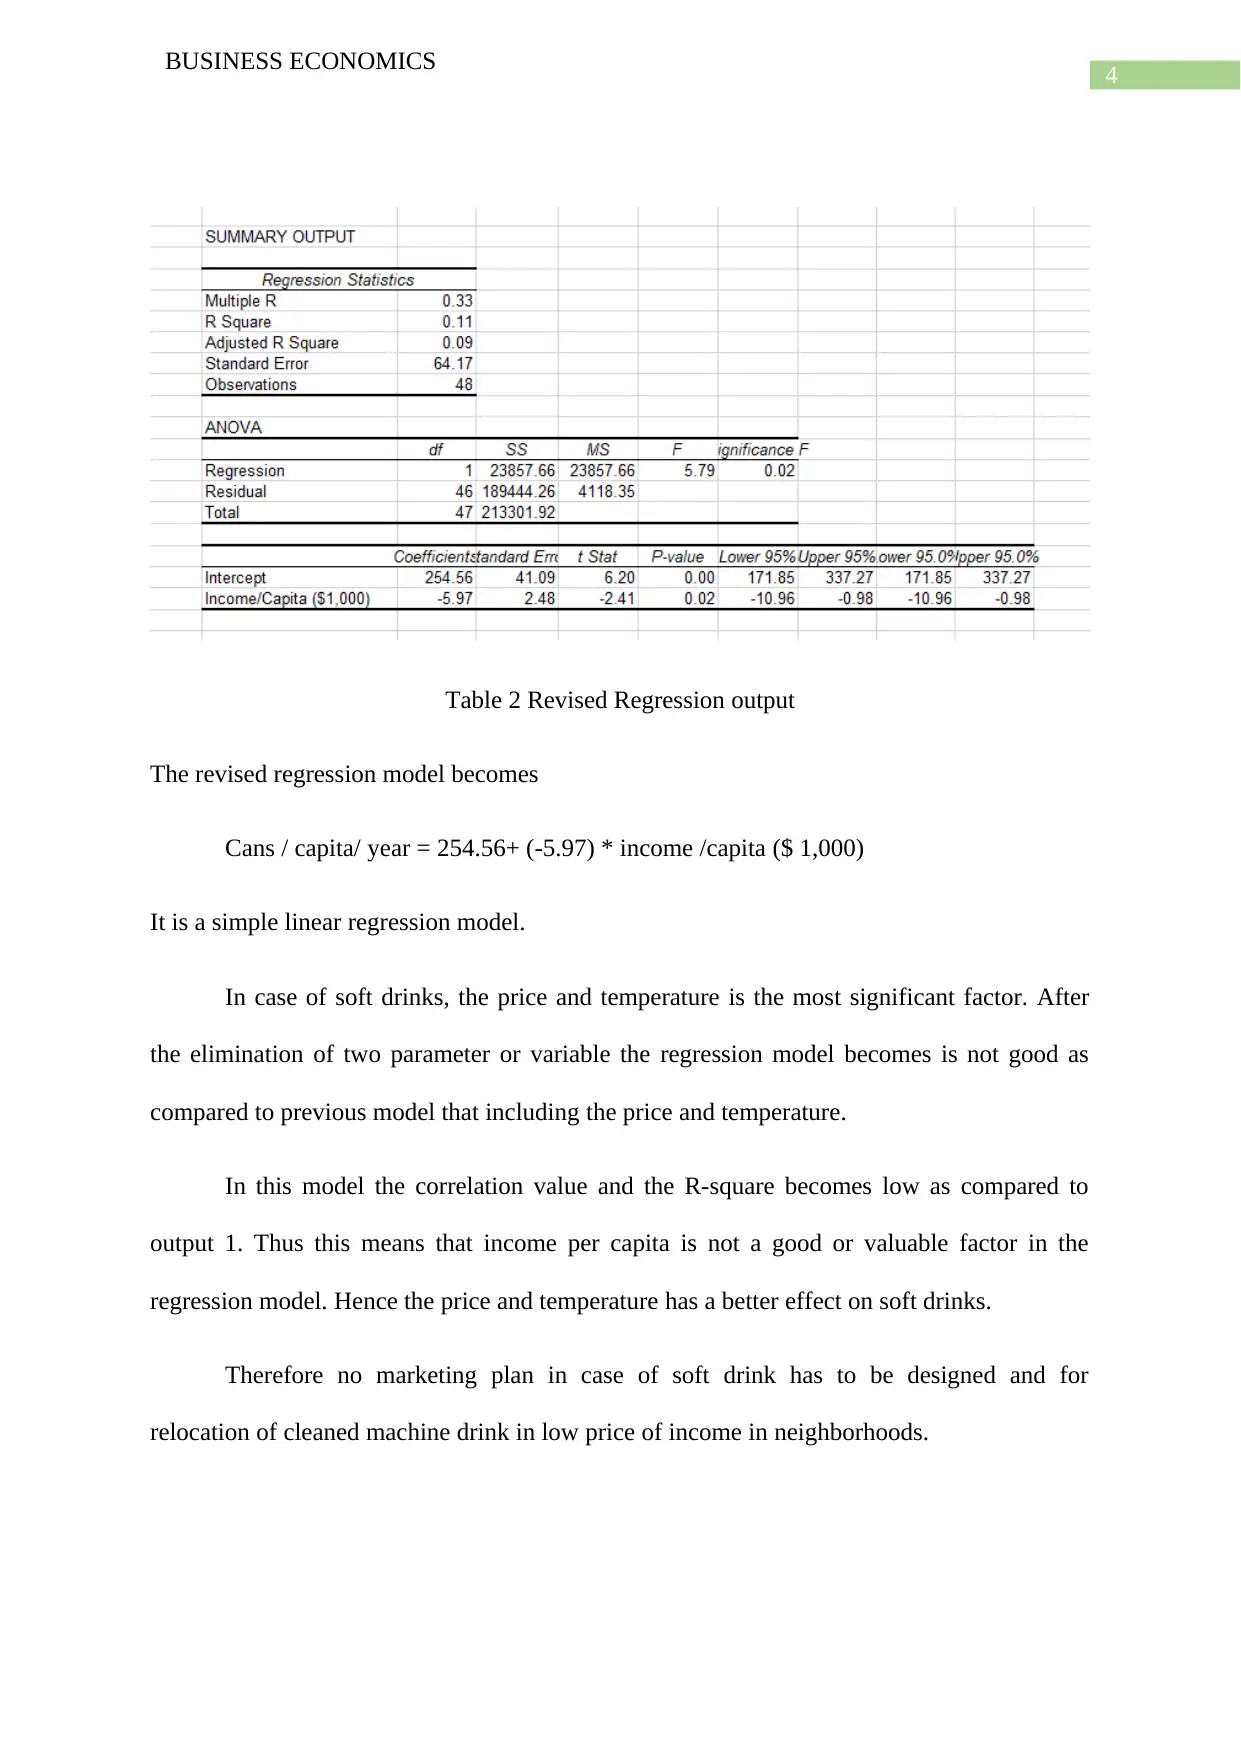
This assignment analyzes soft drink demand using a multiple linear regression model based on cross-sectional data from the United States. The student calculates and interprets the coefficients of independent variables like six-pack price, income per capita, and mean temperature to understand their impact on soft drink consumption. The analysis includes assessing the goodness of fit of the regression model using the coefficient of determination (R-square) and evaluating its predictive capabilities. The student then predicts soft drink consumption for a state with specific price, income, and temperature data. Furthermore, the assignment explores a revised regression model after omitting price and temperature variables, comparing its effectiveness to the initial model. The student concludes by discussing the significance of different factors in determining soft drink demand and their implications for marketing strategies.
1 out of 7
Your All-in-One AI-Powered Toolkit for Academic Success.
+13062052269
info@desklib.com
Available 24*7 on WhatsApp / Email
![[object Object]](/_next/static/media/star-bottom.7253800d.svg)
Copyright © 2020–2026 A2Z Services. All Rights Reserved. Developed and managed by ZUCOL.