Principles of Economics Assignment: Market Analysis and Elasticity
VerifiedAdded on 2022/11/14
|10
|1721
|221
Homework Assignment
AI Summary
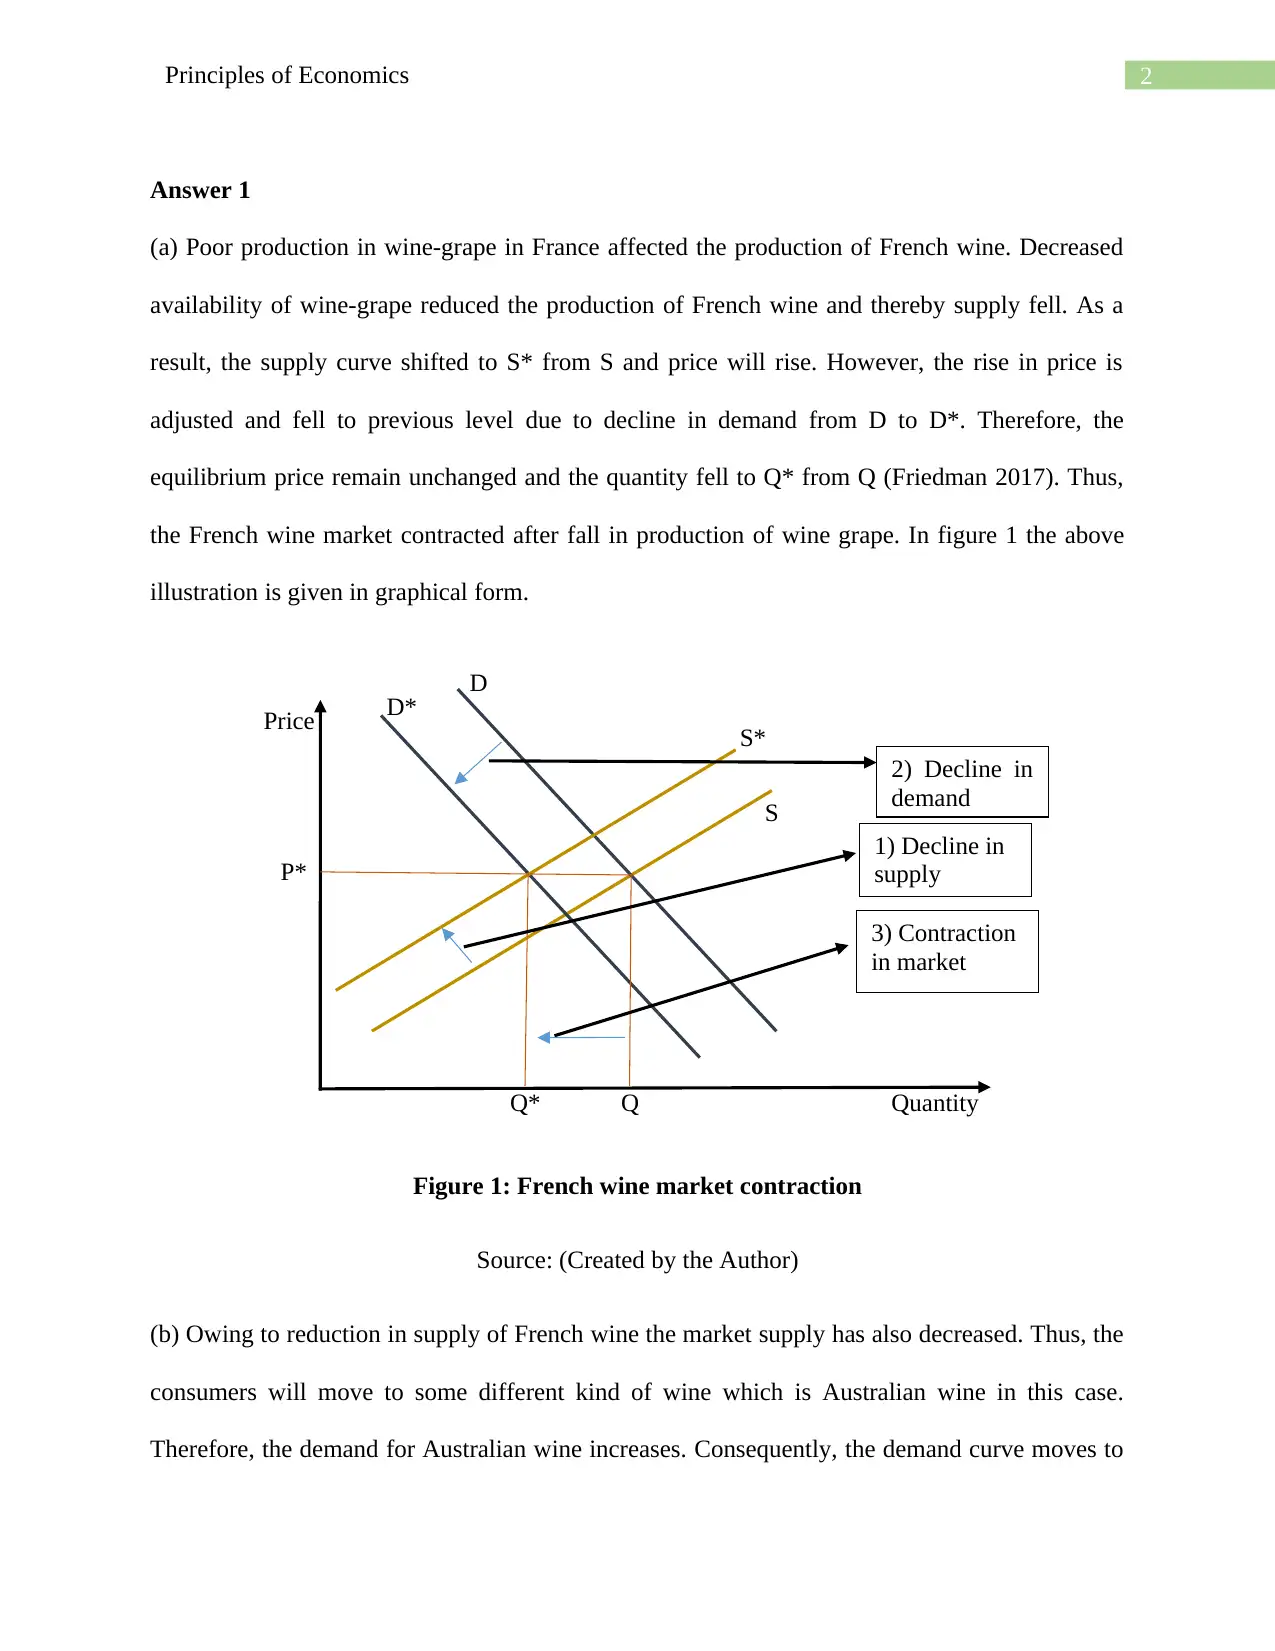
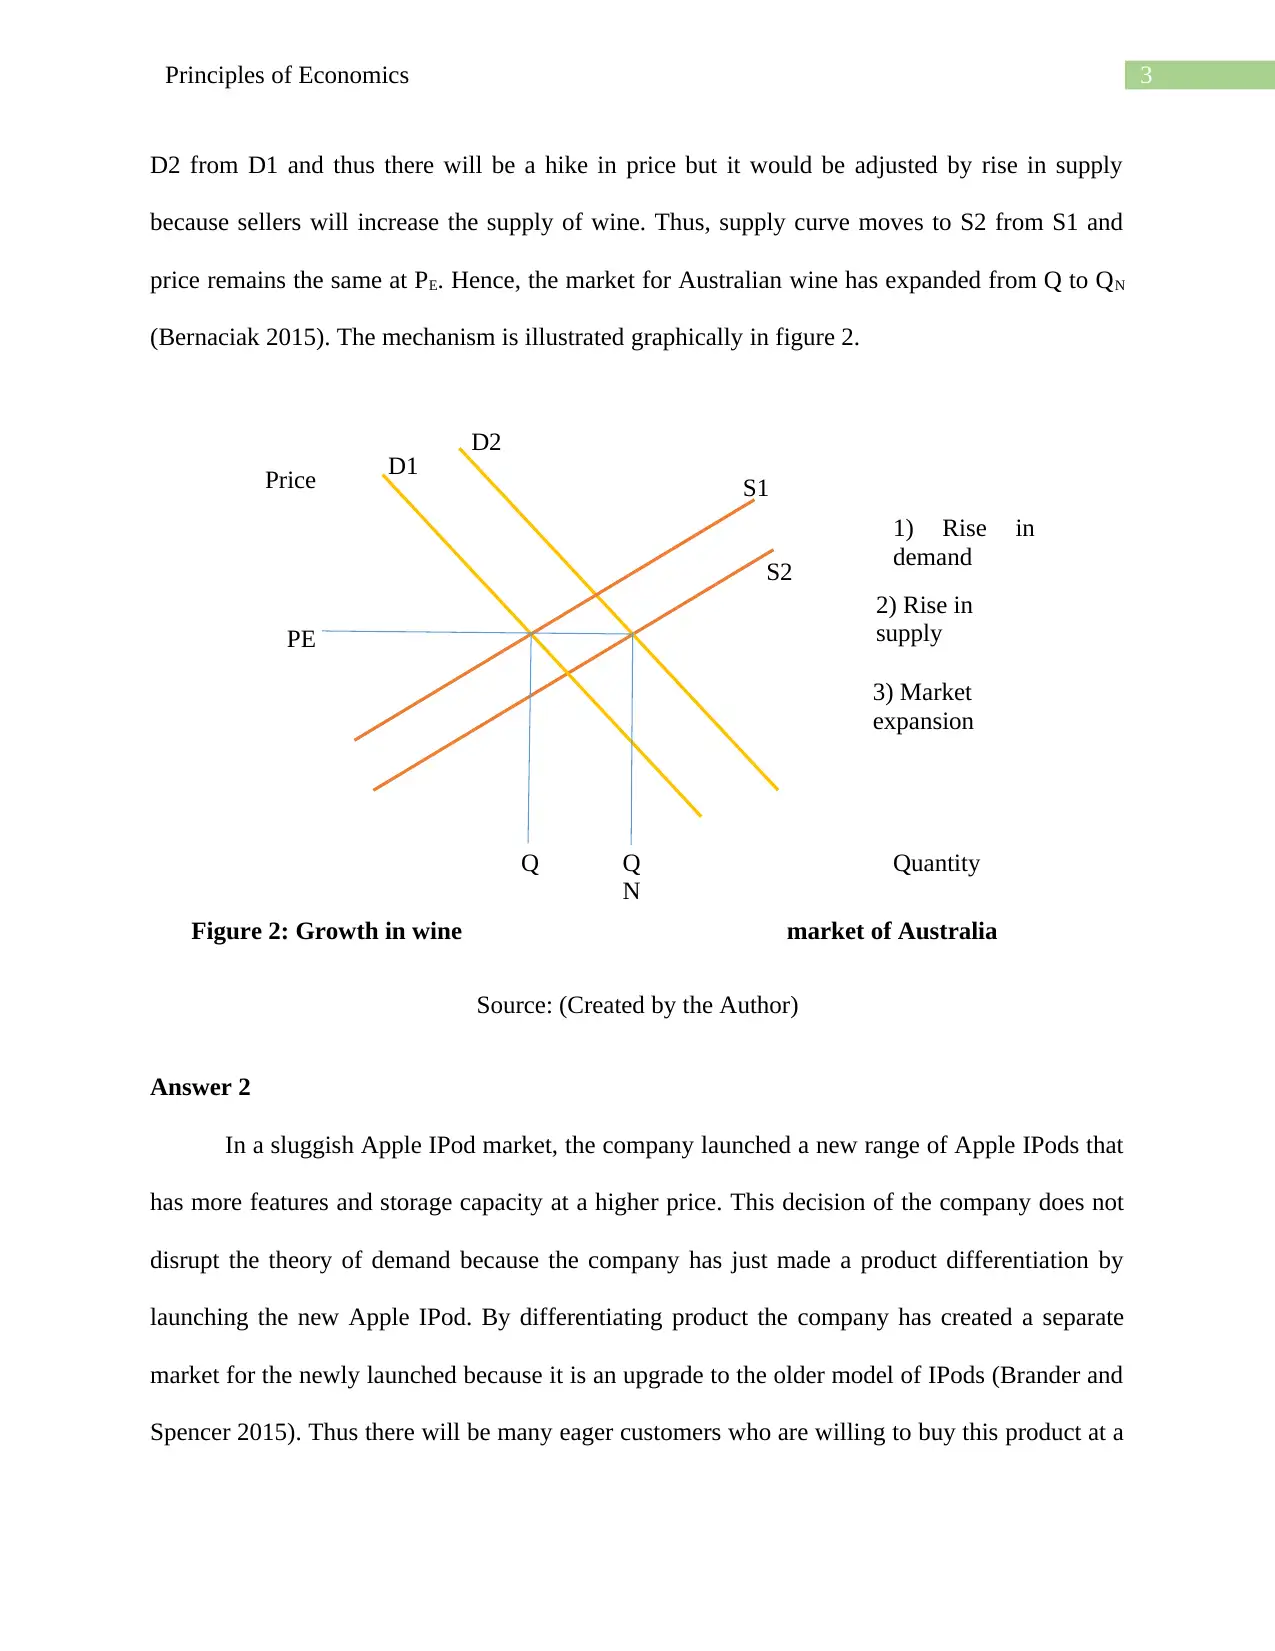
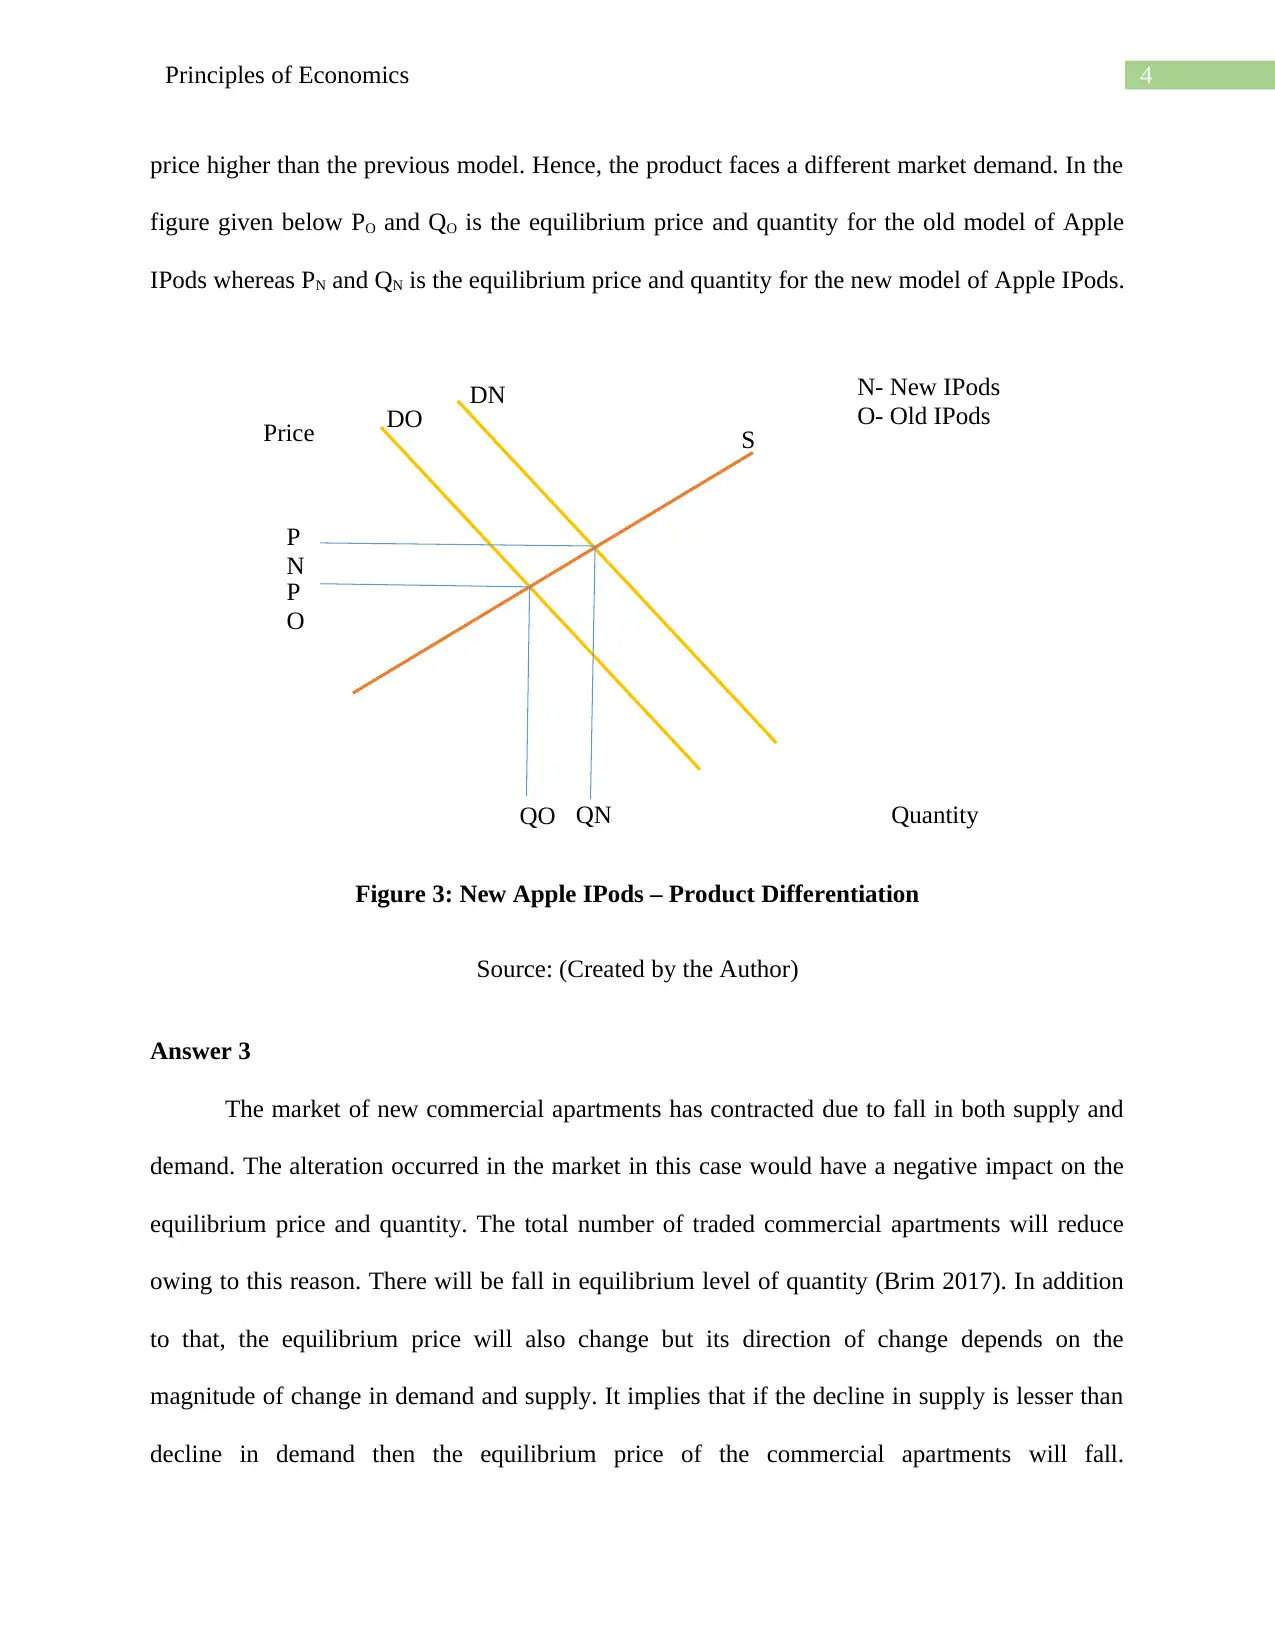
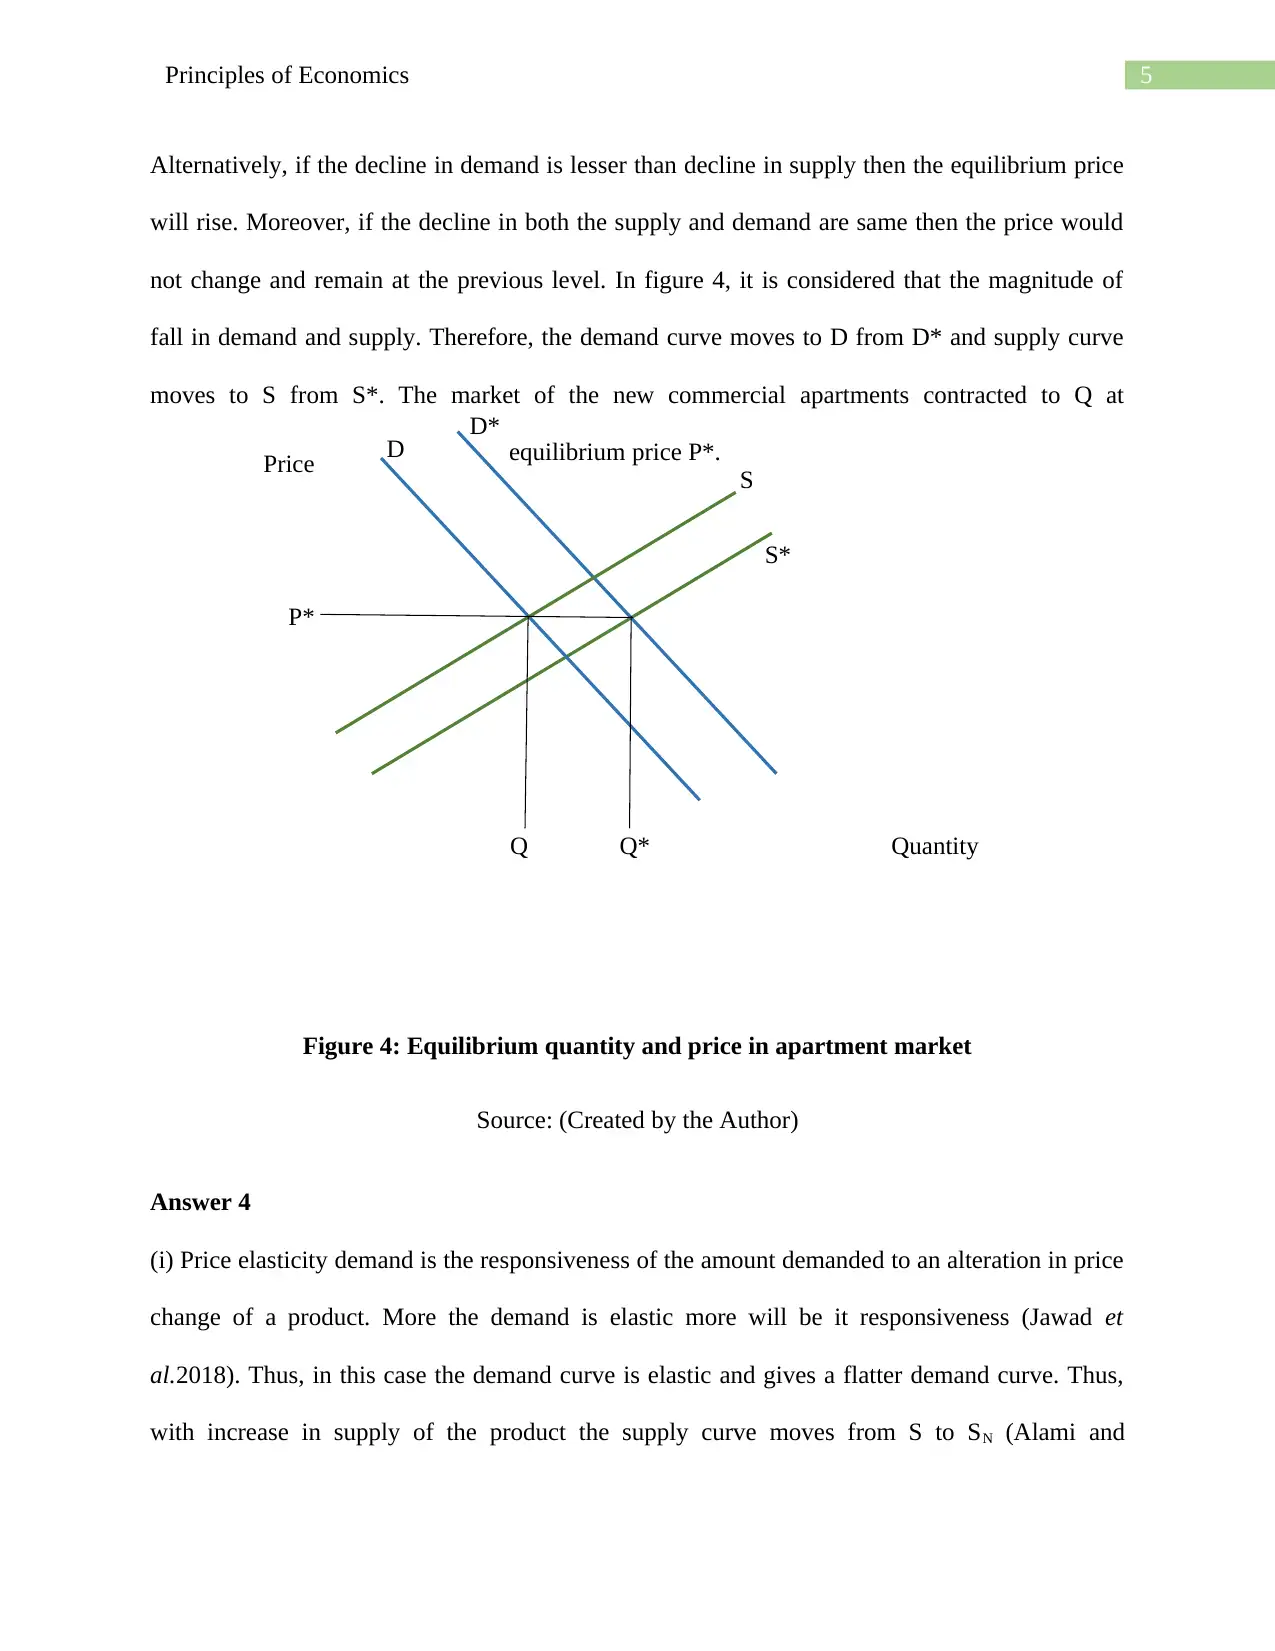
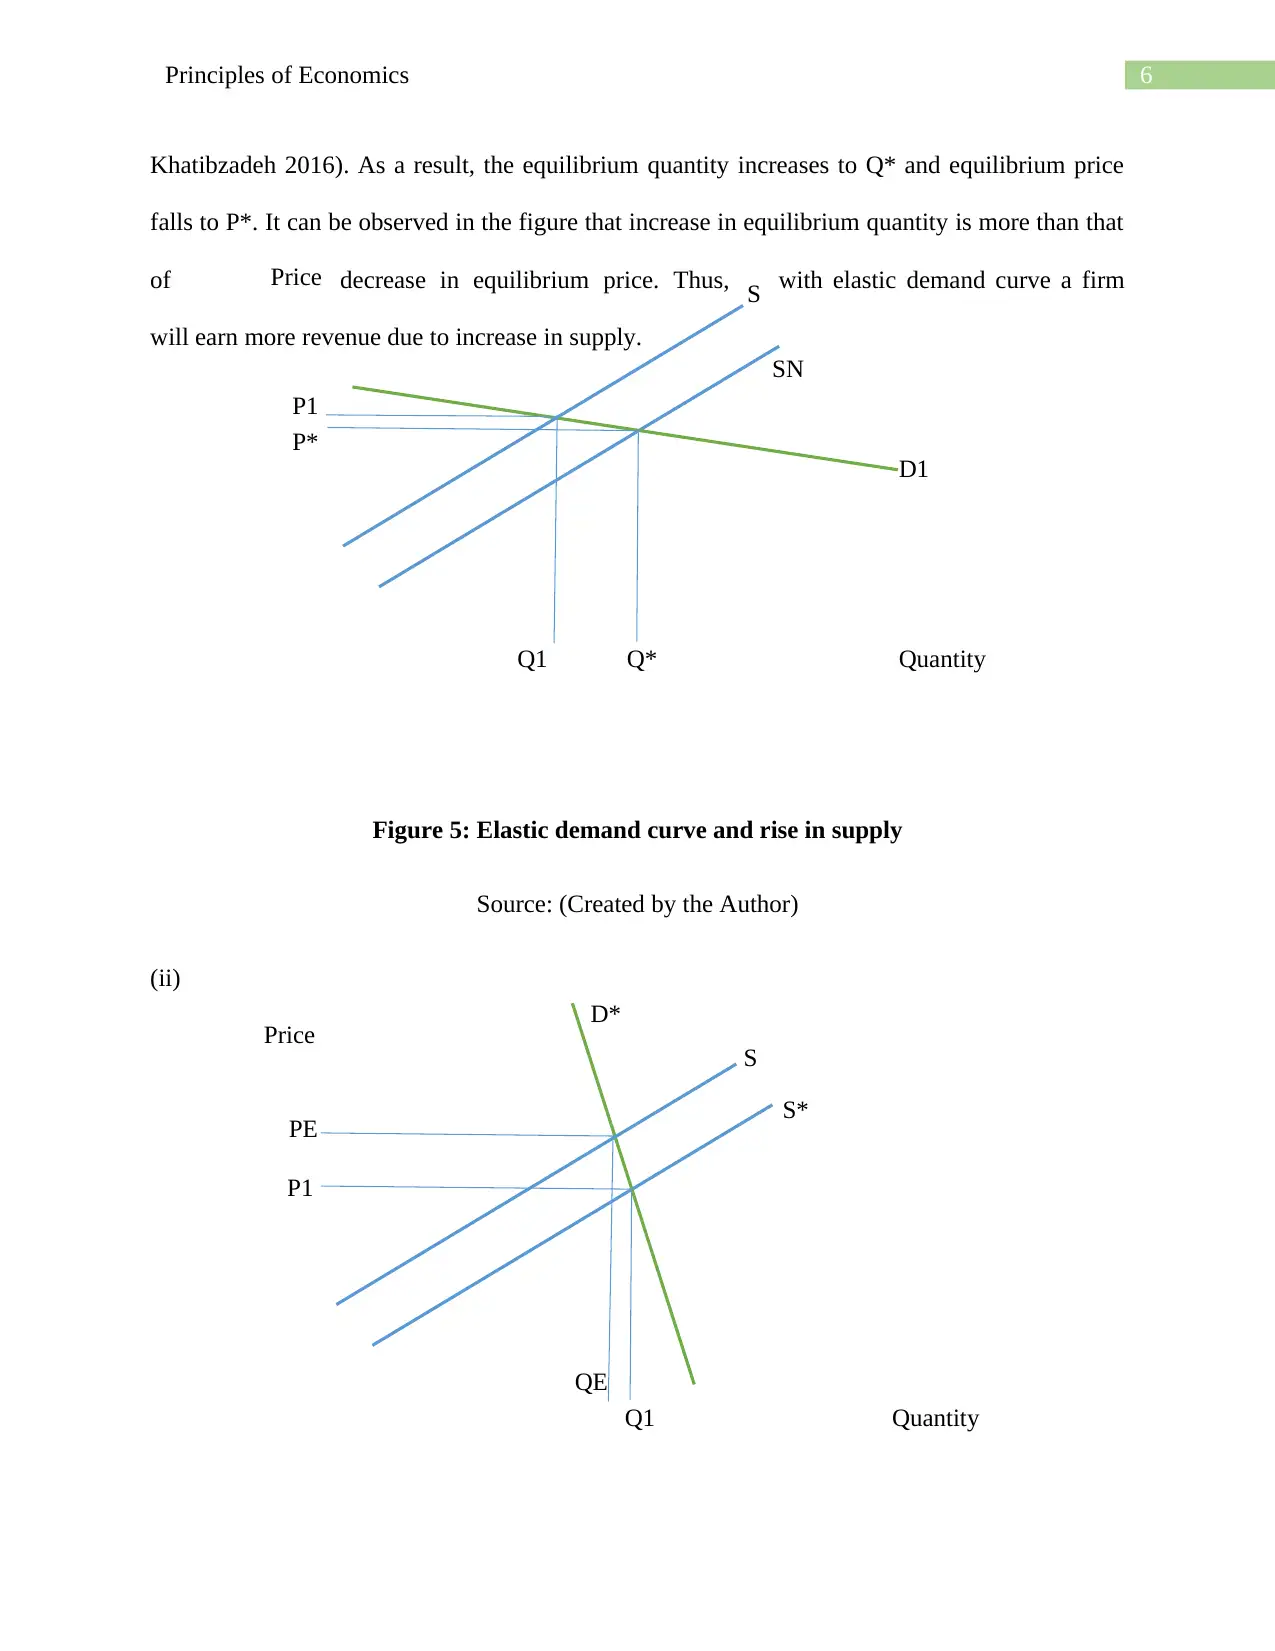
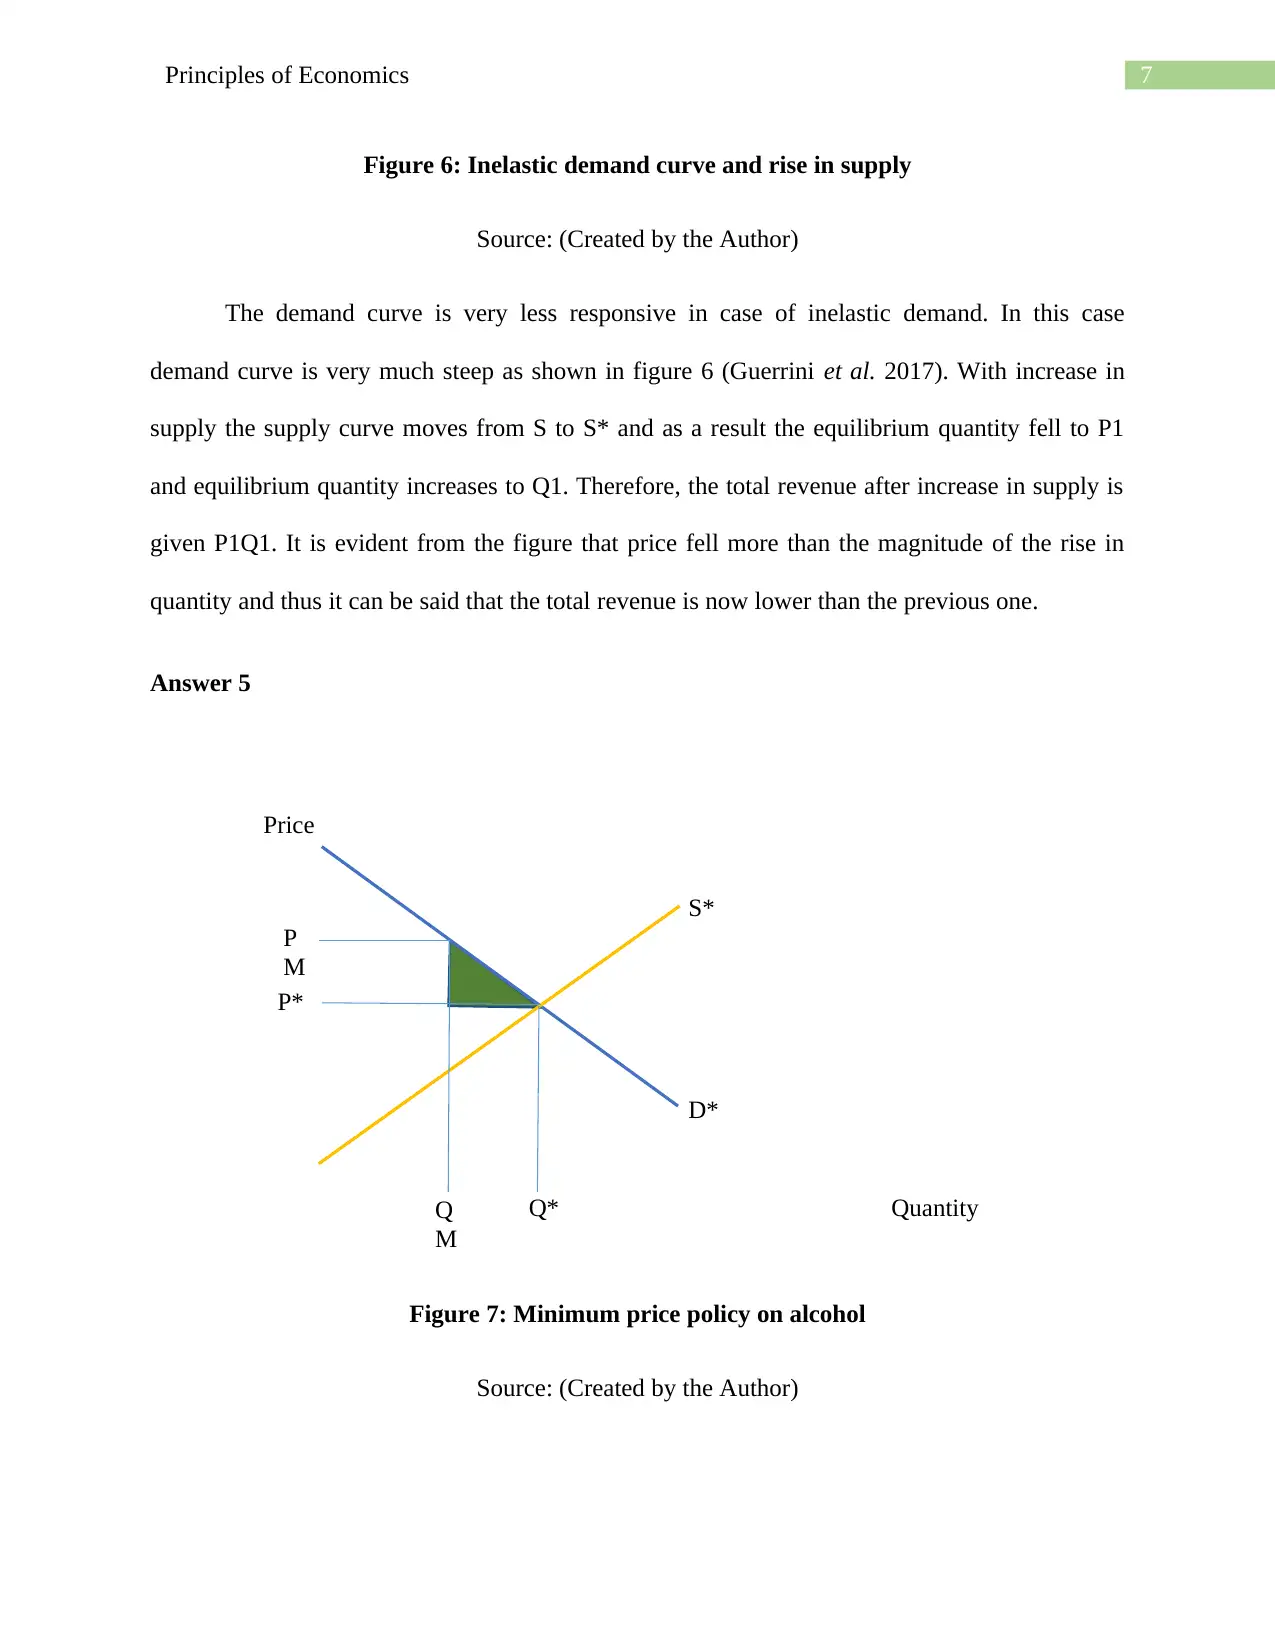
This economics assignment explores key principles through market analysis. It examines how a poor wine-grape harvest in France impacts both the French and Australian wine markets, analyzing shifts in supply and demand, and the adjustment to new equilibrium. The assignment then considers product differentiation using the example of Apple iPods and how it aligns with the law of demand, using graphical analysis. It further investigates the impact of simultaneous decreases in supply and demand for commercial apartments, including the effects on equilibrium price and quantity under varying magnitudes of change. The assignment concludes by analyzing the effects of elastic and inelastic demand curves on revenue when supply increases, and finally, it explores the implications of a minimum price policy on alcohol consumption, along with potential solutions.

Running head: Principles of Economics
Principles of Economics
Name of the Student
Name of the University
Student ID
Principles of Economics
Name of the Student
Name of the University
Student ID
Secure Best Marks with AI Grader
Need help grading? Try our AI Grader for instant feedback on your assignments.

1Principles of Economics
Table of Contents
Answer 1..........................................................................................................................................2
Answer 2..........................................................................................................................................3
Answer 3..........................................................................................................................................4
Answer 4..........................................................................................................................................5
Answer 5..........................................................................................................................................7
References........................................................................................................................................9

2Principles of Economics
S*
S
QQ*
P*
Quantity
Price D* D
2) Decline in
demand
1) Decline in
supply
3) Contraction
in market
Answer 1
(a) Poor production in wine-grape in France affected the production of French wine. Decreased
availability of wine-grape reduced the production of French wine and thereby supply fell. As a
result, the supply curve shifted to S* from S and price will rise. However, the rise in price is
adjusted and fell to previous level due to decline in demand from D to D*. Therefore, the
equilibrium price remain unchanged and the quantity fell to Q* from Q (Friedman 2017). Thus,
the French wine market contracted after fall in production of wine grape. In figure 1 the above
illustration is given in graphical form.
Figure 1: French wine market contraction
Source: (Created by the Author)
(b) Owing to reduction in supply of French wine the market supply has also decreased. Thus, the
consumers will move to some different kind of wine which is Australian wine in this case.
Therefore, the demand for Australian wine increases. Consequently, the demand curve moves to

3Principles of Economics
S1
S2
Q
N
Q
PE
Quantity
Price D1 D2
1) Rise in
demand
2) Rise in
supply
3) Market
expansion
D2 from D1 and thus there will be a hike in price but it would be adjusted by rise in supply
because sellers will increase the supply of wine. Thus, supply curve moves to S2 from S1 and
price remains the same at PE. Hence, the market for Australian wine has expanded from Q to QN
(Bernaciak 2015). The mechanism is illustrated graphically in figure 2.
Figure 2: Growth in wine market of Australia
Source: (Created by the Author)
Answer 2
In a sluggish Apple IPod market, the company launched a new range of Apple IPods that
has more features and storage capacity at a higher price. This decision of the company does not
disrupt the theory of demand because the company has just made a product differentiation by
launching the new Apple IPod. By differentiating product the company has created a separate
market for the newly launched because it is an upgrade to the older model of IPods (Brander and
Spencer 2015). Thus there will be many eager customers who are willing to buy this product at a
Secure Best Marks with AI Grader
Need help grading? Try our AI Grader for instant feedback on your assignments.

4Principles of Economics
S
P
N
QNQO
P
O
Quantity
Price DO DN N- New IPods
O- Old IPods
price higher than the previous model. Hence, the product faces a different market demand. In the
figure given below PO and QO is the equilibrium price and quantity for the old model of Apple
IPods whereas PN and QN is the equilibrium price and quantity for the new model of Apple IPods.
Figure 3: New Apple IPods – Product Differentiation
Source: (Created by the Author)
Answer 3
The market of new commercial apartments has contracted due to fall in both supply and
demand. The alteration occurred in the market in this case would have a negative impact on the
equilibrium price and quantity. The total number of traded commercial apartments will reduce
owing to this reason. There will be fall in equilibrium level of quantity (Brim 2017). In addition
to that, the equilibrium price will also change but its direction of change depends on the
magnitude of change in demand and supply. It implies that if the decline in supply is lesser than
decline in demand then the equilibrium price of the commercial apartments will fall.

5Principles of Economics
S
S*
Q*Q
P*
Quantity
Price D D*
Alternatively, if the decline in demand is lesser than decline in supply then the equilibrium price
will rise. Moreover, if the decline in both the supply and demand are same then the price would
not change and remain at the previous level. In figure 4, it is considered that the magnitude of
fall in demand and supply. Therefore, the demand curve moves to D from D* and supply curve
moves to S from S*. The market of the new commercial apartments contracted to Q at
equilibrium price P*.
Figure 4: Equilibrium quantity and price in apartment market
Source: (Created by the Author)
Answer 4
(i) Price elasticity demand is the responsiveness of the amount demanded to an alteration in price
change of a product. More the demand is elastic more will be it responsiveness (Jawad et
al.2018). Thus, in this case the demand curve is elastic and gives a flatter demand curve. Thus,
with increase in supply of the product the supply curve moves from S to SN (Alami and

6Principles of Economics
D1
S
SN
Q*Q1
P*
Quantity
Price
P1
D*
S*
S
QE
Q1
PE
Quantity
Price
P1
Khatibzadeh 2016). As a result, the equilibrium quantity increases to Q* and equilibrium price
falls to P*. It can be observed in the figure that increase in equilibrium quantity is more than that
of decrease in equilibrium price. Thus, with elastic demand curve a firm
will earn more revenue due to increase in supply.
Figure 5: Elastic demand curve and rise in supply
Source: (Created by the Author)
(ii)
Paraphrase This Document
Need a fresh take? Get an instant paraphrase of this document with our AI Paraphraser

7Principles of Economics
D*
S*
Q
M
Q*
P
M
Quantity
Price
P*
Figure 6: Inelastic demand curve and rise in supply
Source: (Created by the Author)
The demand curve is very less responsive in case of inelastic demand. In this case
demand curve is very much steep as shown in figure 6 (Guerrini et al. 2017). With increase in
supply the supply curve moves from S to S* and as a result the equilibrium quantity fell to P1
and equilibrium quantity increases to Q1. Therefore, the total revenue after increase in supply is
given P1Q1. It is evident from the figure that price fell more than the magnitude of the rise in
quantity and thus it can be said that the total revenue is now lower than the previous one.
Answer 5
Figure 7: Minimum price policy on alcohol
Source: (Created by the Author)

8Principles of Economics
A minimum price policy is implemented on the alcohol consumption by the government
of Western Australia (Meier et al. 2016). It is done to reduce the incidence of alcohol induced
illness. Minimum price is shown as PM in figure 7. The implementation of this policy allowed
alcohol sellers to charge high price than free market prices and thereby earn super normal profit.
In addition to that the policy gave rise to loss in social welfare in the form of dead weight loss,
which is given as green triangle in the figure. Poor people who consumes alcohol has to bear the
extra price and thus get exploited. Therefore, to solve the adversities caused due to imposition of
minimum price on alcohol the government can impose tax on revenue such that government will
earn the revenue and use it for welfare purpose. Another suitable measure is to limit the daily
sales of alcohol because it would directly reduce the consumption of alcohol.

9Principles of Economics
References
Aalami, H.A. and Khatibzadeh, A., 2016. Regulation of market clearing price based on nonlinear
models of demand bidding and emergency demand response programs. International
Transactions on Electrical Energy Systems, 26(11), pp.2463-2478.
Bernaciak, M. ed., 2015. Market expansion and social dumping in Europe. Routledge.
Brander, J.A. and Spencer, B.J., 2015. Intra-industry trade with Bertrand and Cournot oligopoly:
The role of endogenous horizontal product differentiation. Research in Economics, 69(2),
pp.157-165.
Brim, O., 2017. The economic theory of representative government. Routledge.
Friedman, M., 2017. Price theory. Routledge.
Guerrini, G., Graziotti, F., Penna, A. and Magenes, G., 2017. Improved evaluation of inelastic
displacement demands for short‐period masonry structures. Earthquake Engineering &
Structural Dynamics, 46(9), pp.1411-1430.
Jawad, M., Lee, J.T., Glantz, S. and Millett, C., 2018. Price elasticity of demand of non-cigarette
tobacco products: a systematic review and meta-analysis. Tobacco control, 27(6), pp.689-695.
Meier, P.S., Holmes, J., Angus, C., Ally, A.K., Meng, Y. and Brennan, A., 2016. Estimated
effects of different alcohol taxation and price policies on health inequalities: a mathematical
modelling study. PLoS medicine, 13(2), p.e1001963.
1 out of 10
Related Documents

Your All-in-One AI-Powered Toolkit for Academic Success.
+13062052269
info@desklib.com
Available 24*7 on WhatsApp / Email
Unlock your academic potential
© 2024 | Zucol Services PVT LTD | All rights reserved.