ECON 2 Assignment: Price Elasticity, Market, Growth, and Inflation
VerifiedAdded on 2022/10/01
|11
|2948
|22
Homework Assignment
AI Summary
This economics assignment delves into four core economic theories: price elasticity of demand, market theory, economic growth, and the theory of inflation. The assignment begins by exploring price elasticity, advising a pharmaceutical company on pricing strategies for a new drug based on different elasticity values (1.4, 0.6, and 1). The second question analyzes market theory, focusing on the dynamics of perfect competition, the impact of economic profits and losses, and the effects of new firms entering or exiting the market in the long run. The third question examines economic growth theory, highlighting the roles of physical capital, human capital, and technology in driving economic growth, with a focus on GDP per capita and comparisons between high, middle, and low-income countries. Finally, the assignment concludes with an analysis of inflation, explaining how the consumer price index (CPI) is calculated and used to measure inflation rates over time. The student provides detailed explanations, supporting evidence, and diagrams to illustrate these economic concepts.

ECONOMICS 1
Principles of Economics
Student Name
Course
Professor’s Name
University
City
Date
Principles of Economics
Student Name
Course
Professor’s Name
University
City
Date
Paraphrase This Document
Need a fresh take? Get an instant paraphrase of this document with our AI Paraphraser
ECONOMICS 2
Question 1: Price Elasticity of Demand theory
The question relates to the price elasticity of demand theory. The coefficient of price
elasticity of demand is computed by dividing the percentage change in the quantity of goods that
the consumers demand by the respective proportion variations in their prices as given in the
following formulae (Jawad et al. 2018 p. 693). Price elasticity of demand (Ped) = (Q2-Q1/ P2-
P1)*100. Provided that variations in the prices and quantity are inversely related, the minus sign
is ignored. Therefore, a point of interest is the co-efficient of elasticity of demand as opposed to
the resultant sign.
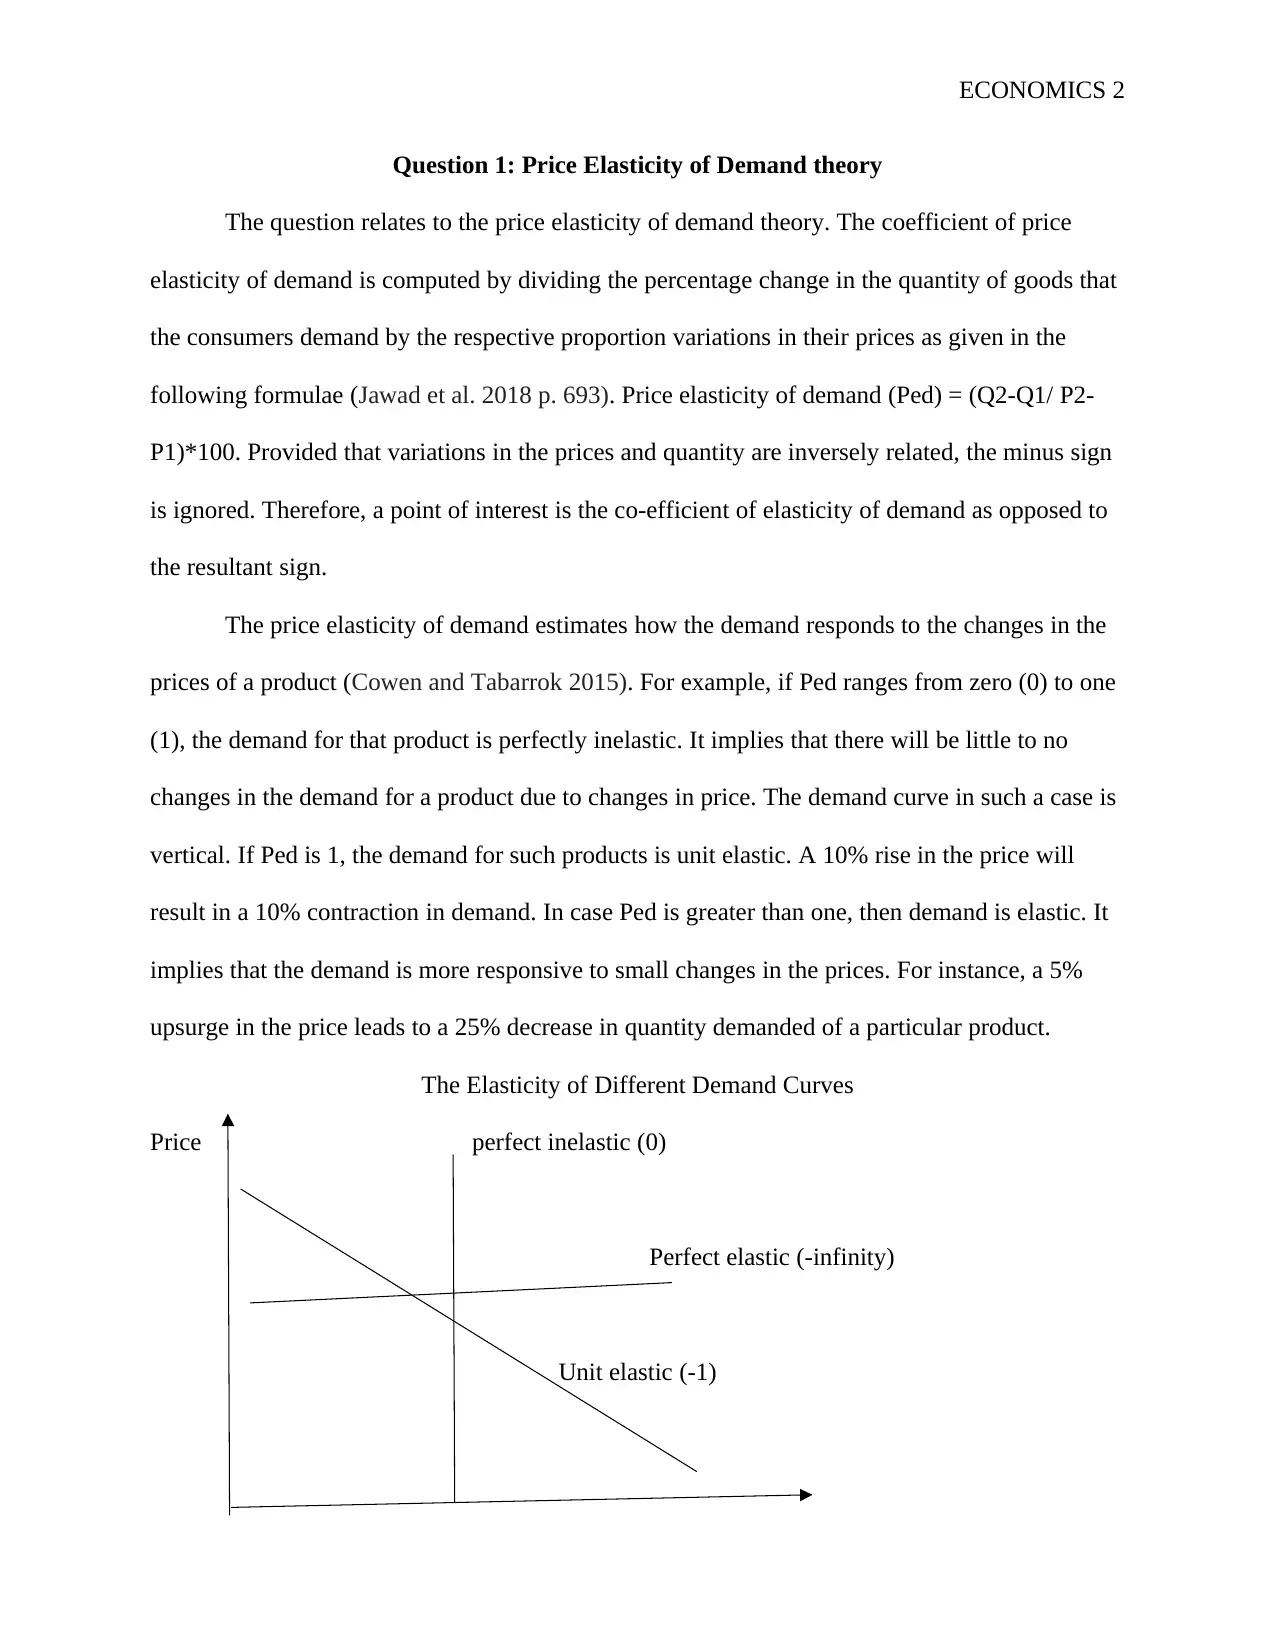
The price elasticity of demand estimates how the demand responds to the changes in the
prices of a product (Cowen and Tabarrok 2015). For example, if Ped ranges from zero (0) to one
(1), the demand for that product is perfectly inelastic. It implies that there will be little to no
changes in the demand for a product due to changes in price. The demand curve in such a case is
vertical. If Ped is 1, the demand for such products is unit elastic. A 10% rise in the price will
result in a 10% contraction in demand. In case Ped is greater than one, then demand is elastic. It
implies that the demand is more responsive to small changes in the prices. For instance, a 5%
upsurge in the price leads to a 25% decrease in quantity demanded of a particular product.
The Elasticity of Different Demand Curves
Price perfect inelastic (0)
Perfect elastic (-infinity)
Unit elastic (-1)
Question 1: Price Elasticity of Demand theory
The question relates to the price elasticity of demand theory. The coefficient of price
elasticity of demand is computed by dividing the percentage change in the quantity of goods that
the consumers demand by the respective proportion variations in their prices as given in the
following formulae (Jawad et al. 2018 p. 693). Price elasticity of demand (Ped) = (Q2-Q1/ P2-
P1)*100. Provided that variations in the prices and quantity are inversely related, the minus sign
is ignored. Therefore, a point of interest is the co-efficient of elasticity of demand as opposed to
the resultant sign.
The price elasticity of demand estimates how the demand responds to the changes in the
prices of a product (Cowen and Tabarrok 2015). For example, if Ped ranges from zero (0) to one
(1), the demand for that product is perfectly inelastic. It implies that there will be little to no
changes in the demand for a product due to changes in price. The demand curve in such a case is
vertical. If Ped is 1, the demand for such products is unit elastic. A 10% rise in the price will
result in a 10% contraction in demand. In case Ped is greater than one, then demand is elastic. It
implies that the demand is more responsive to small changes in the prices. For instance, a 5%
upsurge in the price leads to a 25% decrease in quantity demanded of a particular product.
The Elasticity of Different Demand Curves
Price perfect inelastic (0)
Perfect elastic (-infinity)
Unit elastic (-1)
ECONOMICS 3
Quantity
The price elasticity of demand theory helps to answer the question as it explains how the
changes in the various prices of the product will affect the quantity of the product that the
consumer will demand. Therefore, based on this knowledge, the producer will know when to
increase, decrease or hold the price of various goods and services at market constant. For
example, when the Ped is at 1.4 at the present price, I will advise the company to lower the price
as the demand is elastic. Small changes in the prices of this product will result in a large
contraction in the level of demand. Therefore, lowering the cost of selling that good will result in
an upsurge of the levels of demand by consumers. When the elasticity is at 0.6, I will advise the
company to raise the price of the product as there will be no changes in the quantity demanded
due to changes in prices. For example, important medical products, where people are willing to
pay any amount as long as they can afford to acquire services. When the elasticity of demand is
at 1, it implies that this is unit elasticity and the proportion changes in the level of demand are
identical to the proportion change in price. Therefore, in this case, I will advise the company to
keep the price the same as the variations in the levels of prices will have a net-zero effect on the
quantity demanded.
Question 2: Market Theory
In the perfect competition market, the firms are entitled to economic profit or economic
losses. The two have major influence regarding the perfectly competitive market. The presence
of the economic profits will attract new firms to the industry over time. As a result of more new
players joining the industry, the supply curve shifts to the right, prices reduce, and also profits
reduce (Azevedo and Gottlieb 2017 p. 72). New players will continue to join the industry
provided that there is still profit being made. In case some companies in the industry incur losses,
⊘ This is a preview!⊘
Do you want full access?
Subscribe today to unlock all pages.
Trusted by 1+ million students worldwide
ECONOMICS 4
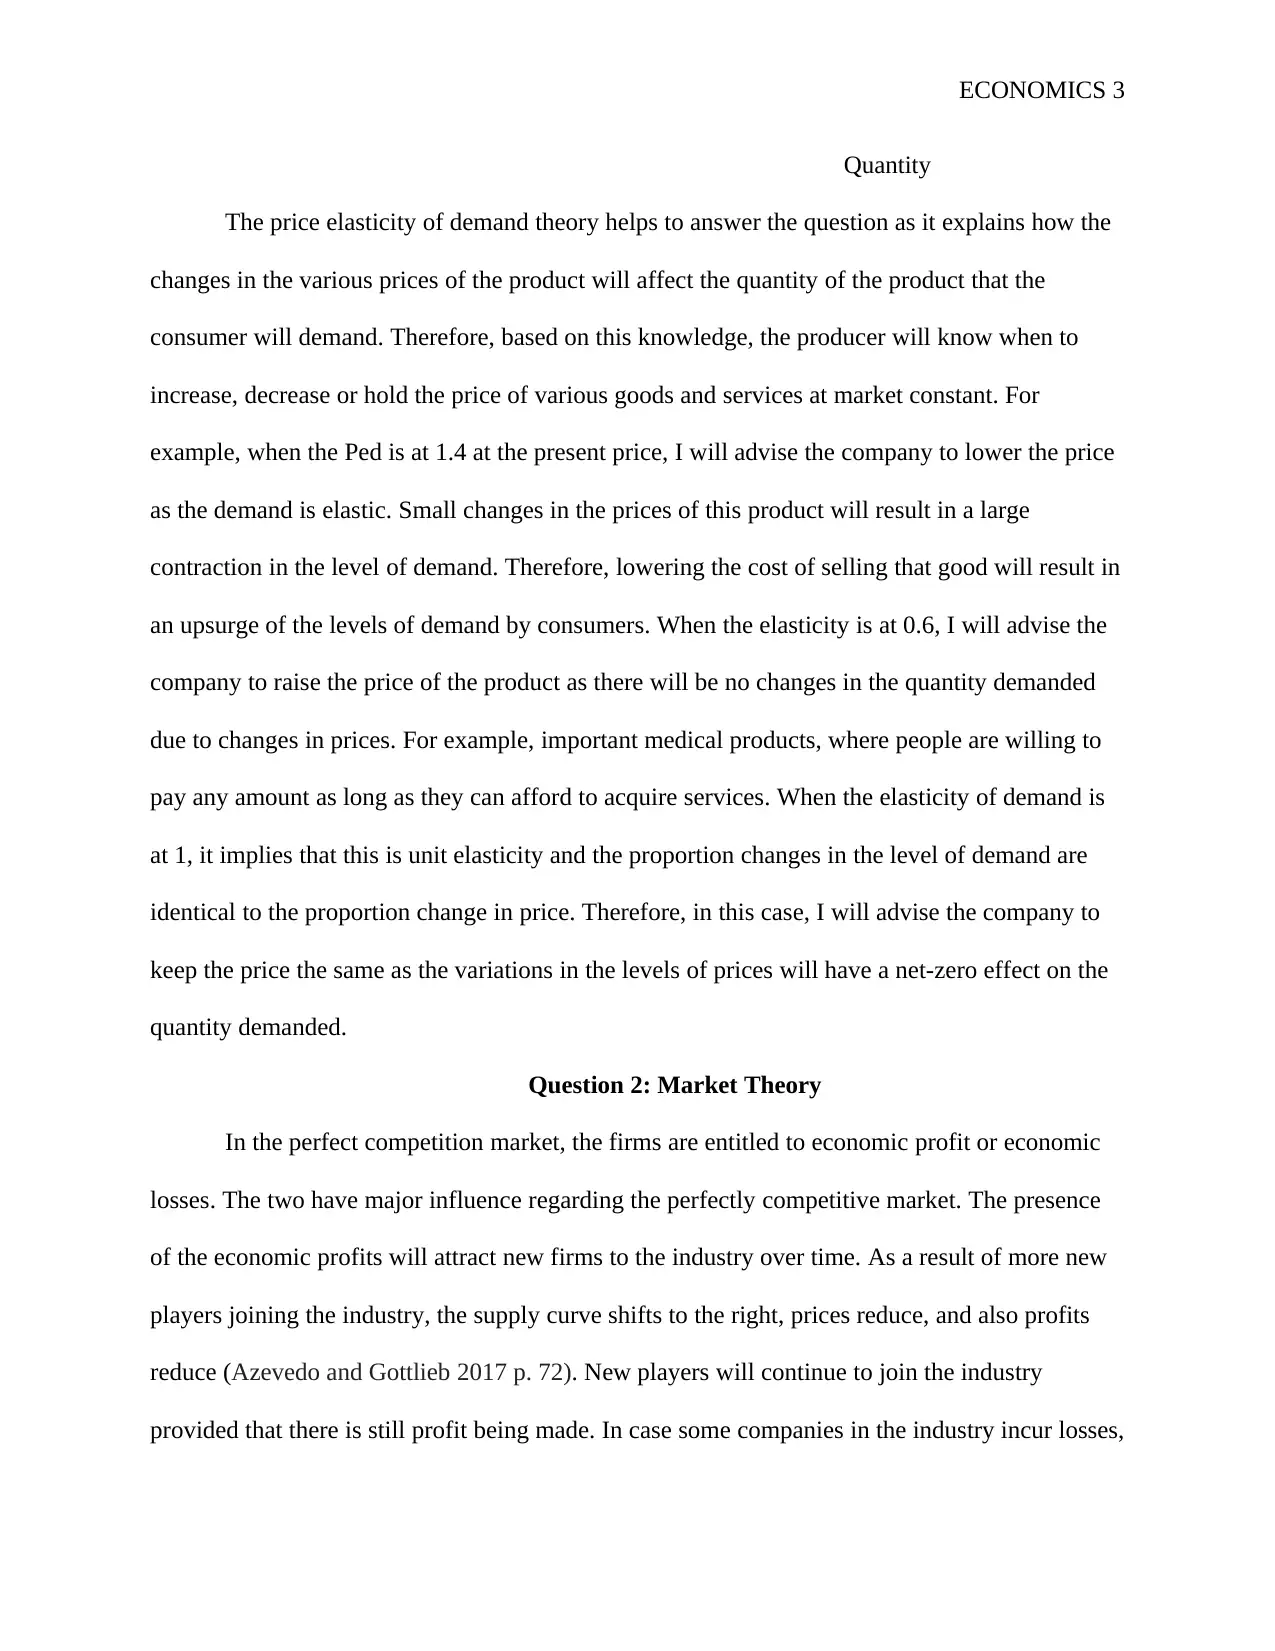
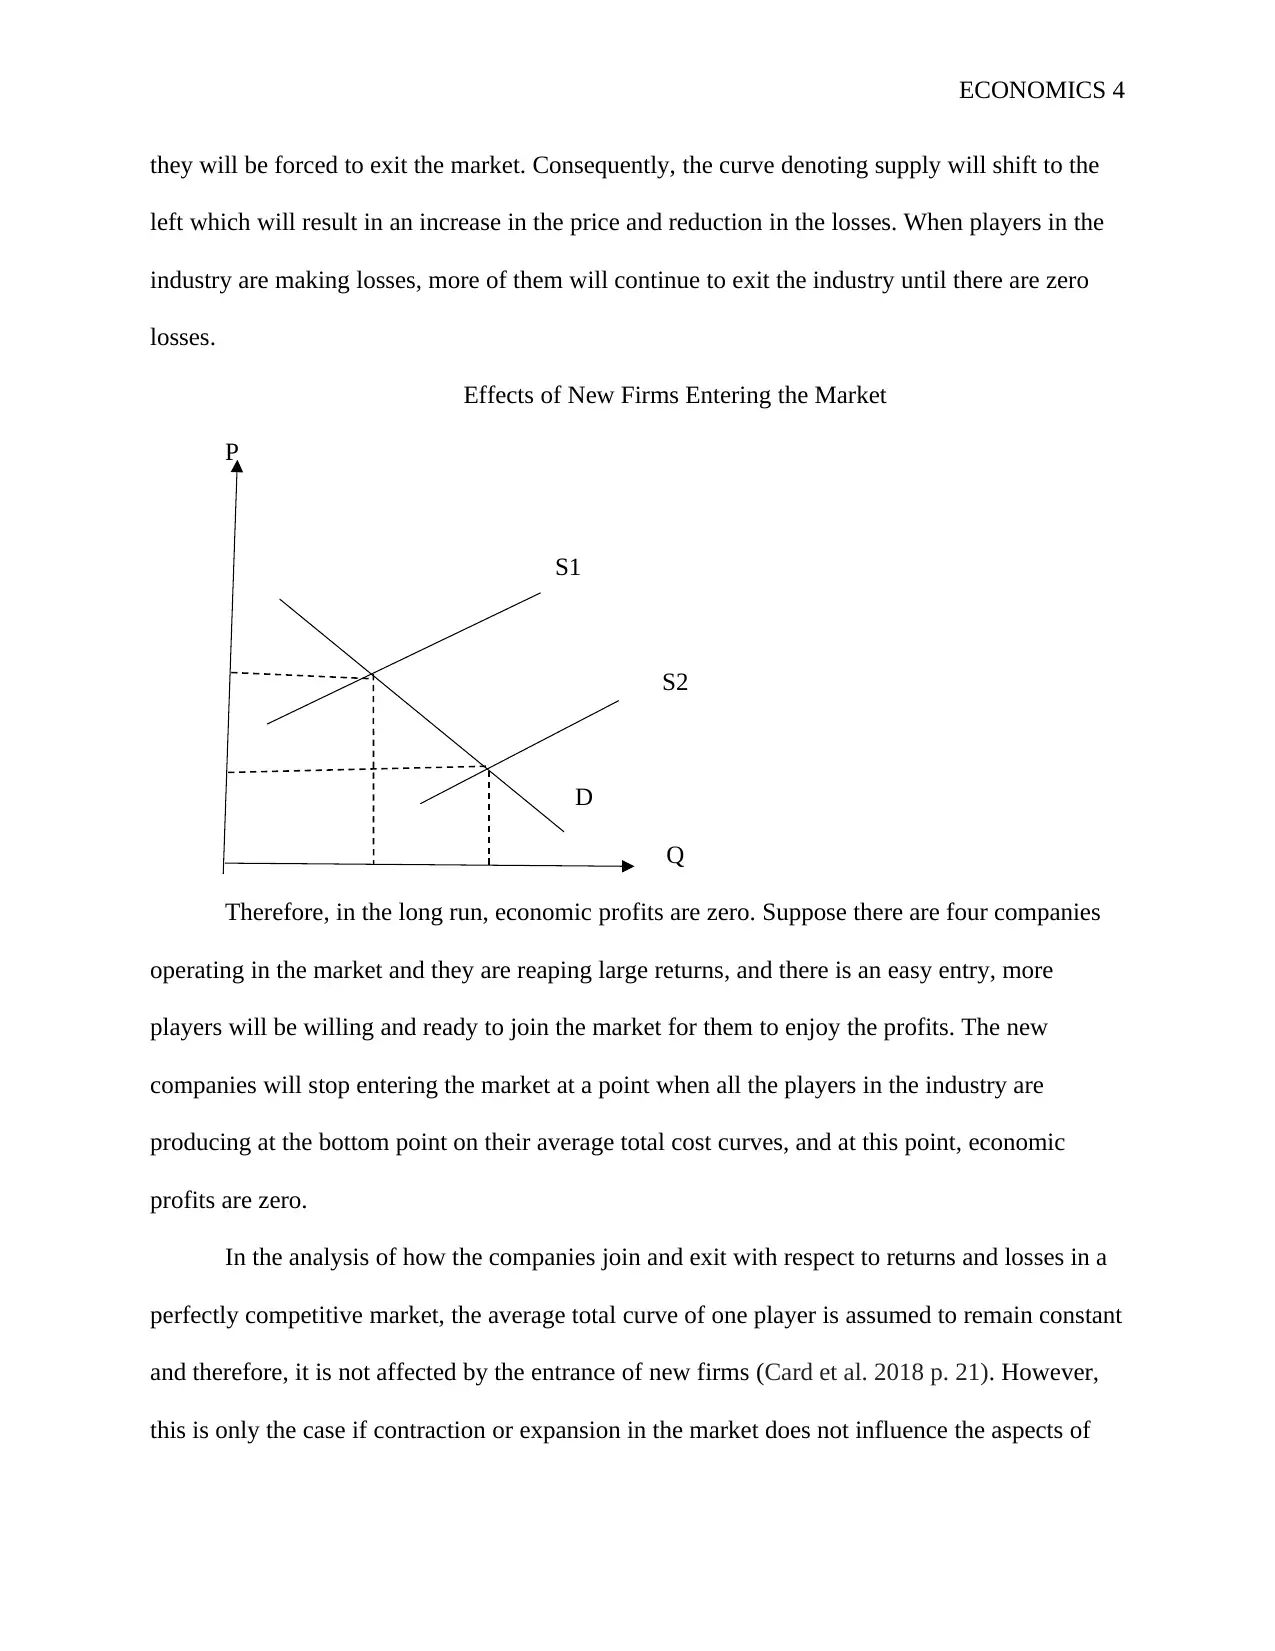
they will be forced to exit the market. Consequently, the curve denoting supply will shift to the
left which will result in an increase in the price and reduction in the losses. When players in the
industry are making losses, more of them will continue to exit the industry until there are zero
losses.
Effects of New Firms Entering the Market
P
S1
S2
D
Q
Therefore, in the long run, economic profits are zero. Suppose there are four companies
operating in the market and they are reaping large returns, and there is an easy entry, more
players will be willing and ready to join the market for them to enjoy the profits. The new
companies will stop entering the market at a point when all the players in the industry are
producing at the bottom point on their average total cost curves, and at this point, economic
profits are zero.
In the analysis of how the companies join and exit with respect to returns and losses in a
perfectly competitive market, the average total curve of one player is assumed to remain constant
and therefore, it is not affected by the entrance of new firms (Card et al. 2018 p. 21). However,
this is only the case if contraction or expansion in the market does not influence the aspects of
Paraphrase This Document
Need a fresh take? Get an instant paraphrase of this document with our AI Paraphraser
ECONOMICS 5
manufacture which are employed by the companies in the market. For example, in the case
where the entrance of the new firms does not influence the charges of the prices of the inputs
which are used in manufacturing, then the industry is a constant cost industry. But, there are
some cases where the entry of the new firms impacts the prices of the costs of production.
The introduction of the new firms to the industry will result in an increase in the
competition for the inputs of production which are utilized in the industry. Then, if the industry
is significantly using those factors of production, the rise in demand could push up the price in
the market for all the firms in the industry. If this is the case, any firm that enters the industry
will improve the average costs and it will also reduce the pressure on the price. The firms will
operate at the lowest level of the average total curve and the economic profit will be zero.
However, the cost curve is higher compared before the entry of the new firms. For instance, an
increase in the number of vehicles push the prices higher and attracts new firms to the industry,
the industry will demand more workers. The demand for more workers is likely to push the
wages up.
The knowledge of economic returns and losses, in the long run, helps to answer this
question as firms which operate in perfect competition are subject to losses and profit depending
on the action of other firms. For example, when the firms that are already in the industry are
making economic profits, and there are fewer barriers to entry, the higher earnings will lure more
players to enter the market. As a result, there will be an expansion in the demand leading to an
outward shift, and the prices will fall and the quantity demanded will increase. Due to the fall in
the profits, it will reach a point where the firms in the industry are not able to cover the total
average costs, and at these points, they will suffer economic losses. Some of the firms will be
ECONOMICS 6
forced to exit the market. Finally, the equilibrium will be restored in the market, and the firms
will operate at a point where economic profits are equal to zero in the long run.
Question 3: Economic Growth Theory
The aggregate production function comprises physical capital, human capital, and
technology which are responsible for the economic growth of a country. The category of
physical capital comprises of the equipment and plants which are used by firms in production.
There are two ways in which physical capital influences the productivity of the country.
Productivity will increase if there is an increase in the quantity and quality of physical capital.
Another component of the aggregate production function is the human capital (Zhang 2018).
Similar to physical capital, investment in human capital pays off in the long run.
The third component constitutes the technology that a country uses in production.
Technology, in this case, refers to the combination of the factors of production. Therefore, the
differences in these main elements which form the production function explain why growth in
various countries is different from others and takes place at different rates. The economic growth
is interested in the living standards per person; hence, there is a need to concentrate on GDP per
capita. With GDP per capita, it is possible to compare growth in countries with small populations
such as Uruguay and those with large populations such as China.
GDP per capita is computed by taking the domestic country’s economic output divided
by its people. Hence, the GDP per capita can be expressed as (GDP = human capital per person +
physical capital per person+ technology per person). GDP per capita = GDP/ population. The
output production function indicates what goes into the production of the output for the entire
economy. Therefore, the rate of growth of GDP is closely associated with the rate of a country’s
GDP per capita. For instance, if the fraction of the people that are employed increases, GDP per
⊘ This is a preview!⊘
Do you want full access?
Subscribe today to unlock all pages.
Trusted by 1+ million students worldwide
ECONOMICS 7
capita will increase. In the long run, the only way the GDP per capita can continually increase is
when the productivity of the average worker increases or if there is an increase in capital.
The theory of economic growth in different countries based on the factors that constitute
the aggregate production function helps to address this question as it explains why there are
variations in growth in different countries (Van den Berg 2016). For example, in Australia which
is a high-income economy, for it to experience growth in GDP per capita, it should consider an
increase in the productivity per average worker. One way to enhance productivity per worker is
through an increase in the levels of education. It is assumed that Australia is a developed
country, has both high levels of technology and physical capital. Therefore, it has to boost how
human and physical capital are combined to attain more growth in GDP per capita.
For India, which is a middle-income country, it has to increase its physical and human
capital. For any country to experience growth in the long run, the average productivity per
person has to increase. The person’s productivity increase if there is an investment in human
capital through means such as advancement in knowledge and skills. Additionally, India also
needs to increase its physical capital. The combination of physical and human capital in the right
ratio will result in an increase in the per capita GDP. Lastly, for a low-income country such as
Afghanistan, to attain growth in GDP per capita, it has to increase all three factors of production.
It has to invest more in physical capital, technology, and human capital. Thereafter, workers with
necessary knowledge and skills will use the available physical capital appropriately and
productivity per worker will increase; hence an overall growth in GDP per capita.
Question 4: Theory of Inflation
The inflation rate is the rate at which the prices of products and services increase over
time (Alexander, Jyoti and Magueijo 2016). The rate of inflation is measured based on a base
Paraphrase This Document
Need a fresh take? Get an instant paraphrase of this document with our AI Paraphraser
ECONOMICS 8
year. The base year is the first year in a sequence of years in an economic period. To
accommodate the changes in the prices of the products and services, there is a frequent update of
base years periodically. Even though any year can serve as a base year, the analyst selects the
latest years. For instance, to find the rate of inflation between 2014 and 2019, 2014 is used as a
base year.
The consumer price index (CPI) is computed by dividing the budget of the bundles of
goods in the present period by the value of the bundles of goods in the base period and multiply
by 100. CPI = (cost of the bundles of goods in the present year/ costs of the bundles of goods in
the base period. For example, if the price in periods one and two are $20 and $40 respectively,
then CPI = (40/20)*100=200. It implies that in this current year, the price is twenty percent more
than in the base year. The main use of CPI is to estimate inflation. The inflation rate is computed
as inflation = (CPI in the present year –CPI in the previous year/ CPI previous year)*100.
However, in the computation of inflation, errors can occur which leads to underestimation or
overestimation of the inflation. The three reasons why inflation may be overestimated are quality
change bias, new goods bias, and substitution bias. Hence, based on the information regarding
the computation of inflation, it helps to address the effects of changes in a base year on the
substitution bias and new good bias.
In the estimation of inflation, new goods bias occurs when goods that were not available
during the base year are more expensive than the products they replace. Then the price is biased
as it will be higher. Another form of bias is the substitution bias. The consumers can substitute
one good for another due to variations in the prices (Fox and Syed 2016 p. 401). For instance,
when the prices of mangoes rise, but the price of apples remains constant, then consumers can
opt to consumer apples instead of mangoes. The substitution bias is experienced if the price
ECONOMICS 9
index does not consider the changing in price if the basket of the products that are being
compared is the same. In the substitution bias, the basket of the products that are used in the
computation of CPI is fixed and does not consider the consumer’s substitution effect from the
items whose price increase.
The overestimation or underestimation has a negative influence on the overall economy
(Wolters and Tillmann 2015 p.1671). Therefore, the government statisticians always strive to
reduce it. To reduce the bias in the estimation of inflation, the consumer expenditures are
conducted more frequently and update information on CPI basket in a short period such as two
years. Therefore, if the government statisticians who have been computing the rate of inflation
have been updating the basket of goods after every ten years, then they change to five years, this
will reduce both the substitution bias and new goods bias. Hence, the accuracy rate in the
estimation of inflation will increase.
⊘ This is a preview!⊘
Do you want full access?
Subscribe today to unlock all pages.
Trusted by 1+ million students worldwide
ECONOMICS 10
List of References
Alexander, S., Jyoti, D. and Magueijo, J., 2016. Inflation and the Measurement Problem. arXiv
preprint arXiv:1602.01216.
Azevedo, E.M. and Gottlieb, D., 2017. Perfect competition in markets with adverse
selection. Econometrica, 85(1), pp.67-105.
Card, D., Cardoso, A.R., Heining, J. and Kline, P., 2018. Firms and labor market inequality:
Evidence and some theory. Journal of Labor Economics, 36(S1), pp.S13-S70.
Cowen, T. and Tabarrok, A., 2015. Modern principles of economics. Macmillan International
Higher Education.
Fox, K.J. and Syed, I.A., 2016. Price discounts and the measurement of inflation. Journal of
econometrics, 191(2), pp.398-406.
Jawad, M., Lee, J.T., Glantz, S. and Millett, C., 2018. Price elasticity of demand of non-cigarette
tobacco products: a systematic review and meta-analysis. Tobacco control, 27(6), pp.689-
695.
Van den Berg, H., 2016. Economic growth and development. World Scientific Publishing
Company.
Wolters, M.H. and Tillmann, P., 2015. The changing dynamics of US inflation persistence: A
quantile regression approach. Studies in Nonlinear Dynamics & Econometrics, 19(2),
pp.161-182.
Zhang, W.B., 2018. Economic Growth Theory: Capital, Knowledge, and Economic Structures.
Routledge.
Paraphrase This Document
Need a fresh take? Get an instant paraphrase of this document with our AI Paraphraser

ECONOMICS 11
1 out of 11
Related Documents


Your All-in-One AI-Powered Toolkit for Academic Success.
+13062052269
info@desklib.com
Available 24*7 on WhatsApp / Email
![[object Object]](/_next/static/media/star-bottom.7253800d.svg)
Unlock your academic potential
Copyright © 2020–2026 A2Z Services. All Rights Reserved. Developed and managed by ZUCOL.