Economics Assignment - Elasticity, Production, and Inflation Analysis
VerifiedAdded on 2022/08/26
|8
|1767
|23
Homework Assignment
AI Summary
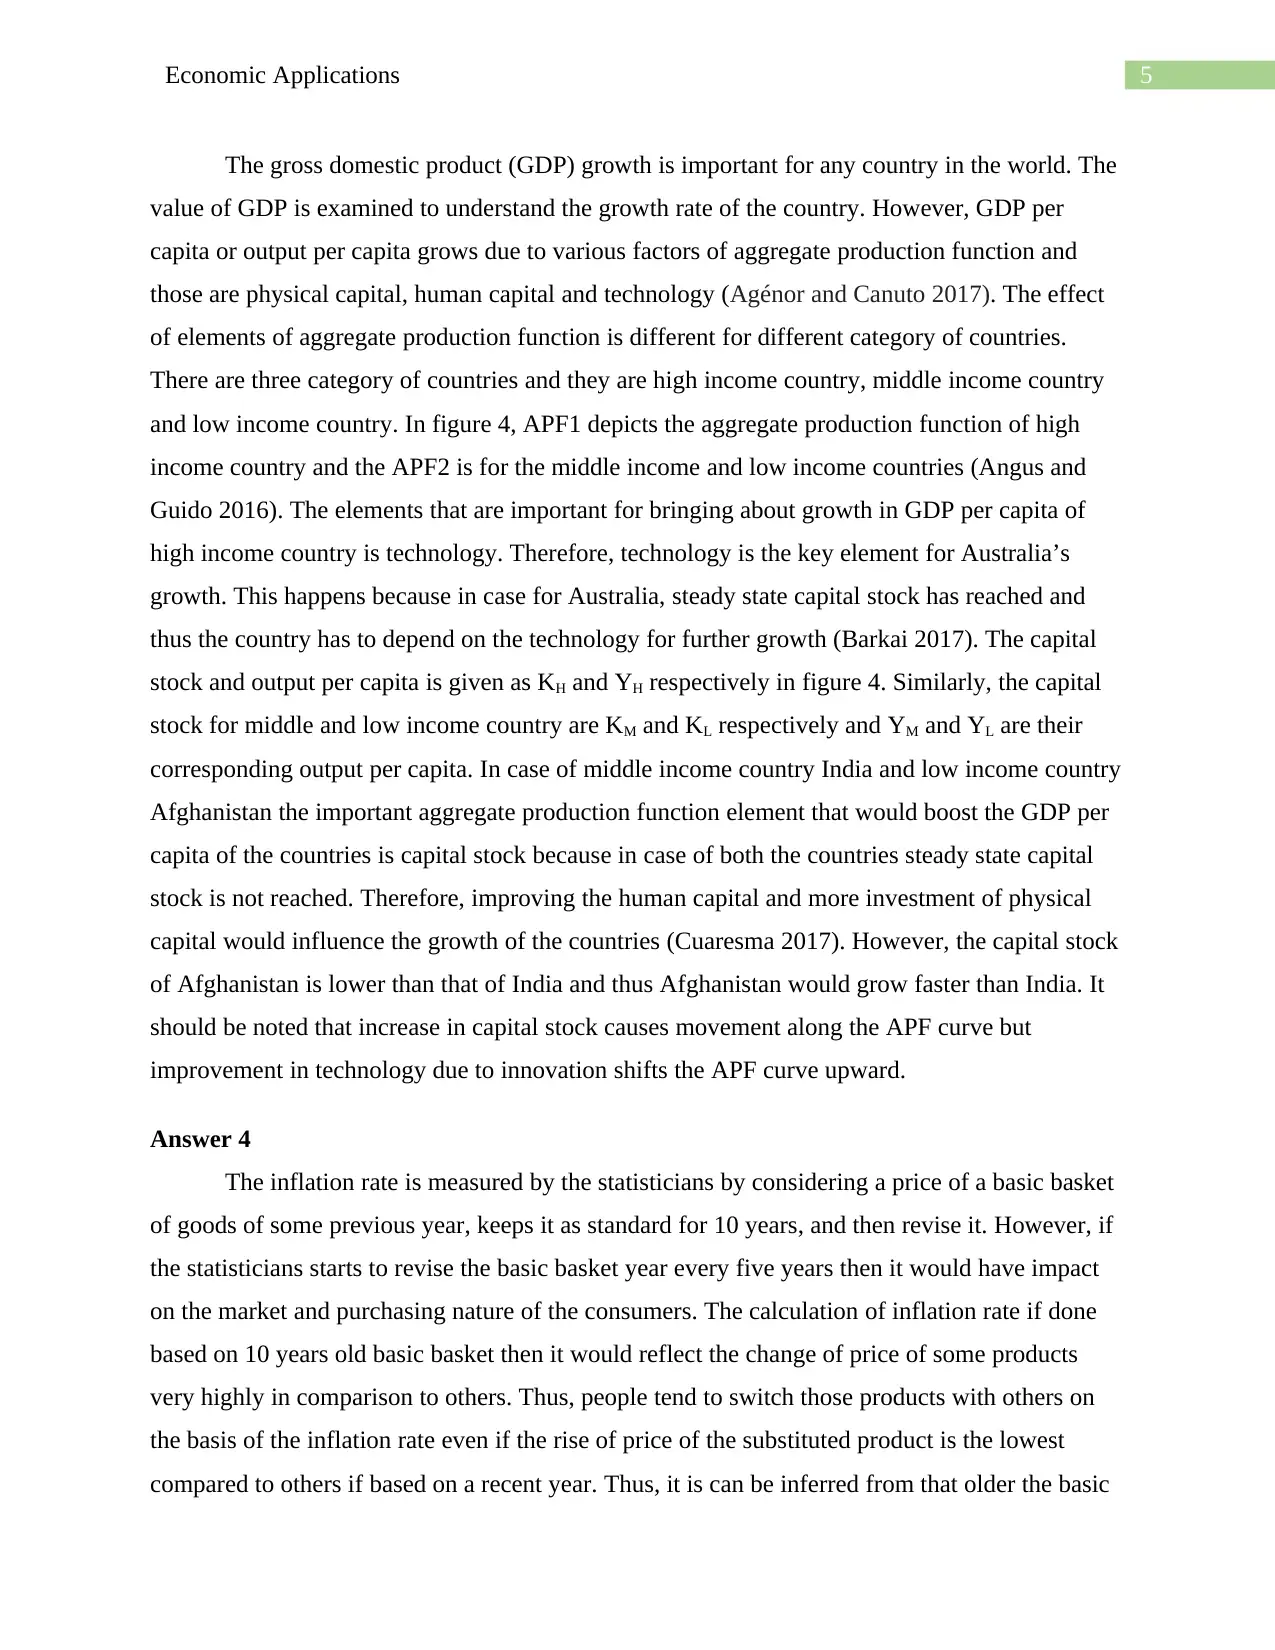
This economics assignment delves into several key economic concepts. The first question explores the concept of price elasticity of demand and its impact on a pharmaceutical company's revenue, analyzing scenarios with elastic, inelastic, and unitary elasticities. The second question examines eco...
Read More
Contribute Materials
Your contribution can guide someone’s learning journey. Share your
documents today.

Running head: Economic Applications
Economic Applications
Name of the Student
Name of the University
Student ID
Economic Applications
Name of the Student
Name of the University
Student ID
Secure Best Marks with AI Grader
Need help grading? Try our AI Grader for instant feedback on your assignments.

1Economic Applications
Table of Contents
Answer 1..........................................................................................................................................2
Answer 2..........................................................................................................................................3
Answer 3..........................................................................................................................................4
Answer 4..........................................................................................................................................5
Reference.........................................................................................................................................7

2Economic Applications
Answer 1
The new drug of the company helps bald men to grow hair. The company wants to earn
maximum possible profit by selling this drug. However, to maximize profit the company has to
increase sales at a high price. In contrary, as per the theory of demand, with rise in price of a
product the demand of the good decreases. Thus, increasing price of the product may lead to fall
in demand. However, it should be noted that after rise in price and fall in demand whether the
total revenue has increased or not. This happens when percentage fall in demand is lower than
the percentage rise in price. Under this situation, the firm may increase its price as it is getting
higher revenue. This phenomenon or the relation between price and demand is explained by the
concept of price elasticity of demand (Jawad et al. 2018). It is given that price elasticity of
demand is 1.4 at the current price that means the demand of the product is price elastic. The
meaning of the said value is if the price of the product increases by 10% then its demand will fall
by 14%. Therefore, the total revenue earned from selling the product falls with rise in price. It
can be clearly visible in figure 1 that percentage change in price is smaller than the percentage
change in quantity demanded. In addition to that, rectangle given by P1Q1 is smaller than the
rectangle given by PQ. Therefore, the revenue of the company reduces with increase in price.
Hence, the company is suggested not to increase the price of the product.
Figure 1: Demand is elastic
Source: (Created by the Author)
On the other hand, if the elasticity of the product is 0.6 it means that the demand is
inelastic. Therefore, with 10% increases in price the demand of the product will fall by 6%.

3Economic Applications
Hence, increase in price of the product will increase the revenue of the company and thereby
profit. In figure 2, it can be seen that revenue P2Q2 is greater than P1Q1.
Figure 2: Demand inelastic
Source: (Created by the Author)
Moreover, with elasticity value of 1 there will be no impact no change in total revenue of
the company because for 10% increase in price the percentage change in demand will be the
same.
Answer 2
Figure 3: Long run average cost
Source: (Created by the Author)
In automobile industry the economies of scale is very high that means if a firm keep on
producing more good, then the cost per unit or average cost of the good decreases. In figure 3,
Secure Best Marks with AI Grader
Need help grading? Try our AI Grader for instant feedback on your assignments.

4Economic Applications
LRAC is the long run average cost curve (Ertan, Lewellen and Thomas 2018). It is U-shaped
because in the initial phase that is in the downward sloping part of the curve there is economies
of scale that is average cost (AC) falls as output increases. However, economies of scale is until
output Q1 and any output beyond that would increase the AC. Therefore, it is evident that, the
four auto automobile manufacturing firms are operating at the downward sloping part of the
LRAC. It is given that the demand for automobile is 2.5 times the amount produced at the
minimum point of LRAC (Ghani 2019). Therefore, out of four firms in the industry only two
firms will be able to reach the minimum point of LRAC. Due to this, one firm will make an exit
from the industry due to losses or lack of competiveness against the other firms. However, the
third firm which could not achieve the minimum point of LRAC would continue to operate but
will definitely struggle. However, the two healthy firms would not try to push out the third firm
off the industry because they cannot meet the excess demand generated since they will not
produce beyond output Q1 (Cornet 2020). Therefore, there will be three firms operating in the
automobile manufacturing industry in the long run. Hence, there will be two dominating firm and
one struggling firm in the industry.
Answer 3
Figure 4: Aggregate
production function of High, Medium and Low income countries
Source: (Created by the Author)

5Economic Applications
The gross domestic product (GDP) growth is important for any country in the world. The
value of GDP is examined to understand the growth rate of the country. However, GDP per
capita or output per capita grows due to various factors of aggregate production function and
those are physical capital, human capital and technology (Agénor and Canuto 2017). The effect
of elements of aggregate production function is different for different category of countries.
There are three category of countries and they are high income country, middle income country
and low income country. In figure 4, APF1 depicts the aggregate production function of high
income country and the APF2 is for the middle income and low income countries (Angus and
Guido 2016). The elements that are important for bringing about growth in GDP per capita of
high income country is technology. Therefore, technology is the key element for Australia’s
growth. This happens because in case for Australia, steady state capital stock has reached and
thus the country has to depend on the technology for further growth (Barkai 2017). The capital
stock and output per capita is given as KH and YH respectively in figure 4. Similarly, the capital
stock for middle and low income country are KM and KL respectively and YM and YL are their
corresponding output per capita. In case of middle income country India and low income country
Afghanistan the important aggregate production function element that would boost the GDP per
capita of the countries is capital stock because in case of both the countries steady state capital
stock is not reached. Therefore, improving the human capital and more investment of physical
capital would influence the growth of the countries (Cuaresma 2017). However, the capital stock
of Afghanistan is lower than that of India and thus Afghanistan would grow faster than India. It
should be noted that increase in capital stock causes movement along the APF curve but
improvement in technology due to innovation shifts the APF curve upward.
Answer 4
The inflation rate is measured by the statisticians by considering a price of a basic basket
of goods of some previous year, keeps it as standard for 10 years, and then revise it. However, if
the statisticians starts to revise the basic basket year every five years then it would have impact
on the market and purchasing nature of the consumers. The calculation of inflation rate if done
based on 10 years old basic basket then it would reflect the change of price of some products
very highly in comparison to others. Thus, people tend to switch those products with others on
the basis of the inflation rate even if the rise of price of the substituted product is the lowest
compared to others if based on a recent year. Thus, it is can be inferred from that older the basic

6Economic Applications
basket used for calculation of inflation rate more will be the substitution bias (Lyons and Lauring
2017). Hence, it can be said that the recent decision of statisticians regarding revising the basic
basket every 5 years would lower the substitution bias. On the other hand, in general in the
calculation of inflation rate quality improvement of any product is not considered. Thus, it is
hard to understand if the rise in price of product is due its improvement in quality or not. Hence,
the change in basic basket year does not incorporate the quality factor in the calculation of
inflation rate and thus revising basic basket every 5 years instead of 10 years would not impact
the quality bias (Blaum, Lelarge and Peters 2019). Therefore, there will be no change in quality
bias.
Paraphrase This Document
Need a fresh take? Get an instant paraphrase of this document with our AI Paraphraser

7Economic Applications
Reference
Agénor, P.R. and Canuto, O., 2017. Access to finance, product innovation and middle-income
traps. Research in Economics, 71(2), pp.337-355.
Angus, C. and Guido, C., 2016. Growth Accounting and Endogenous Technical Change.
Barkai, S., 2017. Declining labor and capital shares. University of Chicago.
Blaum, J., Lelarge, C. and Peters, M., 2019. Firm size, quality bias and import demand. Journal
of International Economics, 120, pp.59-83.
Cornet, B., 2020. The Gale–Nikaido–Debreu lemma with discontinuous excess
demand. Economic Theory Bulletin, pp.1-12.
Cuaresma, J.C., 2017. Income projections for climate change research: A framework based on
human capital dynamics. Global Environmental Change, 42, pp.226-236.
Ertan, A., Lewellen, S. and Thomas, J.K., 2018. The Long-Run Average Cost Puzzle. Available
at SSRN 3178202.
Ghani, H., 2019. Different Variations of Cost Curve in Economics. International Journal of Tax
Economics and Management.
Jawad, M., Lee, J.T., Glantz, S. and Millett, C., 2018. Price elasticity of demand of non-cigarette
tobacco products: a systematic review and meta-analysis. Tobacco control, 27(6), pp.689-695.
Lyons, D.M. and Lauring, A.S., 2017. Evidence for the selective basis of transition-to-
transversion substitution bias in two RNA viruses. Molecular biology and evolution, 34(12),
pp.3205-3215.
1 out of 8
Related Documents

Your All-in-One AI-Powered Toolkit for Academic Success.
+13062052269
info@desklib.com
Available 24*7 on WhatsApp / Email
Unlock your academic potential
© 2024 | Zucol Services PVT LTD | All rights reserved.