Economics Assignment 2: Analysis of England and Wales Economy
VerifiedAdded on 2023/04/22
|14
|3490
|274
Report
AI Summary
This economics assignment analyzes key economic indicators and trends in England and Wales, focusing on factors influencing the housing market and construction industry. The report examines birth and death statistics, homeownership rates, and the aging population's impact, presenting data visualizations to illustrate these trends. It delves into the GDP growth rate, median household income, and interest rates to assess the economic environment. The report also discusses the impact of immigration on the economy and the demand for housing. Finally, it explores funding options for local construction projects, comparing debt and equity financing methods, and concluding that bank loans are the most suitable form of debt financing for local construction projects. The assignment uses various sources to support its analysis and provide a comprehensive overview of the economic landscape of England and Wales.

1
ECONOMICS ASSIGNMENT
ECONOMICS ASSIGNMENT
Paraphrase This Document
Need a fresh take? Get an instant paraphrase of this document with our AI Paraphraser

2
Contents
Section 1.....................................................................................................................................3
Section 2.....................................................................................................................................6
Section 3...................................................................................................................................10
Section 4...................................................................................................................................11
Reference..................................................................................................................................12
3
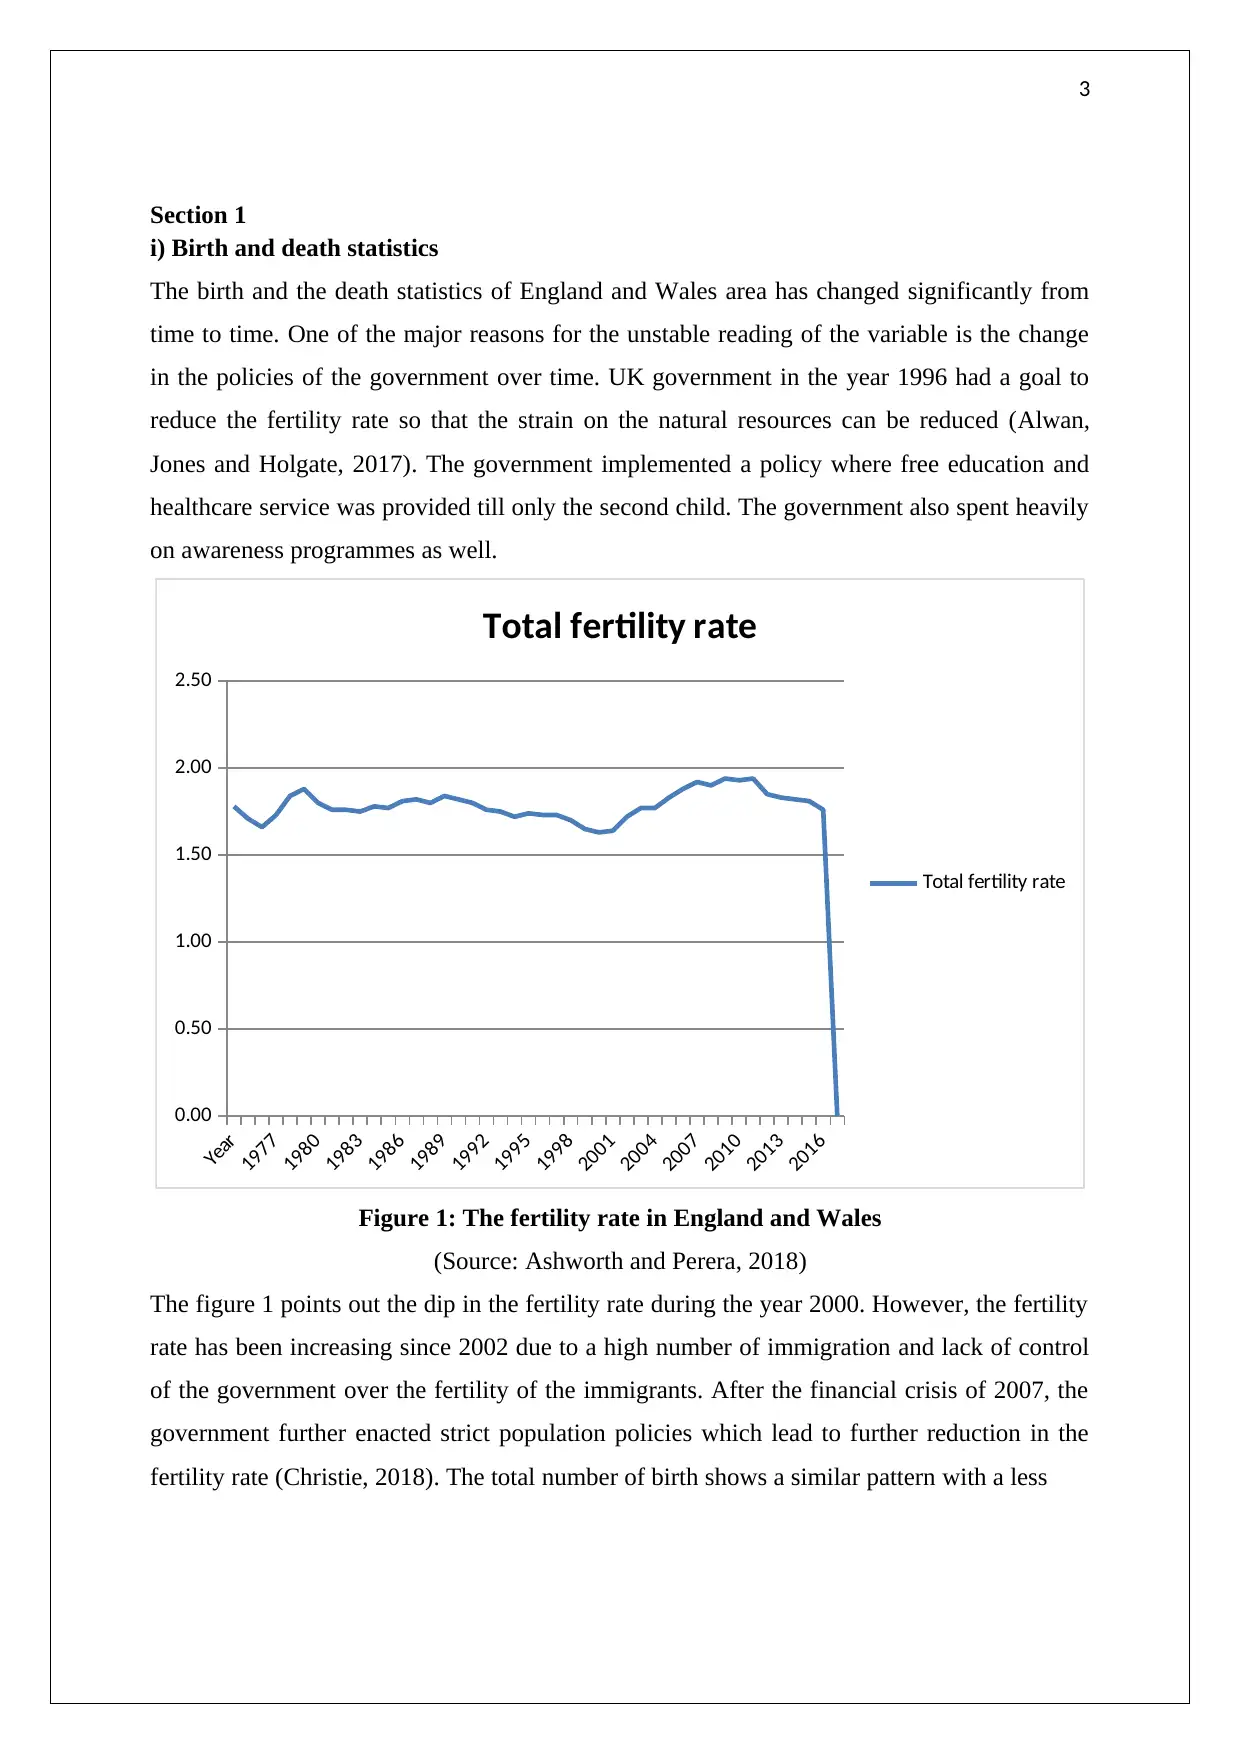
Section 1
i) Birth and death statistics
The birth and the death statistics of England and Wales area has changed significantly from
time to time. One of the major reasons for the unstable reading of the variable is the change
in the policies of the government over time. UK government in the year 1996 had a goal to
reduce the fertility rate so that the strain on the natural resources can be reduced (Alwan,
Jones and Holgate, 2017). The government implemented a policy where free education and
healthcare service was provided till only the second child. The government also spent heavily
on awareness programmes as well.
Year
1977
1980
1983
1986
1989
1992
1995
1998
2001
2004
2007
2010
2013
2016
0.00
0.50
1.00
1.50
2.00
2.50
Total fertility rate
Total fertility rate
Figure 1: The fertility rate in England and Wales
(Source: Ashworth and Perera, 2018)
The figure 1 points out the dip in the fertility rate during the year 2000. However, the fertility
rate has been increasing since 2002 due to a high number of immigration and lack of control
of the government over the fertility of the immigrants. After the financial crisis of 2007, the
government further enacted strict population policies which lead to further reduction in the
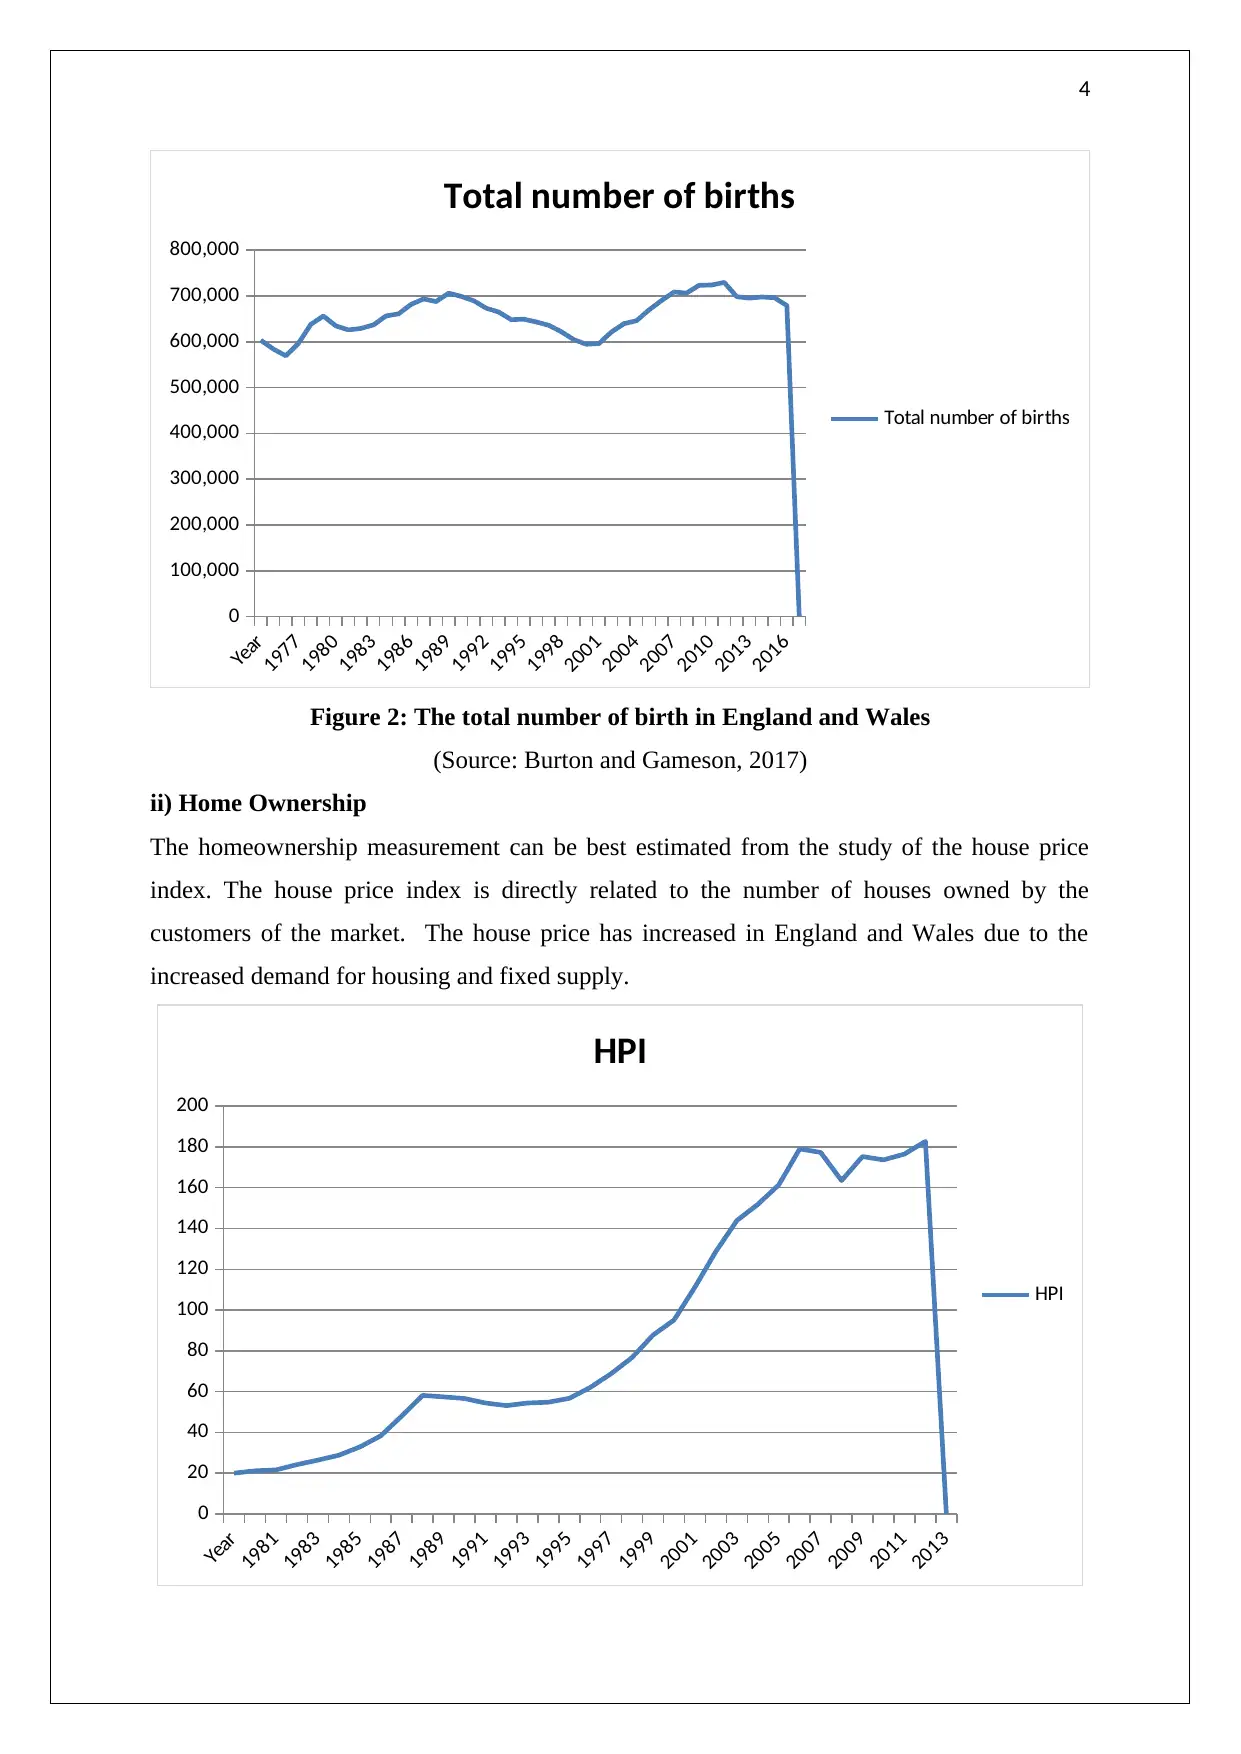
fertility rate (Christie, 2018). The total number of birth shows a similar pattern with a less
Section 1
i) Birth and death statistics
The birth and the death statistics of England and Wales area has changed significantly from
time to time. One of the major reasons for the unstable reading of the variable is the change
in the policies of the government over time. UK government in the year 1996 had a goal to
reduce the fertility rate so that the strain on the natural resources can be reduced (Alwan,
Jones and Holgate, 2017). The government implemented a policy where free education and
healthcare service was provided till only the second child. The government also spent heavily
on awareness programmes as well.
Year
1977
1980
1983
1986
1989
1992
1995
1998
2001
2004
2007
2010
2013
2016
0.00
0.50
1.00
1.50
2.00
2.50
Total fertility rate
Total fertility rate
Figure 1: The fertility rate in England and Wales
(Source: Ashworth and Perera, 2018)
The figure 1 points out the dip in the fertility rate during the year 2000. However, the fertility
rate has been increasing since 2002 due to a high number of immigration and lack of control
of the government over the fertility of the immigrants. After the financial crisis of 2007, the
government further enacted strict population policies which lead to further reduction in the
fertility rate (Christie, 2018). The total number of birth shows a similar pattern with a less
⊘ This is a preview!⊘
Do you want full access?
Subscribe today to unlock all pages.
Trusted by 1+ million students worldwide
4
Year
1977
1980
1983
1986
1989
1992
1995
1998
2001
2004
2007
2010
2013
2016
0
100,000
200,000
300,000
400,000
500,000
600,000
700,000
800,000
Total number of births
Total number of births
Figure 2: The total number of birth in England and Wales
(Source: Burton and Gameson, 2017)
ii) Home Ownership
The homeownership measurement can be best estimated from the study of the house price
index. The house price index is directly related to the number of houses owned by the
customers of the market. The house price has increased in England and Wales due to the
increased demand for housing and fixed supply.
Year
1981
1983
1985
1987
1989
1991
1993
1995
1997
1999
2001
2003
2005
2007
2009
2011
2013
0
20
40
60
80
100
120
140
160
180
200
HPI
HPI
Year
1977
1980
1983
1986
1989
1992
1995
1998
2001
2004
2007
2010
2013
2016
0
100,000
200,000
300,000
400,000
500,000
600,000
700,000
800,000
Total number of births
Total number of births
Figure 2: The total number of birth in England and Wales
(Source: Burton and Gameson, 2017)
ii) Home Ownership
The homeownership measurement can be best estimated from the study of the house price
index. The house price index is directly related to the number of houses owned by the
customers of the market. The house price has increased in England and Wales due to the
increased demand for housing and fixed supply.
Year
1981
1983
1985
1987
1989
1991
1993
1995
1997
1999
2001
2003
2005
2007
2009
2011
2013
0
20
40
60
80
100
120
140
160
180
200
HPI
HPI
Paraphrase This Document
Need a fresh take? Get an instant paraphrase of this document with our AI Paraphraser
5
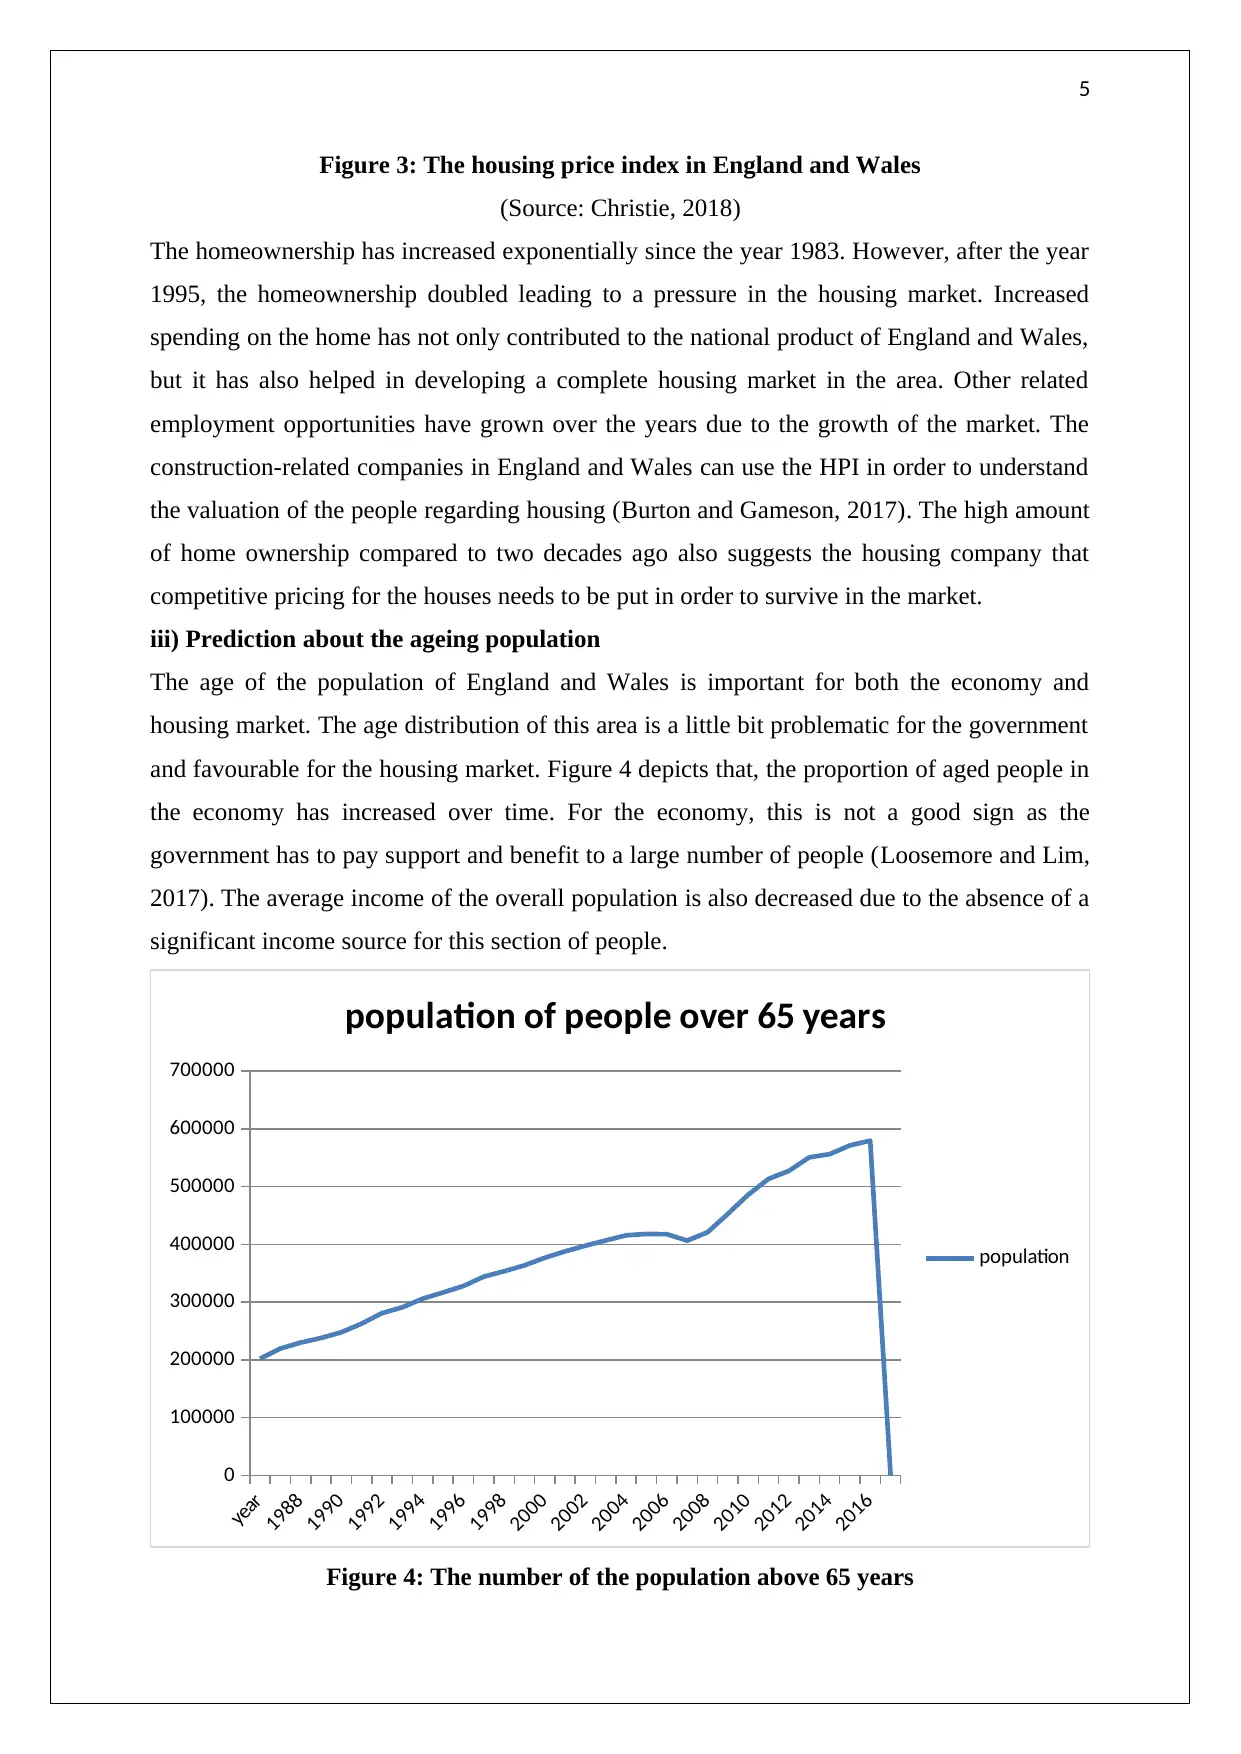
Figure 3: The housing price index in England and Wales
(Source: Christie, 2018)
The homeownership has increased exponentially since the year 1983. However, after the year
1995, the homeownership doubled leading to a pressure in the housing market. Increased
spending on the home has not only contributed to the national product of England and Wales,
but it has also helped in developing a complete housing market in the area. Other related
employment opportunities have grown over the years due to the growth of the market. The
construction-related companies in England and Wales can use the HPI in order to understand
the valuation of the people regarding housing (Burton and Gameson, 2017). The high amount
of home ownership compared to two decades ago also suggests the housing company that
competitive pricing for the houses needs to be put in order to survive in the market.
iii) Prediction about the ageing population
The age of the population of England and Wales is important for both the economy and
housing market. The age distribution of this area is a little bit problematic for the government
and favourable for the housing market. Figure 4 depicts that, the proportion of aged people in
the economy has increased over time. For the economy, this is not a good sign as the
government has to pay support and benefit to a large number of people (Loosemore and Lim,
2017). The average income of the overall population is also decreased due to the absence of a
significant income source for this section of people.
year
1988
1990
1992
1994
1996
1998
2000
2002
2004
2006
2008
2010
2012
2014
2016
0
100000
200000
300000
400000
500000
600000
700000
population of people over 65 years
population
Figure 4: The number of the population above 65 years
6
(Source: Lee and Cullen, 2018)
However, from the perspective of the housing market, the study of data can be informative.
People of this age generally have huge savings which are mostly spent in housing. Therefore,
the housing and construction market of England and Wales can target this segment of the
population for better revenue. It is predicted, given the current scenario that the number of
people above 65 years would further increase making a great opportunity for the construction
industry of the area (Nasir et al. 2017). However, the cost of that which is higher government
spending can increase the price level in the future that in turn can be a negative impact for the
economy as a whole.
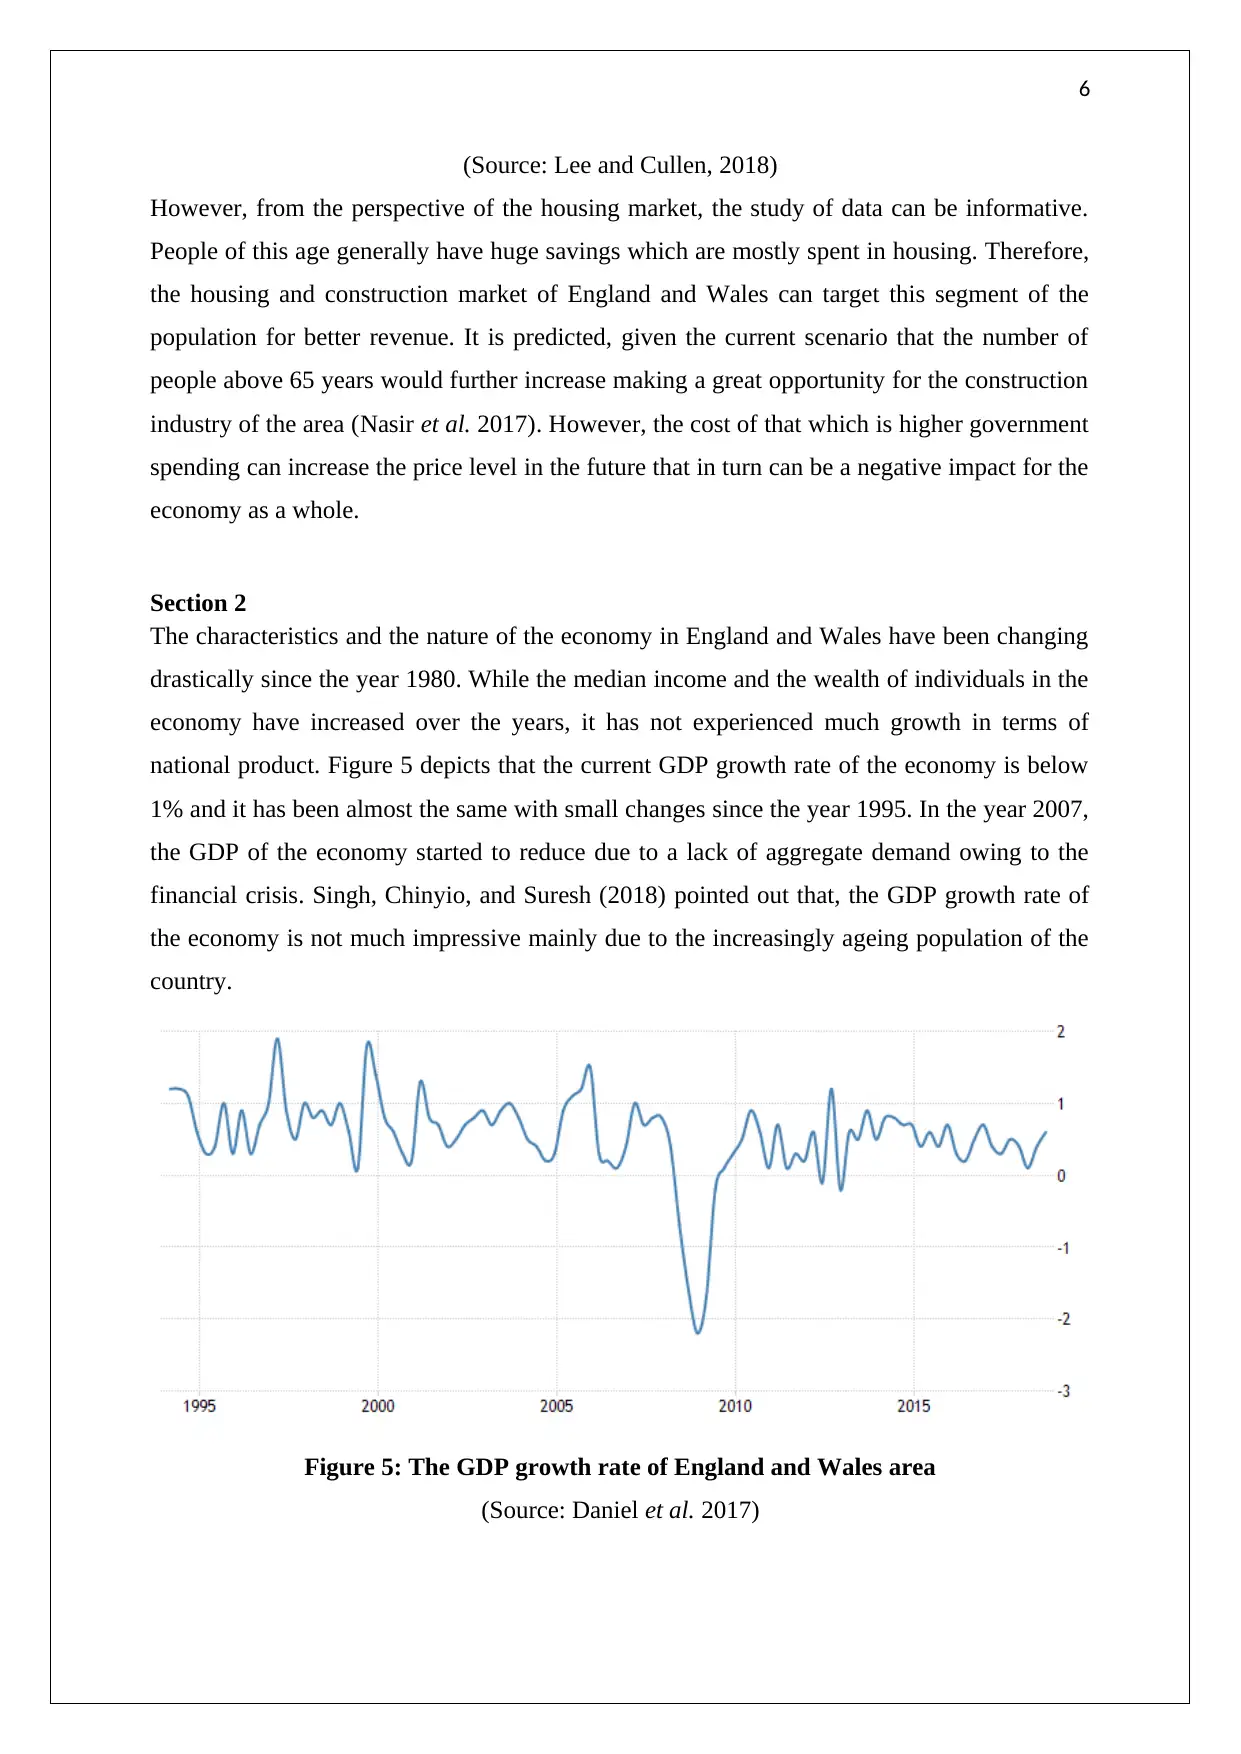
Section 2
The characteristics and the nature of the economy in England and Wales have been changing
drastically since the year 1980. While the median income and the wealth of individuals in the
economy have increased over the years, it has not experienced much growth in terms of
national product. Figure 5 depicts that the current GDP growth rate of the economy is below
1% and it has been almost the same with small changes since the year 1995. In the year 2007,
the GDP of the economy started to reduce due to a lack of aggregate demand owing to the
financial crisis. Singh, Chinyio, and Suresh (2018) pointed out that, the GDP growth rate of
the economy is not much impressive mainly due to the increasingly ageing population of the
country.
Figure 5: The GDP growth rate of England and Wales area
(Source: Daniel et al. 2017)
(Source: Lee and Cullen, 2018)
However, from the perspective of the housing market, the study of data can be informative.
People of this age generally have huge savings which are mostly spent in housing. Therefore,
the housing and construction market of England and Wales can target this segment of the
population for better revenue. It is predicted, given the current scenario that the number of
people above 65 years would further increase making a great opportunity for the construction
industry of the area (Nasir et al. 2017). However, the cost of that which is higher government
spending can increase the price level in the future that in turn can be a negative impact for the
economy as a whole.
Section 2
The characteristics and the nature of the economy in England and Wales have been changing
drastically since the year 1980. While the median income and the wealth of individuals in the
economy have increased over the years, it has not experienced much growth in terms of
national product. Figure 5 depicts that the current GDP growth rate of the economy is below
1% and it has been almost the same with small changes since the year 1995. In the year 2007,
the GDP of the economy started to reduce due to a lack of aggregate demand owing to the
financial crisis. Singh, Chinyio, and Suresh (2018) pointed out that, the GDP growth rate of
the economy is not much impressive mainly due to the increasingly ageing population of the
country.
Figure 5: The GDP growth rate of England and Wales area
(Source: Daniel et al. 2017)
⊘ This is a preview!⊘
Do you want full access?
Subscribe today to unlock all pages.
Trusted by 1+ million students worldwide
7
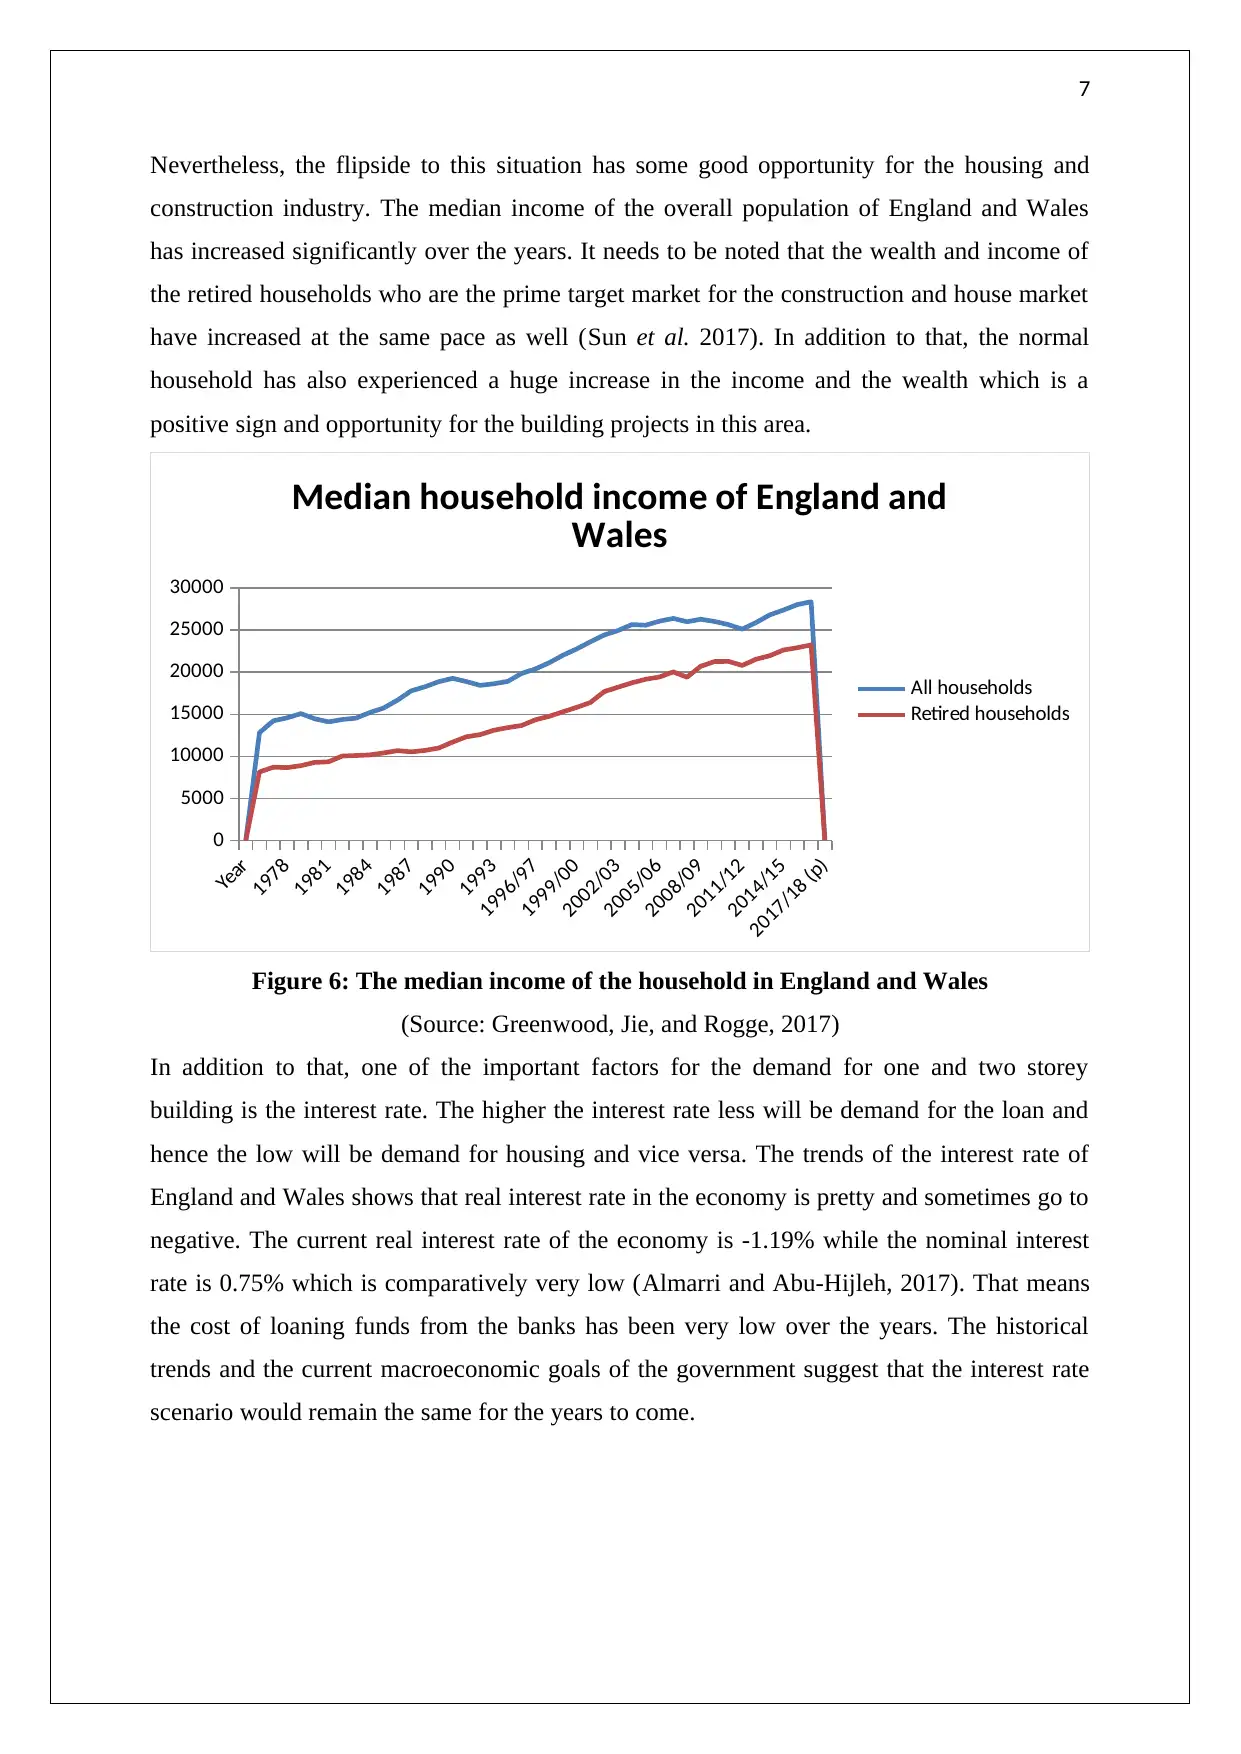
Nevertheless, the flipside to this situation has some good opportunity for the housing and
construction industry. The median income of the overall population of England and Wales
has increased significantly over the years. It needs to be noted that the wealth and income of
the retired households who are the prime target market for the construction and house market
have increased at the same pace as well (Sun et al. 2017). In addition to that, the normal
household has also experienced a huge increase in the income and the wealth which is a
positive sign and opportunity for the building projects in this area.
Year
1978
1981
1984
1987
1990
1993
1996/97
1999/00
2002/03
2005/06
2008/09
2011/12
2014/15
2017/18 (p)
0
5000
10000
15000
20000
25000
30000
Median household income of England and
Wales
All households
Retired households
Figure 6: The median income of the household in England and Wales
(Source: Greenwood, Jie, and Rogge, 2017)
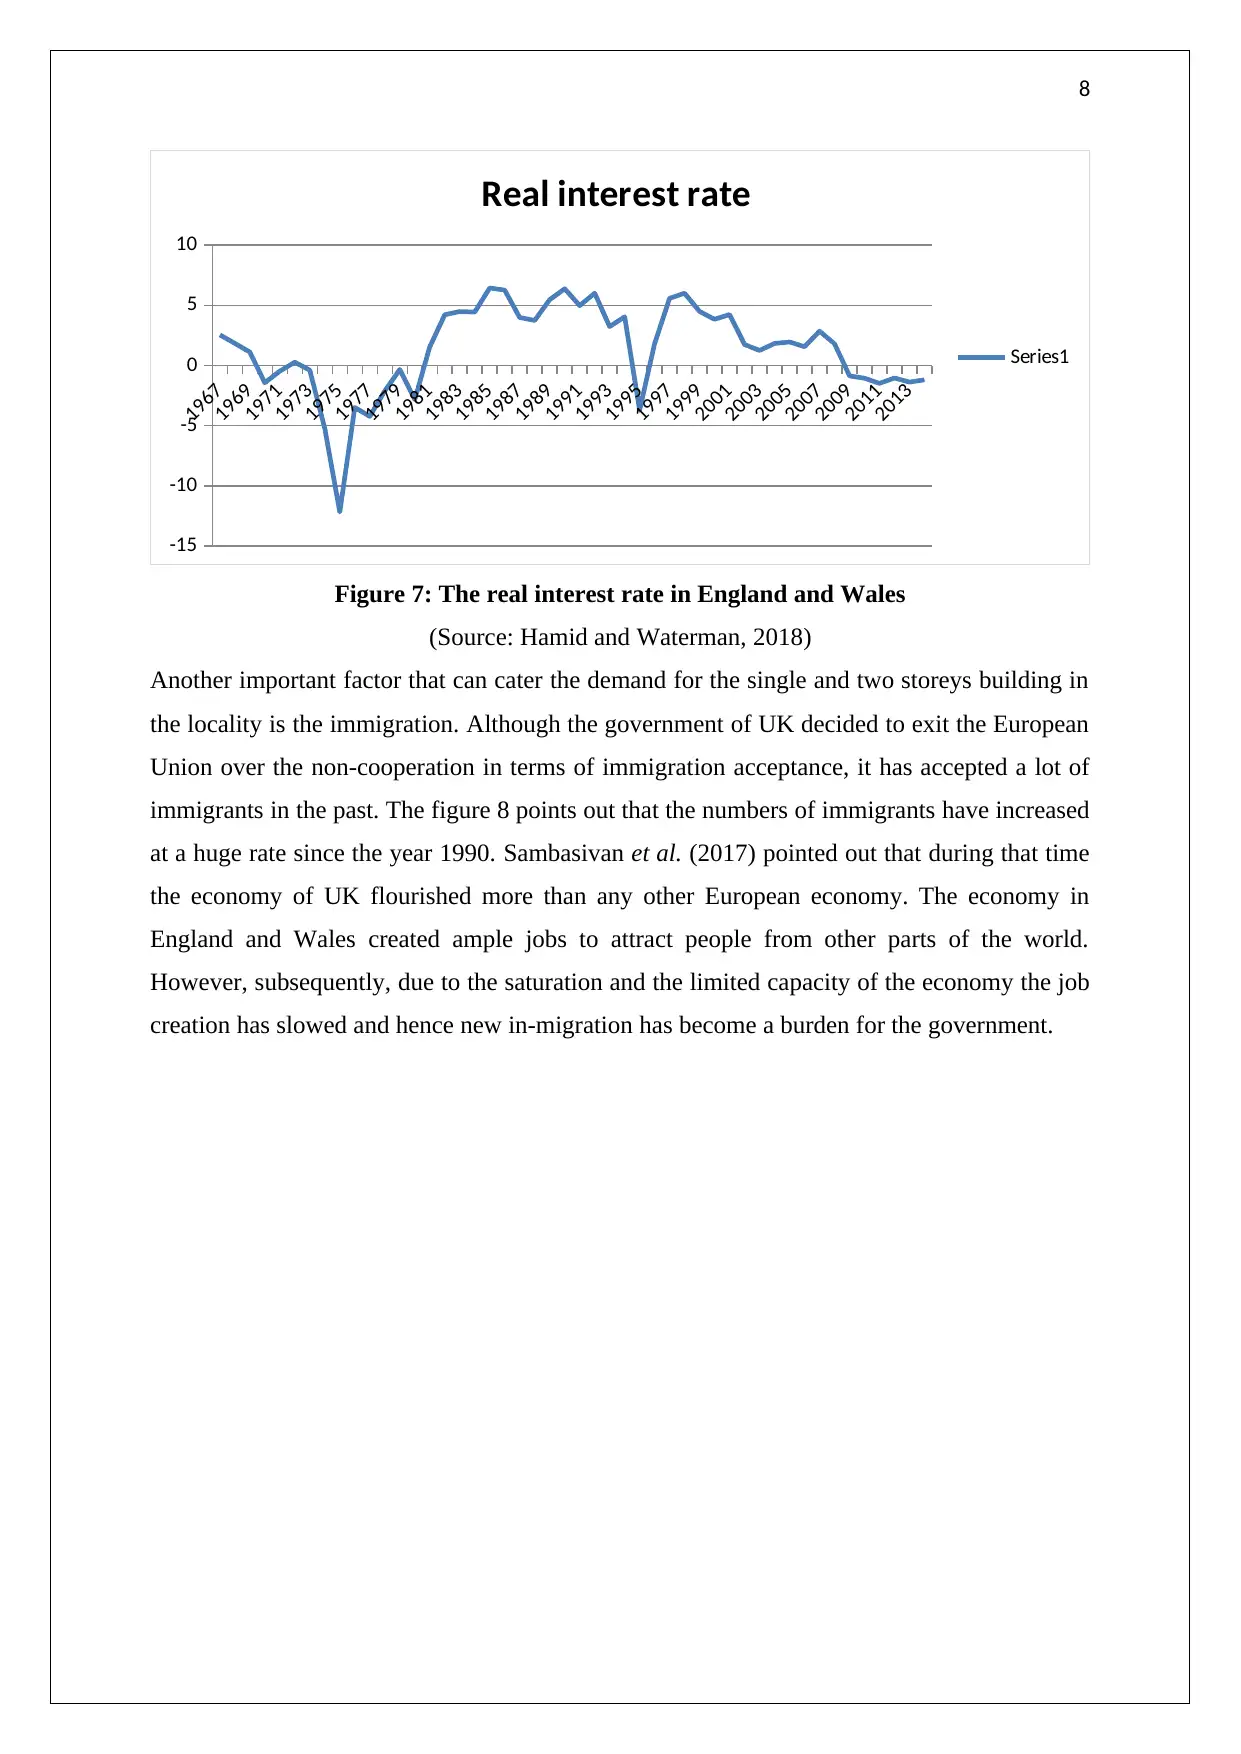
In addition to that, one of the important factors for the demand for one and two storey
building is the interest rate. The higher the interest rate less will be demand for the loan and
hence the low will be demand for housing and vice versa. The trends of the interest rate of
England and Wales shows that real interest rate in the economy is pretty and sometimes go to
negative. The current real interest rate of the economy is -1.19% while the nominal interest
rate is 0.75% which is comparatively very low (Almarri and Abu-Hijleh, 2017). That means
the cost of loaning funds from the banks has been very low over the years. The historical
trends and the current macroeconomic goals of the government suggest that the interest rate
scenario would remain the same for the years to come.
Nevertheless, the flipside to this situation has some good opportunity for the housing and
construction industry. The median income of the overall population of England and Wales
has increased significantly over the years. It needs to be noted that the wealth and income of
the retired households who are the prime target market for the construction and house market
have increased at the same pace as well (Sun et al. 2017). In addition to that, the normal
household has also experienced a huge increase in the income and the wealth which is a
positive sign and opportunity for the building projects in this area.
Year
1978
1981
1984
1987
1990
1993
1996/97
1999/00
2002/03
2005/06
2008/09
2011/12
2014/15
2017/18 (p)
0
5000
10000
15000
20000
25000
30000
Median household income of England and
Wales
All households
Retired households
Figure 6: The median income of the household in England and Wales
(Source: Greenwood, Jie, and Rogge, 2017)
In addition to that, one of the important factors for the demand for one and two storey
building is the interest rate. The higher the interest rate less will be demand for the loan and
hence the low will be demand for housing and vice versa. The trends of the interest rate of
England and Wales shows that real interest rate in the economy is pretty and sometimes go to
negative. The current real interest rate of the economy is -1.19% while the nominal interest
rate is 0.75% which is comparatively very low (Almarri and Abu-Hijleh, 2017). That means
the cost of loaning funds from the banks has been very low over the years. The historical
trends and the current macroeconomic goals of the government suggest that the interest rate
scenario would remain the same for the years to come.
Paraphrase This Document
Need a fresh take? Get an instant paraphrase of this document with our AI Paraphraser
8
1967
1969
1971
1973
1975
1977
1979
1981
1983
1985
1987
1989
1991
1993
1995
1997
1999
2001
2003
2005
2007
2009
2011
2013
-15
-10
-5
0
5
10
Real interest rate
Series1
Figure 7: The real interest rate in England and Wales
(Source: Hamid and Waterman, 2018)
Another important factor that can cater the demand for the single and two storeys building in
the locality is the immigration. Although the government of UK decided to exit the European
Union over the non-cooperation in terms of immigration acceptance, it has accepted a lot of
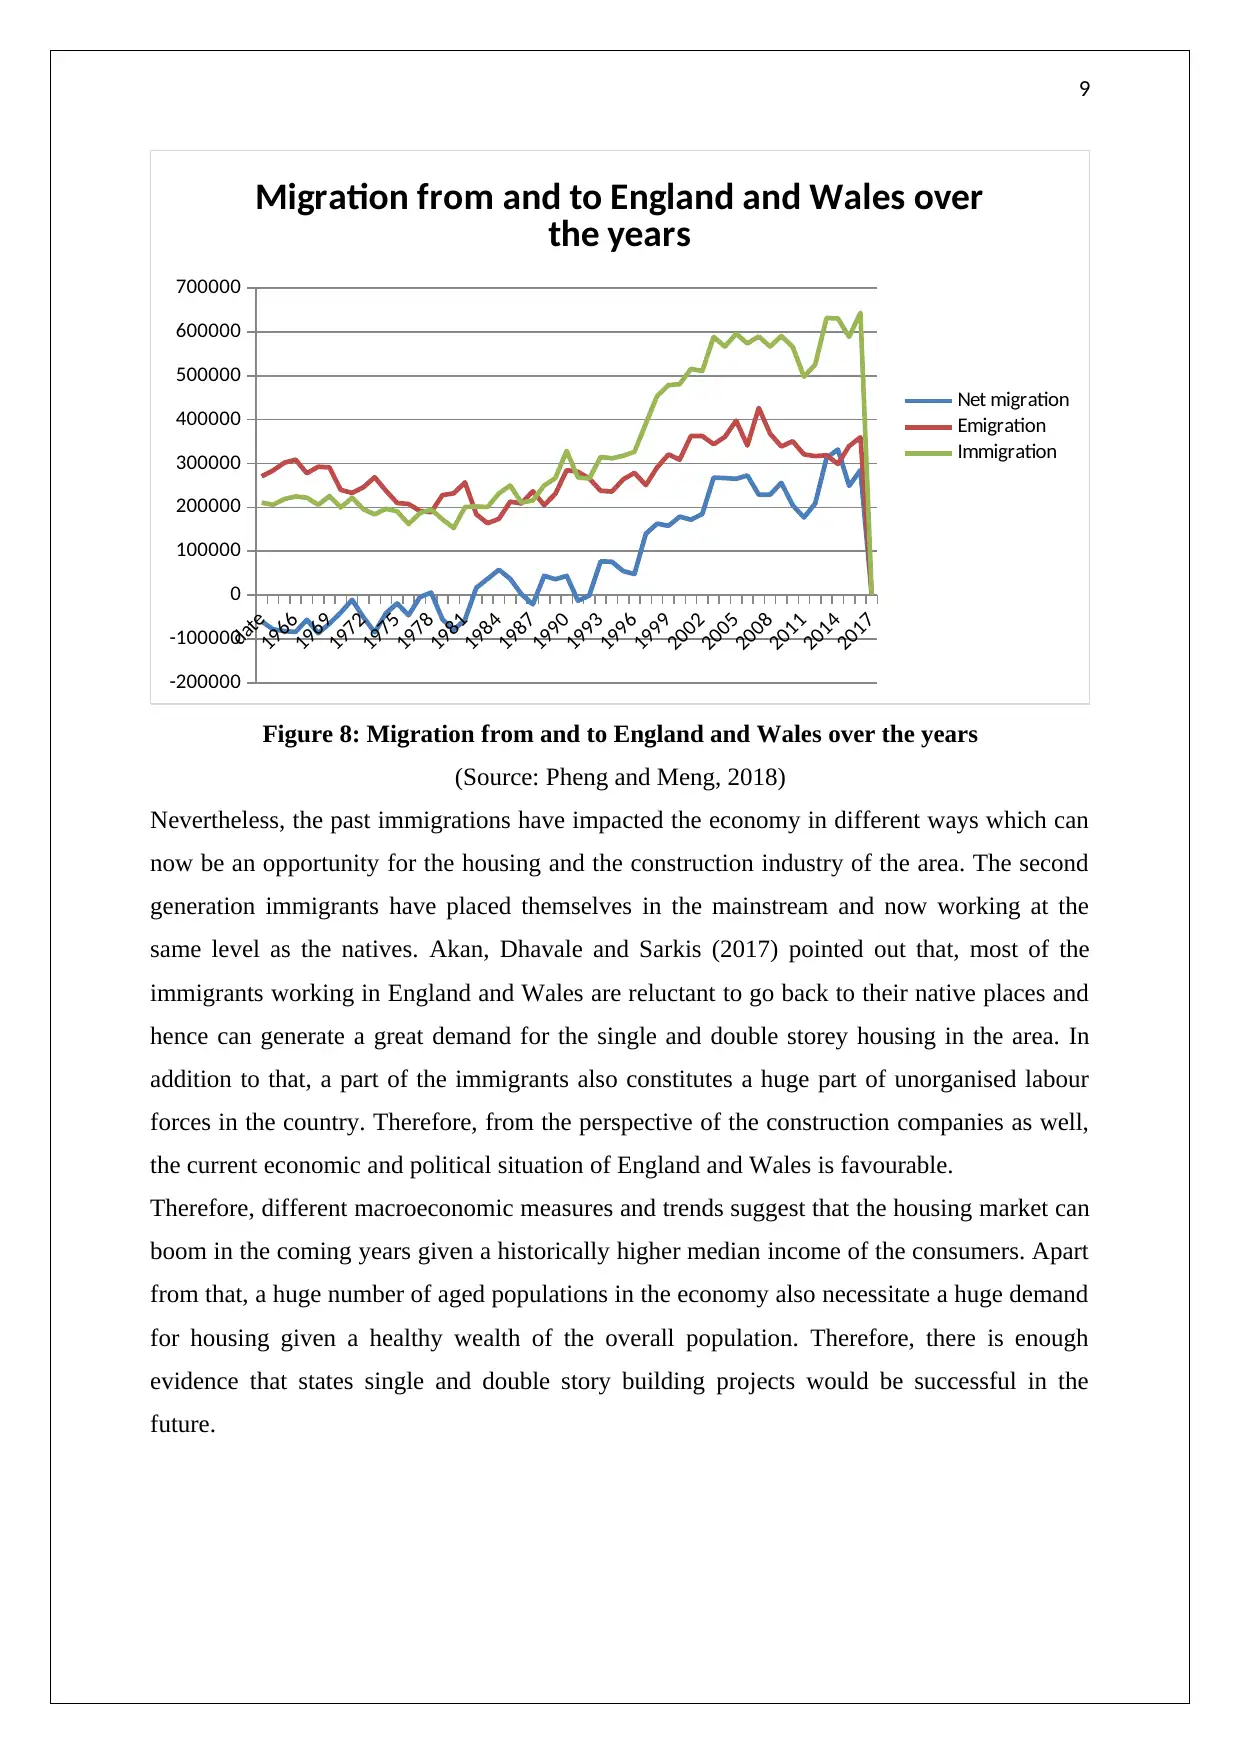
immigrants in the past. The figure 8 points out that the numbers of immigrants have increased
at a huge rate since the year 1990. Sambasivan et al. (2017) pointed out that during that time
the economy of UK flourished more than any other European economy. The economy in
England and Wales created ample jobs to attract people from other parts of the world.
However, subsequently, due to the saturation and the limited capacity of the economy the job
creation has slowed and hence new in-migration has become a burden for the government.
1967
1969
1971
1973
1975
1977
1979
1981
1983
1985
1987
1989
1991
1993
1995
1997
1999
2001
2003
2005
2007
2009
2011
2013
-15
-10
-5
0
5
10
Real interest rate
Series1
Figure 7: The real interest rate in England and Wales
(Source: Hamid and Waterman, 2018)
Another important factor that can cater the demand for the single and two storeys building in
the locality is the immigration. Although the government of UK decided to exit the European
Union over the non-cooperation in terms of immigration acceptance, it has accepted a lot of
immigrants in the past. The figure 8 points out that the numbers of immigrants have increased
at a huge rate since the year 1990. Sambasivan et al. (2017) pointed out that during that time
the economy of UK flourished more than any other European economy. The economy in
England and Wales created ample jobs to attract people from other parts of the world.
However, subsequently, due to the saturation and the limited capacity of the economy the job
creation has slowed and hence new in-migration has become a burden for the government.
9
date
1966
1969
1972
1975
1978
1981
1984
1987
1990
1993
1996
1999
2002
2005
2008
2011
2014
2017
-200000
-100000
0
100000
200000
300000
400000
500000
600000
700000
Migration from and to England and Wales over
the years
Net migration
Emigration
Immigration
Figure 8: Migration from and to England and Wales over the years
(Source: Pheng and Meng, 2018)
Nevertheless, the past immigrations have impacted the economy in different ways which can
now be an opportunity for the housing and the construction industry of the area. The second
generation immigrants have placed themselves in the mainstream and now working at the
same level as the natives. Akan, Dhavale and Sarkis (2017) pointed out that, most of the
immigrants working in England and Wales are reluctant to go back to their native places and
hence can generate a great demand for the single and double storey housing in the area. In
addition to that, a part of the immigrants also constitutes a huge part of unorganised labour
forces in the country. Therefore, from the perspective of the construction companies as well,
the current economic and political situation of England and Wales is favourable.
Therefore, different macroeconomic measures and trends suggest that the housing market can
boom in the coming years given a historically higher median income of the consumers. Apart
from that, a huge number of aged populations in the economy also necessitate a huge demand
for housing given a healthy wealth of the overall population. Therefore, there is enough
evidence that states single and double story building projects would be successful in the
future.
⊘ This is a preview!⊘
Do you want full access?
Subscribe today to unlock all pages.
Trusted by 1+ million students worldwide
10
Section 3
The local construction development projects can raise funds in two different ways, either by
debt financing or by equity financing. Under debt financing, the local construction company
loans funds from the banks or from the investors at a fixed or flexible interest rate.
Construction Company, after the completion and the sale of the project, returns the money
with interest to the investor or to the bank. For the case of the local construction project, a
bank loan would be the best form of debt financing method for raising funds. One of the
biggest advantages of debt financing over the equity financing is that it allows the
construction company to have full control over the projects. In addition to that, financing
through debt also allows the company to claim a tax deduction in the UK that in turn helps in
the profitability of the construction company. Goh et al. (2017) highlighted that, in the case
of local construction projects, the profits are proportionately smaller than bigger projects.
Therefore, debt financing is advantageous as it does not allow a third party to have a share in
the profit. Nevertheless, debt financing can also become a great burden for the project as
repayment does not depend on success or failure. Failing to repay the debt will not only cost
the company legally, but it also affects the credit rating of the company and future projects
would be at risk. Improper money management when debt financing has been chosen can
lead to bankruptcy as well (Na and Subramaniam, 2018). Therefore, while debt financing
provides a greater control it necessitates proper money management in order to be successful.
Another form of financing that can be used by the local construction project is equity
financing. In equity financing, the company transfers shares of the company to the lender.
Therefore, one of the biggest advantages of debt financing is that investors have a vested
interest in the success of the project. Fianto et al. (2018) stated that, in local construction
cases, equity financing allows the project to get additional help from the investors as their
money is at stake as well. The risk involved in equity financing is also lower compared to the
debt financing. The construction company has to share profits only when the company earns
a positive profit. The company also receives a contribution from the investors in case of
decision making which becomes very helpful for the local projects. However, despite some of
the benefits, disadvantages such as less control over the company are also there. Apart from
that, the equity financing is also considered a costlier alternative for financing as the amount
to be paid back is proportionately more than the investment compared to debt financing
(Qureshi, Ahsan, and Azid, 2017). The investors also have their say in the decision making of
the company that can make the project less flexible as well. Thus, while debt financing is less
risky it can be costlier for the local construction company.
Paraphrase This Document
Need a fresh take? Get an instant paraphrase of this document with our AI Paraphraser

11
Section 4
The topic for the portfolio mainly concentrated on the data trends pertaining to England and
Wales that have been used to understand the relation with the construction industry of the
countries. The module has helped me to learn how to analyse data and relate it to a relevant
industry. The data has become important in recent times for the decision making of profit and
nonprofit companies. Therefore, the lessons from this module can be used in real life
situations for the decision making in general. Apart from that, financing is an integral part of
any project or company. This module has helped me to understand how financing works and
what would be the best financing strategy given the size and the environment of the business.
12
Reference
Akan, M.Ö.A., Dhavale, D.G. and Sarkis, J., 2017. Greenhouse gas emissions in the
construction industry: An analysis and evaluation of a concrete supply chain. Journal of
Cleaner Production, 167, pp.1195-1207.
Almarri, K. and Abu-Hijleh, B., 2017. Critical Success Factors for Public-Private
Partnerships in the UAE Construction Industry-A Comparative Analysis between the UAE
and the UK. Journal of Engineering, Project & Production Management, 7(1).
Alwan, Z., Jones, P. and Holgate, P., 2017. Strategic sustainable development in the UK
construction industry, through the framework for strategic sustainable development, using
Building Information Modelling. Journal of Cleaner Production, 140, pp.349-358.
Ashworth, A. and Perera, S., 2018. Contractual procedures in the construction industry.
Routledge.
Burton, M.C. and Gameson, R.N., 2017, September. An evaluation of the factors for a
successful alliance in the United Kingdom (UK) construction industry. In International
Research Conference 2017: Shaping Tomorrow's Built Environment (pp. 530-543). The
University of Salford.
Christie, D.S., 2018. 'Splendid, but what does it actually mean?'Good faith and relational
contracts in the UK construction industry.
Daniel, E.I., Pasquire, C., Dickens, G. and Ballard, H.G., 2017. The relationship between the
Last Planner® System and collaborative planning practice in UK construction. Engineering,
Construction and Architectural Management, 24(3), pp.407-425.
Fianto, B.A., Gan, C., Hu, B. and Roudaki, J., 2018. Equity financing and debt-based
financing: Evidence from Islamic microfinance institutions in Indonesia. Pacific-Basin
Finance Journal, 52, pp.163-172.
Goh, B.W., Lim, C.Y., Lobo, G.J. and Tong, Y.H., 2017. Conditional conservatism and debt
versus equity financing. Contemporary Accounting Research, 34(1), pp.216-251.
⊘ This is a preview!⊘
Do you want full access?
Subscribe today to unlock all pages.
Trusted by 1+ million students worldwide
1 out of 14
Your All-in-One AI-Powered Toolkit for Academic Success.
+13062052269
info@desklib.com
Available 24*7 on WhatsApp / Email
![[object Object]](/_next/static/media/star-bottom.7253800d.svg)
Unlock your academic potential
Copyright © 2020–2026 A2Z Services. All Rights Reserved. Developed and managed by ZUCOL.